201 Hillside Spur · Lake Arrowhead, CA
Flood risk 1/10 · Minimal
- FEMA flood zone
- D
- Chance of flooding over 30 yrs
- 0.0%
- Est. flood insurance / yr
- $544 – $1,084
Fire risk 7/10 · Major
- Est. fire insurance / yr
- $659 – $1,223
Heat risk 3/10 · Minor
- Hot days now (above 85°F)
- 5 days/yr
- Hot days in 30 yrs
- 13 days/yr
Wind risk 1/10 · Minimal
- Chance of severe wind over 30 yrs
- —
Air-quality risk 10/10 · Severe
- Unhealthy air days now
- 30 days/yr
- Unhealthy air days in 30 yrs
- 37 days/yr
Risk factors via First Street. Map © Google.
Why this score? — see what drove the C grade
The composite is a weighted blend of 9 inputs, each scored 0–100. Each bar is that input's sub-score; the figure is the points it added to the 100-point composite (weight × sub-score).
- ARV discount +15.0/15.0
- Cash flow +12.7/30.0
- Appreciation +10.0/10.0
- 1% rule +4.1/10.0
- DSCR +3.8/10.0
- Livability +2.7/5.0
- Rent growth +2.5/5.0
- Condition / age +2.5/5.0
- Schools +2.1/10.0
$149,999
🖨 Deal sheet 📄 Offer letter ✓ Due diligence
Listing remarks MLS
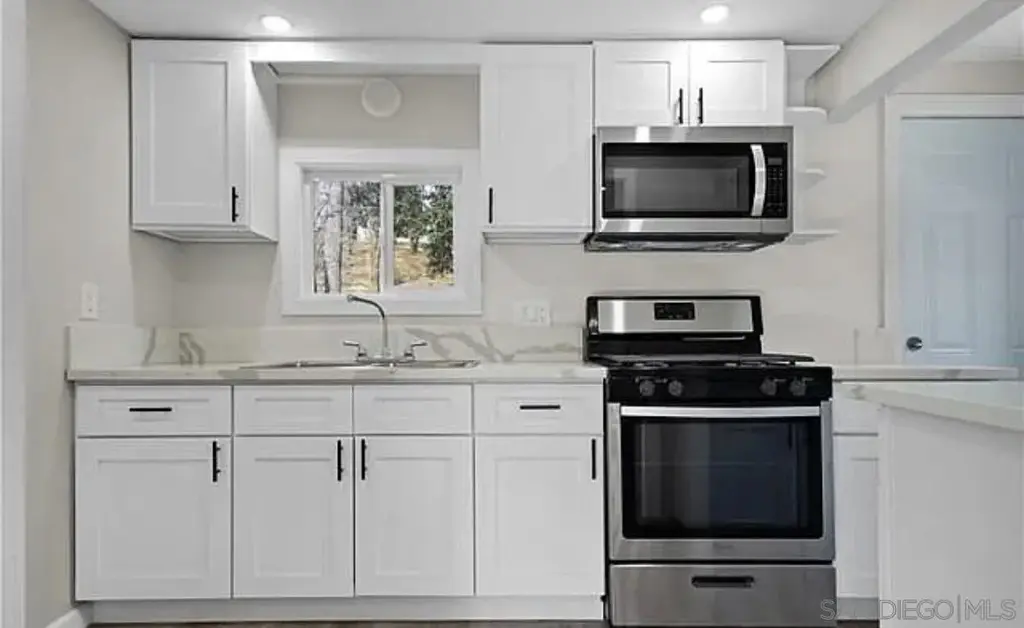
Oh baby is this one nice. Total rehab that includes new paint, new siding, new windows, new flooring, new kitchen, new electric, new appliances and more. Nice, peaceful cozy area of Cedar Glen, but just minutes away from everything that Lake Arrowhead has to offer.
Key facts
- Mountain living
- Shopping
- Cedar glen
Tags
Property features AI
Exterior
- Utilities: Public sewer
- Home design: Single-family detached residence; 1 story
- Construction: Stucco construction
- Exterior features: Shingle roof
Interior
- Bedrooms: 1 possible bedroom
- Bathrooms: 1 full bathroom
- Heating & cooling: Electric heating; Natural gas heating
- Interior features: Fireplace (1)
Neighborhood map
What this means for you Summary
Snapshot
- This is a 1-bed/1.0-bath single-family listed at $150k.
Deal economics
- At list price, monthly cash flow is $-17 ($-207/yr) — negative.
- To cash-flow at today's rent, offer at most $147k (2.0% below list).
- To meet the 1% rule (rent ≥ 1% of price), the offer needs to be $137k (8.5% below list).
- Recommended offer: $137k (8.5% below list) — sets the bar for 1% rule.
- Cap rate 6.2% vs local median 2.8% in Lake Arrowhead — top-decile yield for the area; either an underpriced asset or a hidden risk that comps aren't pricing in. Stress-test before assuming the spread holds.
Location & tenants
- Location reads 53/100 on livability (#965 in CA) — a working-class tenant base; expect higher turnover. Strengths: housing A-, commute B+, employment B; Watch: health & safety C-, crime D+, schools D.
- Rim Of The World Unified (town): math 13% / reading 34% proficiency, ranked #415 of 517 in CA (top 80%) — low school quality limits family demand, transient renter base, plan for 1-2y turnover.
- Market conditions: 77 active listings in the ZIP; 3 comparable units currently listed for rent nearby; rentals leasing fast (median 2d on market — plan ~1-2 weeks tenant-placement turnaround); 5,458 units permitted in San Bernardino County in 2024 (1,500 in 5+ unit buildings).
Forward outlook
- In year one you build about $16k of equity ($1k loan paydown + $15k appreciation (10.0% local appreciation)).
- San Bernardino County population projected at +15% by 2050 — modest demand growth; plan on rents tracking national, not racing it.
- At projected returns (10.0% appreciation + 3.0% rent growth), your $42k cash investment doubles in ~3 years — after that, you're playing with house money.
- By year 3, paydown + projected appreciation supports a ~$41k cash-out refi (75% LTV) — recoverable capital for the next deal without selling this one.
Negotiation context
- It's been on market 42 days — a 3% lower offer ($145k) is reasonable based on typical stale-listing flexibility.
- 5 sale attempts since 9y ago; this cycle's ask has dropped $50k (25%) from the opening price — seller is motivated, your offer sets the floor, not the list.
Risks & watch-outs
- Watch-outs: built in 1936 — expect roof / HVAC / electrical / plumbing capex.
- Climate carrying-cost: major wildfire risk — expect insurance premiums to compound above CPI over the hold.
Questions for the listing agent
- What do current leases actually rent for vs. the listed asking? Can we see a recent rent roll and the last 12 months of T-12 income?
- It's been on market 42 days. Have you received any prior offers? Is the seller open to a 9% concession, seller financing, or rate buy-down credit?
- Built in 1936 — when were the roof, HVAC, electrical panel, plumbing, and water heater last replaced?
- Is there a deadline driving the sale (1031 exchange, divorce, estate, relocation)? That informs how much negotiation room exists.
- Schools are D-rated, which usually means shorter tenancies and higher turnover. Who's the typical renter profile here, and what's been the actual vacancy rate?
- Crime grade is D in this area — have there been break-ins, vandalism, or insurance claims at this property in the last 3 years? What carrier currently insures it and at what premium?
- What's the average days-on-market for RENTAL listings here right now (not sales)? A rising rental-DOM trend means longer vacancies and softer asking-rent achievability than the comps imply.
- What's the recent tenant-quality profile in this submarket — average credit score on applications, eviction rate, late-payment / NSF rate, and stable-employment percentage? A property-management company in the area should have these aggregated.
- How much new for-sale + rental construction is in the pipeline within 1–3 miles? Heavy new supply typically softens prices + rents 12–24 months out; constrained supply supports both.
Investment metrics
- 1% rule
- 0.91% ✗
- Cap rate
- 6.15%
- Cash-on-cash
- -0.49%
- DSCR
- 0.98
- GRM
- 9.1
CMA / ARV
- ARV (median comp)
- $297,011
- List price
- $149,999
- Delta
- -49.50%
- Verdict
- UNDERPRICED
- Comps
- 17 within 1.0 mi
Show comp detail 2 sales within ~0.75 mi
| Address | Dist | Beds/Ba | Sqft | Sold | Price | $/sf | Match |
|---|---|---|---|---|---|---|---|
| 197 Western Dr | 0.21mi | 2/1.0 (+1) | 651 (+7%) | 1mo | $221,500 | $340 | 72 |
| 29235 Lake View Dr | 0.11mi | 2/1.0 (+1) | 609 (+0%) | 22mo | $280,000 | $460 | 72 |
Match score weights: distance 35% · size 25% · config 20% · recency 20%. Top-matched comps best support the ARV.
Projected returns pro-forma
10.0% appreciation · 3.0% rent growth · sell at horizon
- IRR
- 23.9%
- Equity multiple
- 2.92×
- Total profit
- $80,655
- Equity at exit
- $135,131
- IRR
- 21.3%
- Equity multiple
- 6.68×
- Total profit
- $238,501
- Equity at exit
- $291,415
Cash invested: $42,000 (down + closing). Projections, not guarantees.
Landlord ↔ Tenant lean methodology
- Overall (STATE)
- 18 Strongly Tenant-Friendly
- State California
- 18 Strongly Tenant-Friendly · D+13
- County
- — inherits STATE
- City
- — inherits STATE
ZIP-level market 92321
- Home prices YoY
- 3.6%
- Active inventory
- 77
- Price-to-rent
- 9.1×
Monthly cashflow live
- Estimated rent
- $1,372 medium interval (Pro) →
- Mortgage (P&I)
- −$787
- Tax from tax record
- −$252 /mo · $3,028/yr
- Insurance
- −$62
- HOA
- −$0
- Vacancy / Maint / Mgmt
- −$288
- Net cashflow
- $-17
Break-even live
UW: 25.0% down · 7.5% · 30yr · 1.5% tax · 5.0% vac · 8.0% maint · 8.0% mgmt
Financing live
Cash to close
- Down payment
- $37,500
- Closing costs
- $4,500
- Reserves months
- —
- Total cash needed
- —
Loan-product check · same deal, 3 products live
Conventional
25% down · 7.5% · 30yr
- Down + closing
- —
- Monthly P&I
- —
- Monthly cashflow
- —
- DSCR
- —
- Eligible?
- —
Personal DTI + credit; lowest rate.
DSCR
20% down · 8.5% · 30yr
- Down + closing
- —
- Monthly P&I
- —
- Monthly cashflow
- —
- DSCR
- —
- Eligible?
- —
No personal income docs; deal must DSCR.
Hard money
10% down · 12.0% · 12mo
- Down + closing
- —
- Monthly P&I
- —
- Monthly cashflow
- —
- DSCR
- —
- Eligible?
- —
Short-term bridge; refi at stabilization.
Rent comps 3 comps
| Address | Beds | Baths | Sqft | Rent | $/sqft | DOM | Units | Dist |
|---|---|---|---|---|---|---|---|---|
| 354 Emerald Dr Lake Arrowhead, CA | — | 1.0 | 350 | $1,550 | $4.43 | 43d | 1 | 0.33mi |
| 29180 N Dr unit Unit 06 Cedar Glen, CA | — | 1.0 | 400 | $1,050 | $2.62 | 1d | 1 | 0.61mi |
| 29180 North Dr Unit 1 bedroom Cedar Glen, CA | 1.0 | 1.0 | 700 | $1,400 | $2.00 | 1d | 1 | 0.61mi |
Listing history 28 events
-
2026-06-18days on market $149,999 Active 42 DOM
-
2026-06-17days on market $149,999 Active 41 DOM
-
2026-06-16days on market $149,999 Active 40 DOM
-
2026-06-15price $149,999 Active 39 DOM
-
2026-06-15days on market $199,999 Active 39 DOM
-
2026-06-13days on market $199,999 Active 37 DOM
-
2026-06-13days on market $199,999 Active 36 DOM
-
2026-06-09days on market $199,999 Active 33 DOM
-
2026-06-08days on market $199,999 Active 32 DOM
-
2026-06-07days on market $199,999 Active 31 DOM
-
2026-06-04days on market $199,999 Active 28 DOM
-
2026-06-03days on market $199,999 Active 27 DOM
-
2026-06-02days on market $199,999 Active 26 DOM
-
2026-06-01days on market $199,999 Active 25 DOM
-
2026-05-31days on market $199,999 Active 24 DOM
-
2026-05-06$199,999 Active 655-char remark
-
2023-12-30historical
-
2023-08-30price $270,000
-
2023-07-01$280,000 Active
-
2021-07-08soldstatus $220,000 Closed Sale
Show marketing remark (265 chars)
Oh baby is this one nice. Total rehab that includes new paint, new siding, new windows, new flooring, new kitchen, new electric, new appliances and more. Nice, peaceful cozy area of Cedar Glen, but just minutes away from everything that Lake Arrowhead has to offer.
-
2021-07-08soldstatus $220,000
Show marketing remark (265 chars)
Oh baby is this one nice. Total rehab that includes new paint, new siding, new windows, new flooring, new kitchen, new electric, new appliances and more. Nice, peaceful cozy area of Cedar Glen, but just minutes away from everything that Lake Arrowhead has to offer.
-
2021-06-24historical Active Under Contract
Show marketing remark (265 chars)
Oh baby is this one nice. Total rehab that includes new paint, new siding, new windows, new flooring, new kitchen, new electric, new appliances and more. Nice, peaceful cozy area of Cedar Glen, but just minutes away from everything that Lake Arrowhead has to offer.
-
2021-05-10price $219,900
Show marketing remark (265 chars)
Oh baby is this one nice. Total rehab that includes new paint, new siding, new windows, new flooring, new kitchen, new electric, new appliances and more. Nice, peaceful cozy area of Cedar Glen, but just minutes away from everything that Lake Arrowhead has to offer.
-
2021-02-14$249,900 Active
Show marketing remark (265 chars)
Oh baby is this one nice. Total rehab that includes new paint, new siding, new windows, new flooring, new kitchen, new electric, new appliances and more. Nice, peaceful cozy area of Cedar Glen, but just minutes away from everything that Lake Arrowhead has to offer.
-
2019-08-21historical
-
2019-05-16historical
-
2018-08-22$11,500
-
2017-01-16$7,500
ⓘ Source: listings_history table (triggers on properties + properties_extension) + one-shot
backfill from property_details.listing_events for pre-trigger history.
Tax reassessment forecast CA · Resets to sale price
- Current annual tax
- $3,028 · $252/mo
- Projected year-2 tax
- $3,028 · $252/mo
- Expected delta
- $0/yr ($0/mo · -0.0%)
ⓘ Screening estimate from a state-policy table — verify with the county assessor before closing.
Climate risk First Street
- Flood 1/10 Low FEMA zone D · 0% chance over 30 yrs
- Wildfire 7/10 Severe
- Heat 3/10 Moderate 5 d/yr ≥85°F today · 13 d/yr by 30 yrs out
- Wind 1/10 Low
- Air quality 10/10 Extreme 30 unhealthy d/yr today · 37 by 30 yrs out
Nearby sold comps map
Loading sold comps map…
Walkable amenities ~0.75 mi
Loading nearby amenities…
Taxation est. · year 1
- Rental income
- $16,469
- − Mortgage interest
- −$8,402
- − Property taxes
- −$3,028
- − Insurance
- −$750
- − Repairs & maintenance
- −$1,318
- − Management
- −$1,318
- − Depreciation
- −$4,364
- Taxable loss
- −$2,710
- Est. tax savings @ 24.0%
- +$650
- After-tax cash flow
- $443/yr
For passive investors: Depreciation is non-cash, so a rental often shows a tax loss while cash-flowing — sheltering income. Rental losses are passive: they offset passive income freely, and up to $25,000/yr can offset ordinary (W-2) income if you actively participate and your MAGI is under $100k (phasing out to $0 by $150k); unused losses carry forward. On sale, claimed depreciation is recaptured at up to 25%, and gains may owe capital-gains tax (a 1031 exchange can defer both). Figures are a year-1 estimate at your 24.0% rate — not tax advice; consult a CPA.
Schools (NCES district)
- District
- Rim Of The World Unified
- NCES district ID
- 0632610
- Math proficiency
- 13% ▼ -10.00%
- Reading proficiency
- 34% ▼ -7.00%
- Median HH income
- $55,860
- Composite
- 21.29/100
- National rank
- #8389
- State rank
- #415 of 517 in CA
Livability — Lake Arrowhead
- Score
- 53/100
- State rank
- #965
- US rank
- #24524
Category grades
Schools grade is shown separately in the Schools card above.
Census & demographics
- Census place
- Lake Arrowhead, CA
- City population
- 6,246
- Population (ZIP)
- 828
Population outlook (San Bernardino County) Hauer SSP2
- Today (2025)
- 2,300,329 people
- By 2030
- 2,378,907 · +3.4%
- By 2040
- 2,523,137 · +9.7%
- By 2050
- 2,642,388 · +14.9%
- By 2075
- 2,880,769 · +25.2%
- By 2100
- 2,909,436 · +26.5%
Race, ethnicity, and origin ACS 2023
- Neighborhood character
- Majority White (58%)
- Race & ethnicity
- White 58% Hispanic / Latino 41% Two or more races 17%
- Hispanic origin (detail)
- Mexican 36% Salvadoran 2%
- Common ancestry
- Slovak 9% Romanian 5% Lithuanian 3%
- Foreign-born
- 16% · Canada, Dominican Republic
- Languages at home
- 76% English-only · Spanish 18% Other Indo-European 5%
Political lean MEDSL · San Bernardino
- 2024 margin
- Toss-up / Even · D 47.5% · R 49.7% · Other 2.8%
- 2008→2024 swing
- -8.5pp toward R · 2008: 6.3pp · 2024: -2.1pp
- All cycles
- 2024: R+2.1 2020: D+10.7 2016: D+9.8 2012: D+5.4 2008: D+6.3
Not yet ingested
- Civics
- —
Market trends
- HPI YoY
- ▲ 17.53%
- Current HPI
- 510.4737
- Rent YoY
- —
- Metro
- —
- State GDP YoY
- ▲ 3.21%
- F500 in state
- 116
Industry mix (Fortune 500 HQ in CA)
| Industry | F500 HQs | Revenue |
|---|---|---|
| Technology | 27 | $1,492B |
|
||
| Financial Services | 3 | $174B |
|
||
| Retail | 3 | $44B |
|
||
| Insurance | 3 | $26B |
|
||
| Media / Entertainment | 2 | $115B |
|
||
| Pharmaceuticals / Biotech | 2 | $62B |
|
||
Price history
+1900.0% since first listed14 events — show timeline
- 2026-06-15 Price Changed $149,999 SDMLS
- 2026-05-06 Listed $199,999 SDMLS
- 2023-12-30 Listing Removed — CRMLS
- 2023-08-30 Price Changed $270,000 CRMLS
- 2023-07-01 Listed $280,000 CRMLS
- 2021-07-08 Sold (Public Records) $220,000 Public Records
- 2021-07-08 Sold (MLS) $220,000 CRMLS
- 2021-06-24 Contingent — CRMLS
- 2021-05-10 Price Changed $219,900 CRMLS
- 2021-02-14 Listed $249,900 CRMLS
- 2019-08-21 Listing Removed — SDMLS
- 2019-05-16 Listing Removed — SDMLS
- 2018-08-22 Listed $11,500 SDMLS
- 2017-01-16 Listed $7,500 SDMLS
Property tax history
+10.4%/yrLatest (2025): $3,028 · -1.7% YoY. Source: county tax records.
Cash-flow waterfall
monthlySold comps — $/sqft
last 12 mo · ≤1 miLoading sold comps…