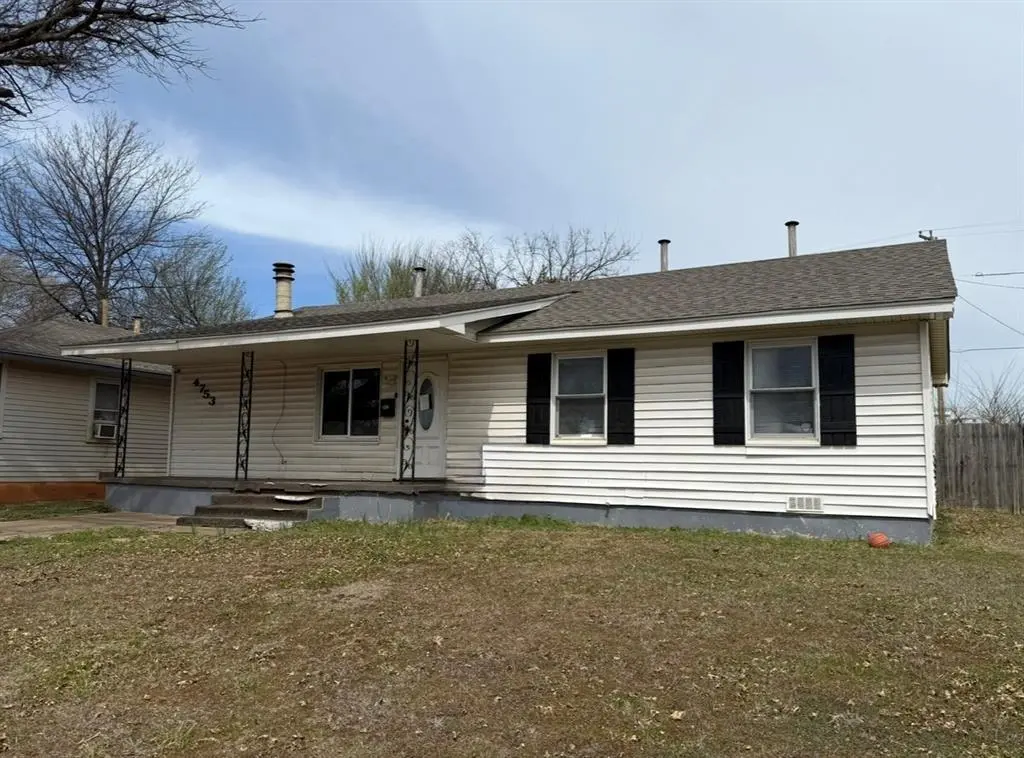
4753 SE 17th St · Del City, OK
Flood risk 1/10 · Minimal
- FEMA flood zone
- X (unshaded)
- Chance of flooding over 30 yrs
- 0.0%
- Est. flood insurance / yr
- $507 – $1,088
Fire risk 1/10 · Minimal
- Est. fire insurance / yr
- $2,463 – $4,575
Heat risk 6/10 · Moderate
- Hot days now (above 107°F)
- 7 days/yr
- Hot days in 30 yrs
- 19 days/yr
Wind risk 3/10 · Minor
- Chance of severe wind over 30 yrs
- 4.0%
Air-quality risk 2/10 · Minimal
- Unhealthy air days now
- 1 days/yr
- Unhealthy air days in 30 yrs
- 3 days/yr
Risk factors via First Street. Map © Google.
Why this score? — see what drove the D- grade
The composite is a weighted blend of 9 inputs, each scored 0–100. Each bar is that input's sub-score; the figure is the points it added to the 100-point composite (weight × sub-score).
- Cash flow +16.9/30.0
- DSCR +5.3/10.0
- 1% rule +4.1/10.0
- ARV discount +3.5/15.0
- Livability +3.2/5.0
- Rent growth +2.8/5.0
- Condition / age +2.5/5.0
- Schools +1.2/10.0
- Appreciation +0.0/10.0
$130,000
🖨 Deal sheet (PDF) 📄 Offer letter ✓ Due diligence
Listing remarks
SELLER FINANCING AVAILABLE!! Welcome to your new dream home, with too many updates to count including refurbished stunning hardwood floors, designated dining nook and laundry room, and statement stone surround wood burning fireplace. Light and bright, with and abundance of natural sunlight, additional storage shed, and large bathroom to boast. This home has so much to offer with a fantastic location next to all of your favorite shopping, restuarants and highway access. Don't miss out on your new home today.
Key facts
- Laundry room
- Storage shed
- Dining nook
Tags
Property features AI
Finance
- Other: Lot approximately 0.1884 acres
- Financial info: Financing options include Cash, Conventional, Lease Purchase, Seller will Finance, Special Funding; Loan qualification possible; Not assumable
- HOA & community: No mandatory association dues
Exterior
- Home design: Single family residence; One level; Residential property
- Construction: Frame construction; Composition roof; Conventional foundation; Built — existing property
- Exterior features: Covered porch; Interior lot
Interior
- Bedrooms: 3 bedrooms
- Bathrooms: 1 full bathroom
- Interior features: One living area; Masonry fireplace
Neighborhood map
What this means for you Summary
Snapshot
- This is a 3-bed/1.0-bath single-family listed at $130k.
Deal economics
- At list price, monthly cash flow is $86 ($1k/yr) — positive.
- The deal already cash-flows at list — no discount required.
- To meet the 1% rule (rent ≥ 1% of price), the offer needs to be $118k (9.3% below list).
- Recommended offer: $118k (9.3% below list) — sets the bar for 1% rule.
- Cap rate 7.1% vs local median 5.9% in Del City — meaningfully above typical; check what's discounted (condition, days-on-market, listing class) to confirm the premium yield is real.
Location & tenants
- Location reads 64/100 on livability (#180 in OK) — a middle-class / working-renter tenant base. Strengths: cost of living A+, housing A+; Watch: health & safety C-, amenities D, crime F.
- Midwest City-Del City (suburban): math 10% / reading 17% proficiency, ranked #231 of 270 in OK (top 86%) — low school quality limits family demand, transient renter base, plan for 1-2y turnover.
- Zoned schools: Del City Es (math 8% / reading 12%, grade F, #711 of 845 statewide, top 87%, 523 students, 0% FRL); Del City Ms (math 4% / reading 11%, grade F, #306 of 345 statewide, top 90%, 925 students, 0% FRL); Del City Hs (math 5% / reading 15%, grade F, #361 of 447 statewide, top 94%, 1,158 students, 0% FRL) — zoned schools average 0% FRL vs 57% district-wide (57 pts lower); this property's tenant base skews higher-income than the district average.
- Market conditions: Rents rising (+1.3%/yr); 121 active listings in the ZIP; 34 comparable units currently listed for rent nearby; rentals at typical pace (median 19d on market — plan ~3-4 weeks tenant-placement turnaround); 5,365 units permitted in Oklahoma County in 2024 (569 in 5+ unit buildings).
- This rent runs 30% of the median local income ($47k/yr) — at the standard rent-burdened threshold; future hikes will face affordability resistance.
Forward outlook
- Local home prices are declining (-3.0%/yr); year-one equity from $899 of loan paydown is wiped out by about $4k of value loss. Plan a longer hold.
- Oklahoma County population projected at +41% by 2050 — long-run rental-demand tailwind backs the buy-and-hold thesis.
Negotiation context
- It's been on market 86 days — a 6% lower offer ($122k) is reasonable based on typical stale-listing flexibility.
- 6 sale attempts since 12y ago with the ask held roughly flat each time — persistent listings suggest the price (not the market) is what's stuck; bring a comps-based counter.
Risks & watch-outs
- Watch-outs: built in 1955 — expect roof / HVAC / electrical / plumbing capex.
- Climate carrying-cost: extreme-heat days projected 7→19/yr by 2055 (HVAC capex compounding) — expect insurance premiums to compound above CPI over the hold.
Questions for the listing agent
- It's been on market 86 days. Have you received any prior offers? Is the seller open to a 9% concession, seller financing, or rate buy-down credit?
- Built in 1955 — when were the roof, HVAC, electrical panel, plumbing, and water heater last replaced?
- Why hasn't it sold? Are there any deal-killer items the seller is aware of (foundation, flood, title, zoning, code violations)?
- Is there a deadline driving the sale (1031 exchange, divorce, estate, relocation)? That informs how much negotiation room exists.
- Schools are F-rated, which usually means shorter tenancies and higher turnover. Who's the typical renter profile here, and what's been the actual vacancy rate?
- Crime grade is F in this area — have there been break-ins, vandalism, or insurance claims at this property in the last 3 years? What carrier currently insures it and at what premium?
- The area grade is low — what's the realistic commute time and amenity access for the typical tenant pool here? Any planned neighborhood developments (good or bad) we should know about?
- What's the average days-on-market for RENTAL listings here right now (not sales)? A rising rental-DOM trend means longer vacancies and softer asking-rent achievability than the comps imply.
- What's the recent tenant-quality profile in this submarket — average credit score on applications, eviction rate, late-payment / NSF rate, and stable-employment percentage? A property-management company in the area should have these aggregated.
- How much new for-sale + rental construction is in the pipeline within 1–3 miles? Heavy new supply typically softens prices + rents 12–24 months out; constrained supply supports both.
Investment metrics
- 1% rule
- 0.91% ✗
- Cap rate
- 7.09%
- Cash-on-cash
- 2.84%
- DSCR
- 1.13
- GRM
- 9.2
CMA / ARV
- ARV (on-the-fly)
- $119,340
- Comps found
- 12
Show comp detail 12 sales within ~0.75 mi
| Address | Dist | Beds/Ba | Sqft | Sold | Price | $/sf | Match |
|---|---|---|---|---|---|---|---|
| 4756 SE 18th St | 0.02mi | 3/1.0 | 884 (0%) | 12mo | $138,500 | $157 | 89 |
| 4753 SE 19th St | 0.21mi | 3/1.0 | 913 (+3%) | 4mo | $115,000 | $126 | 81 |
| 2109 SE Mickey Rd | 0.58mi | 3/1.0 | 849 (-4%) | 7mo | $114,500 | $135 | 60 |
| 4760 SE 23rd St | 0.49mi | 3/1.0 | 950 (+8%) | 6mo | $120,000 | $126 | 60 |
| 4608 SE 23rd St | 0.55mi | 2/1.0 (-1) | 825 (-7%) | 2mo | $90,000 | $109 | 57 |
| 4601 SE 26th St | 0.72mi | 2/1.0 (-1) | 874 (-1%) | 5mo | $119,000 | $136 | 55 |
| 4036 Pine Ave | 0.73mi | 3/1.0 | 834 (-6%) | 2mo | $70,000 | $84 | 54 |
| 4801 Lisa Ln | 0.45mi | 3/1.5 | 1,010 (+14%) | 3mo | $132,000 | $131 | 51 |
| 4804 Park Vista Dr | 0.68mi | 3/1.0 | 979 (+11%) | 1mo | $139,000 | $142 | 49 |
| 4704 Lisa Ln | 0.45mi | 3/1.5 | 1,009 (+14%) | 8mo | $137,000 | $136 | 47 |
| 4316 SE 13th St | 0.64mi | 3/1.0 | 999 (+13%) | 7mo | $125,000 | $125 | 42 |
| 4332 Woodedge Dr | 0.64mi | 3/1.5 | 999 (+13%) | 5mo | $135,000 | $135 | 42 |
Match score weights: distance 35% · size 25% · config 20% · recency 20%. Top-matched comps best support the ARV.
Projected returns pro-forma
-3.0% appreciation · 1.26% rent growth · sell at horizon
- IRR
- -13.7%
- Equity multiple
- 0.52×
- Total profit
- $-17,622
- Equity at exit
- $19,383
- IRR
- -7.7%
- Equity multiple
- 0.55×
- Total profit
- $-16,382
- Equity at exit
- $11,240
Cash invested: $36,400 (down + closing). Projections, not guarantees.
Landlord ↔ Tenant lean methodology
- Overall (STATE)
- 83 Strongly Landlord-Friendly
- State Oklahoma
- 83 Strongly Landlord-Friendly · R+20
- County
- — inherits STATE
- City
- — inherits STATE
ZIP-level market 73115
- Home prices YoY
- -20.9%
- Rents YoY
- 1.3%
- Active inventory
- 121
- Price-to-rent
- 9.2×
Monthly cashflow live
- Estimated rent
- $1,180 high interval (Pro) →
- Mortgage (P&I)
- −$682
- Tax from tax record
- −$110 /mo · $1,319/yr
- Insurance
- −$54
- HOA
- −$0
- Vacancy / Maint / Mgmt
- −$248
- Net cashflow
- $86
Break-even live
Sensitivity live
| Price | -10% $160 | -5% $123 | +0% $86 | +5% $49 | +10% $13 |
|---|---|---|---|---|---|
| Rent | -10% $-7 | -5% $40 | +0% $86 | +5% $133 | +10% $179 |
| Rate | -1.0pp $152 | -0.5pp $119 | base $86 | +0.5pp $52 | +1.0pp $18 |
UW: 25.0% down · 7.5% · 30yr · 1.5% tax · 5.0% vac · 8.0% maint · 8.0% mgmt
Financing live
Cash to close
- Down payment
- $32,500
- Closing costs
- $3,900
- Reserves months
- —
- Total cash needed
- —
Loan-product check · same deal, 3 products live
Conventional
25% down · 7.5% · 30yr
- Down + closing
- —
- Monthly P&I
- —
- Monthly cashflow
- —
- DSCR
- —
- Eligible?
- —
Personal DTI + credit; lowest rate.
DSCR
20% down · 8.5% · 30yr
- Down + closing
- —
- Monthly P&I
- —
- Monthly cashflow
- —
- DSCR
- —
- Eligible?
- —
No personal income docs; deal must DSCR.
Hard money
10% down · 12.0% · 12mo
- Down + closing
- —
- Monthly P&I
- —
- Monthly cashflow
- —
- DSCR
- —
- Eligible?
- —
Short-term bridge; refi at stabilization.
Rent comps 34 comps
| Address | Beds | Baths | Sqft | Rent | $/sqft | DOM | Units | Dist |
|---|---|---|---|---|---|---|---|---|
| 4625 Tinker Diagonal Oklahoma City, OK | 2.0 | 2.0 | 900 | $1,050 | $1.17 | 13d | 1 | 0.22mi |
| 4713 SE 23rd St Oklahoma City, OK | 3.0 | 1.0 | 750 | $1,095 | $1.46 | 25d | 1 | 0.48mi |
| 4772 SE 23rd St Oklahoma City, OK | 3.0 | 1.0 | 1044 | $1,300 | $1.25 | 4d | 1 | 0.50mi |
| 4765 SE 25th St Oklahoma City, OK | 2.0 | 1.0 | 864 | $895 | $1.04 | 6d | 1 | 0.60mi |
| 4340 Woodedge Dr Oklahoma City, OK | 3.0 | 1.0 | 1026 | $1,250 | $1.22 | 4d | 1 | 0.61mi |
| 1700 Karen Dr Oklahoma City, OK | 2.0 | 1.0 | 748 | $950 | $1.27 | 25d | 1 | 0.70mi |
| 4769 SE 27th St Oklahoma City, OK | 3.0 | 1.0 | 1000 | $1,300 | $1.30 | 25d | 1 | 0.74mi |
| 1608 Breckenridge Dr Del City, OK | 2.0 | 1.0 | 820 | $1,050 | $1.28 | 4d | 1 | 0.76mi |
| 4613 SE 27th St Oklahoma City, OK | 2.0 | 1.0 | 768 | $1,050 | $1.37 | 25d | 1 | 0.77mi |
| 3928 Teal Dr Oklahoma City, OK | 3.0 | 1.0 | 1033 | $1,200 | $1.16 | 18d | 1 | 0.80mi |
| 4613 SE 28th St Del City, OK | 3.0 | 1.0 | 1056 | $1,255 | $1.19 | 3d | 1 | 0.83mi |
| 3932 Mallard Dr Oklahoma City, OK | 3.0 | 1.0 | 958 | $950 | $0.99 | 4d | 1 | 0.85mi |
| 3900 Mallard Dr Oklahoma City, OK | 3.0 | 1.0 | 960 | $975 | $1.02 | 17d | 1 | 0.92mi |
| 4650 SE 29th St Del City, OK | 2.0 | 1.0 | 1100 | $900 | $0.82 | 25d | 1 | 0.92mi |
| 4741 Ridgeway Dr Oklahoma City, OK | 2.0 | 1.0 | 615 | $850 | $1.38 | 4d | 7 | 0.99mi |
| 3628 Firethorn Dr Oklahoma City, OK | 3.0 | 1.0 | 968 | $995 | $1.03 | 25d | 1 | 1.04mi |
| 4814 Kristie Dr Oklahoma City, OK | 2.0 | 1.0 | 825 | $895 | $1.08 | 25d | 1 | 1.04mi |
| 6608 SE 15th St Oklahoma City, OK | 3.0 | 2.0 | 1103 | $1,425 | $1.29 | 23d | 1 | 1.09mi |
| 1321 Mallard Dr Oklahoma City, OK | 3.0 | 1.0 | 920 | $1,288 | $1.40 | 25d | 1 | 1.13mi |
| 3812 SE 25th St Del City, OK | 3.0 | 1.0 | 1044 | $1,050 | $1.01 | 25d | 1 | 1.19mi |
| 6000 E Reno Ave Oklahoma City, OK | 1.0–2.0 | 1.0–2.0 | 692 | $989 | $1.43 | 25d | 1 | 1.21mi |
| 1401 Hampton Dr Oklahoma City, OK | 4.0 | 1.5 | 1032 | $1,150 | $1.11 | 6d | 1 | 1.27mi |
| 1111 Jet Dr Oklahoma City, OK | 3.0 | 1.0 | 1067 | $1,095 | $1.03 | 23d | 1 | 1.29mi |
| 1111 Jet Dr Oklahoma City, OK | 3.0 | 1.0 | 1067 | $1,095 | $1.03 | 6d | 1 | 1.29mi |
| 1424 Tanglewood Dr Oklahoma City, OK | 3.0 | 1.0 | 968 | $1,145 | $1.18 | 4d | 1 | 1.30mi |
| 2312 Mustang St Oklahoma City, OK | 3.0 | 1.5 | 912 | $1,100 | $1.21 | 12d | 1 | 1.32mi |
| 423 W Douglas Dr Oklahoma City, OK | 3.0 | 1.0 | 1014 | $1,095 | $1.08 | 23d | 1 | 1.36mi |
| 3204 SE 19th St Oklahoma City, OK | 2.0 | 1.0 | 822 | $1,100 | $1.34 | 6d | 1 | 1.39mi |
| 317 W Peach St Oklahoma City, OK | 2.0 | 1.0 | 878 | $1,045 | $1.19 | 4d | 1 | 1.39mi |
| 407 W Fairchild Dr Oklahoma City, OK | 3.0 | 1.0 | 1062 | $1,045 | $0.98 | 4d | 1 | 1.40mi |
| 314 W Peach St Midwest City, OK | 2.0 | 1.0 | 736 | $950 | $1.29 | 25d | 1 | 1.41mi |
| 313 W Peach St Oklahoma City, OK | 2.0 | 1.0 | 724 | $975 | $1.35 | 18d | 1 | 1.41mi |
| 2333 Becker Pl Del City, OK | 3.0 | 1.0 | 972 | $1,025 | $1.05 | 23d | 1 | 1.42mi |
| 2220 S Air Depot Blvd Oklahoma City, OK | 3.0 | 1.0 | 1020 | $1,395 | $1.37 | 25d | 1 | 1.42mi |
Listing history 36 events
-
2026-06-21days on market $130,000 Active 86 DOM
-
2026-06-18days on market $130,000 Active 83 DOM
-
2026-06-17days on market $130,000 Active 82 DOM
-
2026-06-16days on market $130,000 Active 81 DOM
-
2026-06-15days on market $130,000 Active 80 DOM
-
2026-06-13days on market $130,000 Active 78 DOM
-
2026-06-13days on market $130,000 Active 77 DOM
-
2026-06-09days on market $130,000 Active 74 DOM
-
2026-06-08days on market $130,000 Active 73 DOM
-
2026-06-07days on market $130,000 Active 72 DOM
-
2026-06-05days on market $130,000 Active 69 DOM
-
2026-06-03days on market $130,000 Active 68 DOM
-
2026-06-02days on market $130,000 Active 67 DOM
-
2026-06-01days on market $130,000 Active 66 DOM
-
2026-05-31days on market $130,000 Active 65 DOM
-
2026-03-27$130,000 Active
-
2025-08-09historical
-
2025-06-18price $138,500
-
2025-05-09$140,000 Active
-
2024-07-26soldstatus $1,542,500
-
2023-11-12historical
-
2023-11-03status Active
-
2023-11-01historical
-
2023-10-13status Pending
-
2023-10-05price $125,000
-
2023-09-28status Active
-
2023-09-28price $127,500
-
2023-09-20status Pending
-
2023-09-13$125,000 Active
-
2023-07-28soldstatus $62,000
-
2014-10-23soldstatus $54,000
-
2014-09-30soldstatus $54,000
-
2014-09-30soldstatus $54,000
-
2014-07-15$57,000
-
1993-09-22soldstatus $28,000
-
1993-05-04soldstatus $31,000
ⓘ Source: listings_history table (triggers on properties + properties_extension) + one-shot
backfill from property_details.listing_events for pre-trigger history.
Tax reassessment forecast OK · Resets to sale price
- Current annual tax
- $1,319 · $110/mo
- Projected year-2 tax
- $1,319 · $110/mo
- Expected delta
- $0/yr ($0/mo · 0.0%)
ⓘ Screening estimate from a state-policy table — verify with the county assessor before closing.
Climate risk First Street
- Flood 1/10 Low FEMA zone X (unshaded) · 0% chance over 30 yrs
- Wildfire 1/10 Low
- Heat 6/10 Major 7 d/yr ≥107°F today · 19 d/yr by 30 yrs out
- Wind 3/10 Moderate 4% chance of damaging wind over 30 yrs
- Air quality 2/10 Low 1 unhealthy d/yr today · 3 by 30 yrs out
Nearby sold comps map
Loading sold comps map…
Walkable amenities ~0.75 mi
Loading nearby amenities…
Taxation est. · year 1
- Rental income
- $14,156
- − Mortgage interest
- −$7,282
- − Property taxes
- −$1,319
- − Insurance
- −$650
- − Repairs & maintenance
- −$1,133
- − Management
- −$1,133
- − Depreciation
- −$3,782
- Taxable loss
- −$1,141
- Est. tax savings @ 24.0%
- +$274
- After-tax cash flow
- $1,308/yr
For passive investors: Depreciation is non-cash, so a rental often shows a tax loss while cash-flowing — sheltering income. Rental losses are passive: they offset passive income freely, and up to $25,000/yr can offset ordinary (W-2) income if you actively participate and your MAGI is under $100k (phasing out to $0 by $150k); unused losses carry forward. On sale, claimed depreciation is recaptured at up to 25%, and gains may owe capital-gains tax (a 1031 exchange can defer both). Figures are a year-1 estimate at your 24.0% rate — not tax advice; consult a CPA.
Schools (NCES district)
- District
- Midwest City-Del City
- NCES district ID
- 4019950
- Math proficiency
- 10% ▼ -11.00%
- Reading proficiency
- 17% ▼ -8.00%
- Median HH income
- $45,724
- Composite
- 12.09/100
- National rank
- #9658
- State rank
- #231 of 270 in OK
Livability — Del City
- Score
- 64/100
- State rank
- #180
- US rank
- #14305
Category grades
Schools grade is shown separately in the Schools card above.
Census & demographics
- Census place
- Del City, OK
- County
- Oklahoma County · 771,644 people
- City population
- 20,225
- Metro
- Oklahoma City, OK
- Population (ZIP)
- 20,225
- Household income
- $46,810
- Rent vs Own
- Severe rent burden
- 965.0
Population outlook (Oklahoma County) Hauer SSP2
- Today (2025)
- 911,875 people
- By 2030
- 982,413 · +7.7%
- By 2040
- 1,130,468 · +24.0%
- By 2050
- 1,288,422 · +41.3%
- By 2075
- 1,711,482 · +87.7%
- By 2100
- 2,088,448 · +129.0%
Race, ethnicity, and origin ACS 2023
- Neighborhood character
- Diverse neighborhood (Simpson 0.69)
- Race & ethnicity
- White 50% Black 19% Hispanic / Latino 15% Two or more races 14% Native American 5% Asian 1%
- Hispanic origin (detail)
- Mexican 11% Puerto Rican 2%
- Common ancestry
- Italian 2% Lithuanian 1% Slovak 1%
- Foreign-born
- 4% · Canada
- Languages at home
- 91% English-only · Spanish 8%
Political lean MEDSL · Oklahoma
- 2024 margin
- Toss-up / Even · D 48.0% · R 49.7% · Other 2.3%
- 2008→2024 swing
- +15.1pp toward D · 2008: -16.8pp · 2024: -1.7pp
- All cycles
- 2024: R+1.7 2020: R+1.1 2016: R+10.5 2012: R+16.7 2008: R+16.8
Not yet ingested
- Civics
- —
Market trends
- HPI YoY
- ▼ -71.80%
- Current HPI
- 271.8383
- Rent YoY
- ▲ 1.26%
- Metro
- Oklahoma City, OK
- State GDP YoY
- ▲ 1.55%
- F500 in state
- 6
Industry mix (Fortune 500 HQ in OK)
| Industry | F500 HQs | Revenue |
|---|---|---|
| Energy | 3 | $48B |
|
||
Price history
+319.4% since first listed21 events — show timeline
- 2026-03-27 Listed $130,000 MLSOK
- 2025-08-09 Listing Removed — MLSOK
- 2025-06-18 Price Changed $138,500 MLSOK
- 2025-05-09 Listed $140,000 MLSOK
- 2024-07-26 Sold (Public Records) $1,542,500 Public Records
- 2023-11-12 Listing Removed — MLSOK
- 2023-11-03 Relisted — MLSOK
- 2023-11-01 Listing Removed — MLSOK
- 2023-10-13 Pending — MLSOK
- 2023-10-05 Price Changed $125,000 MLSOK
- 2023-09-28 Relisted — MLSOK
- 2023-09-28 Price Changed $127,500 MLSOK
- 2023-09-20 Pending — MLSOK
- 2023-09-13 Listed $125,000 MLSOK
- 2023-07-28 Sold (Public Records) $62,000 Public Records
- 2014-10-23 Sold (Public Records) $54,000 Public Records
- 2014-09-30 Sold (MLS) $54,000 MLSOK
- 2014-09-30 Sold (MLS) $54,000 MLSOK
- 2014-07-15 Listed $57,000 MLSOK
- 1993-09-22 Sold (Public Records) $28,000 Public Records
- 1993-05-04 Sold (Public Records) $31,000 Public Records
Property tax history
+6.3%/yrLatest (2025): $1,319 · +5.4% YoY. Source: county tax records.
Cash-flow waterfall
monthlySold comps — $/sqft
last 12 mo · ≤1 miLoading sold comps…