 Duplex
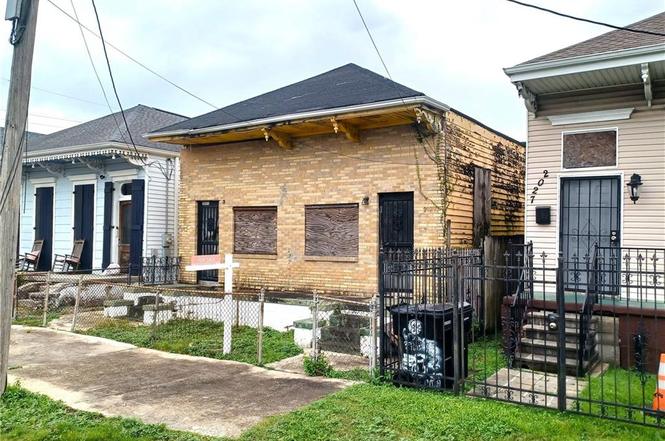
2029-31 St Ann St · New Orleans, LA
Flood risk 8/10 · Major
- FEMA flood zone
- X (shaded)
- Chance of flooding over 30 yrs
- 0.77%
- Est. flood insurance / yr
- $507 – $1,088
Fire risk 1/10 · Minimal
- Est. fire insurance / yr
- $1,269 – $2,357
Heat risk 10/10 · Severe
- Hot days now (above 108°F)
- 7 days/yr
- Hot days in 30 yrs
- 21 days/yr
Wind risk 10/10 · Severe
- Chance of severe wind over 30 yrs
- 99.0%
Air-quality risk 4/10 · Minor
- Unhealthy air days now
- 4 days/yr
- Unhealthy air days in 30 yrs
- 4 days/yr
Risk factors via First Street. Map © Google.
Why this score? — see what drove the D grade
The composite is a weighted blend of 9 inputs, each scored 0–100. Each bar is that input's sub-score; the figure is the points it added to the 100-point composite (weight × sub-score).
- Cash flow +15.0/30.0
- ARV discount +7.5/15.0
- 1% rule +5.0/10.0
- DSCR +5.0/10.0
- Livability +4.0/5.0
- Rent growth +2.5/5.0
- Condition / age +2.5/5.0
- Schools +1.6/10.0
- Appreciation +0.0/10.0
$60,000
🖨 Deal sheet (PDF) 📄 Offer letter ✓ Due diligence
Multi-family units
County records classify this as Multi-Family (2-4 Unit). Listing-text estimate: 2 units. confirmed
Listing remarks
Wow! A Treme duplex available for lot value! This historic Victorian camelback double offers a restoration opportunity in the vital and storied Treme neighborhood. Located approx 10 blocks from the French Quarter and convenient to all that Mid-City has to offer, this would be a great location for a home or investment. Property is in very poor condition as floor joists have been removed on the ground level. At approximately $25/sf, there is tremendous runway for purchasing, renovating and still being below the cost to buy an equivalent turn-key double!
Key facts
- Great location
- Historic victorian
- 3,000 sq ft lot
Tags
Neighborhood map
What this means for you Summary
Snapshot
- This is a 2 × 2-bed/?-bath units multifamily listed at $60k.
Deal economics
- At list price, monthly cash flow is $2k ($26k/yr) — positive. Per door: $1k/mo.
- The deal already cash-flows at list — no discount required.
- Meets the 1% rule at list price ($3k rent vs $60k).
- Recommended offer: $53k (12.0% below list) — sets the bar for market timing.
- Cap rate 51.6% vs local median 4.4% in New Orleans — top-decile yield for the area; either an underpriced asset or a hidden risk that comps aren't pricing in. Stress-test before assuming the spread holds.
Location & tenants
- Location reads 81/100 on livability (#3 in LA, #1,383 nationally) — a professional / high-income tenant draw. Strengths: amenities A+, commute A+, health & safety A+; Watch: crime C-, employment D.
- Orleans Parish (urban): math 11% / reading 27% proficiency, ranked #69 of 98 in LA (top 70%) — low school quality limits family demand, transient renter base, plan for 1-2y turnover; 68% free/reduced lunch — lower-income household profile, screen leases tightly.
- Zoned schools: Benjamin Franklin Elem. Math And Science (math 12% / reading 23%, grade F, #479 of 646 statewide, top 75%, 747 students, 98% FRL, charter) — zoned schools average 98% FRL vs 68% district-wide (30 pts higher); higher-poverty schools than district average — tighter screening recommended.
- Market conditions: Rents flat; 351 active listings in the ZIP; 40 comparable units currently listed for rent nearby; rentals at typical pace (median 26d on market — plan ~3-4 weeks tenant-placement turnaround); 710 units permitted in Orleans Parish in 2024 (244 in 5+ unit buildings).
- At $3,430/mo this rent would consume 79% of the median local household income ($52k/yr) (locally 1001% of renters already pay >50% of income on rent) — very limited rent-growth headroom before tenants either downsize or default.
Forward outlook
- Local home prices are declining (-3.0%/yr); year-one equity from $415 of loan paydown is wiped out by about $2k of value loss. Plan a longer hold.
- Orleans County population projected at +61% by 2050 — long-run rental-demand tailwind backs the buy-and-hold thesis.
- At projected returns (-3.0% appreciation + 0.2% rent growth), your $17k cash investment doubles in ~1 year — after that, you're playing with house money.
Negotiation context
- It's been on market 230 days — a 12% lower offer ($53k) is reasonable based on typical stale-listing flexibility.
- 3 sale attempts since 2y ago; this cycle's ask has dropped $40k (40%) from the opening price — seller is motivated, your offer sets the floor, not the list.
Risks & watch-outs
- Watch-outs: flood insurance adds $66/mo; built in 1920 — expect roof / HVAC / electrical / plumbing capex.
- Climate carrying-cost: severe flood risk; severe wind risk, 99% chance of damaging wind over 30y; extreme-heat days projected 7→21/yr by 2055 (HVAC capex compounding) — expect insurance premiums to compound above CPI over the hold.
Questions for the listing agent
- It's been on market 230 days. Have you received any prior offers? Is the seller open to a 12% concession, seller financing, or rate buy-down credit?
- Can we see the unit-by-unit rent roll, current vacancy, and any below-market leases? What's the average tenancy length?
- What capital expenditures (roof, boiler, parking lot, exteriors) have been made in the last 5 years, and what's planned in the next 2?
- Built in 1920 — when were the roof, HVAC, electrical panel, plumbing, and water heater last replaced?
- What's the actual annual flood-insurance premium (NFIP or private), and is the property in a SFHA with mandatory coverage?
- Why hasn't it sold? Are there any deal-killer items the seller is aware of (foundation, flood, title, zoning, code violations)?
- Is there a deadline driving the sale (1031 exchange, divorce, estate, relocation)? That informs how much negotiation room exists.
- The area grade is low — what's the realistic commute time and amenity access for the typical tenant pool here? Any planned neighborhood developments (good or bad) we should know about?
- What's the average days-on-market for RENTAL listings here right now (not sales)? A rising rental-DOM trend means longer vacancies and softer asking-rent achievability than the comps imply.
- What's the recent tenant-quality profile in this submarket — average credit score on applications, eviction rate, late-payment / NSF rate, and stable-employment percentage? A property-management company in the area should have these aggregated.
- How much new apartment / multifamily construction is in the pipeline within 1–3 miles? Heavy new supply (>2% of stock underway) typically softens rents 12–24 months out; light construction supports rent growth.
Investment metrics
- 1% rule
- 5.72% ✓
- Cap rate
- 51.57%
- Cash-on-cash
- 161.69%
- DSCR
- 8.19
- GRM
- 1.5
CMA / ARV
- ARV (on-the-fly)
- $437,736
- Comps found
- 12
Show comp detail 12 sales within ~0.75 mi
| Address | Dist | Beds/Ba | Sqft | Sold | Price | $/sf | Match |
|---|---|---|---|---|---|---|---|
| 1722 24 St Ann St | 0.20mi | 4/3.5 | 2,240 (-6%) | 1mo | $410,000 | $183 | 77 |
| 209-11 N Johnson St | 0.41mi | 5/4.0 (+1) | 2,345 (-2%) | 14mo | $215,000 | $92 | 61 |
| 1315 17 Saint Philip St | 0.50mi | 4/4.0 | 2,290 (-4%) | 14mo | $405,000 | $177 | 58 |
| 1500 N Dorgenois St | 0.66mi | 4/3.5 | 2,460 (+3%) | 10mo | $355,000 | $144 | 54 |
| 2328 30 Bienville St | 0.43mi | 5/3.5 (+1) | 2,115 (-12%) | 2mo | $400,000 | $189 | 52 |
| 1331 Columbus St | 0.69mi | 5/4.0 (+1) | 2,323 (-3%) | 14mo | $365,000 | $157 | 46 |
| 1501-03 Governor Nicholls St | 0.47mi | 3/4.0 (-1) | 2,680 (+12%) | 10mo | $700,000 | $261 | 45 |
| 934 N Gayoso St | 0.70mi | 4/3.0 | 2,240 (-6%) | 12mo | $520,000 | $232 | 42 |
| 1815 17 Laharpe St | 0.63mi | 4/2.0 | 2,226 (-7%) | 12mo | $335,000 | $150 | 41 |
| 1124-1126 Henriette Delille St | 0.62mi | 4/2.0 | 2,071 (-13%) | 2mo | $157,000 | $76 | 39 |
| 930 32 St Ann St | 0.73mi | 4/4.0 | 2,070 (-14%) | 8mo | $575,000 | $278 | 37 |
| 2734 36 Orchid St | 0.62mi | 5/2.0 (+1) | 2,730 (+14%) | 12mo | $655,000 | $240 | 24 |
Match score weights: distance 35% · size 25% · config 20% · recency 20%. Top-matched comps best support the ARV.
Projected returns pro-forma
-3.0% appreciation · 0.18% rent growth · sell at horizon
- IRR
- —
- Equity multiple
- 8.19×
- Total profit
- $120,861
- Equity at exit
- $8,946
- IRR
- —
- Equity multiple
- 15.83×
- Total profit
- $249,179
- Equity at exit
- $5,188
Cash invested: $16,800 (down + closing). Projections, not guarantees.
Landlord ↔ Tenant lean methodology
- Overall (STATE)
- 90 Strongly Landlord-Friendly
- State Louisiana
- 90 Strongly Landlord-Friendly · R+12
- County
- — inherits STATE
- City
- — inherits STATE
ZIP-level market 70116
- Home prices YoY
- -34.5%
- Rents YoY
- 0.2%
- Active inventory
- 351
- Price-to-rent
- 2.9×
Monthly cashflow live
- Estimated rent
- $3,430 high interval (Pro) →
- Mortgage (P&I)
- −$315
- Tax from tax record
- −$106 /mo · $1,277/yr
- Insurance
- −$25
- Flood insurance flood zone
- −$66 /mo · $798/yr
- HOA
- −$0
- Vacancy / Maint / Mgmt
- −$720
- Net cashflow
- $2,197
Break-even live
Sensitivity live
| Price | -10% $2,231 | -5% $2,214 | +0% $2,197 | +5% $2,180 | +10% $2,163 |
|---|---|---|---|---|---|
| Rent | -10% $1,926 | -5% $2,062 | +0% $2,197 | +5% $2,333 | +10% $2,468 |
| Rate | -1.0pp $2,227 | -0.5pp $2,212 | base $2,197 | +0.5pp $2,182 | +1.0pp $2,166 |
2-unit breakdown (identical units grouped — click to expand)
| Units | Beds | Baths | Est. rent |
|---|---|---|---|
| 2× units | 2 | — | $3,430 |
| #1 | 2 | — | $1,715 |
| #2 | 2 | — | $1,715 |
| Total (2 units) | $3,430 | ||
UW: 25.0% down · 7.5% · 30yr · 1.5% tax · 5.0% vac · 8.0% maint · 8.0% mgmt
Financing live
Cash to close
- Down payment
- $15,000
- Closing costs
- $1,800
- Reserves months
- —
- Total cash needed
- —
Loan-product check · same deal, 3 products live
Conventional
25% down · 7.5% · 30yr
- Down + closing
- —
- Monthly P&I
- —
- Monthly cashflow
- —
- DSCR
- —
- Eligible?
- —
Personal DTI + credit; lowest rate.
DSCR
20% down · 8.5% · 30yr
- Down + closing
- —
- Monthly P&I
- —
- Monthly cashflow
- —
- DSCR
- —
- Eligible?
- —
No personal income docs; deal must DSCR.
Hard money
10% down · 12.0% · 12mo
- Down + closing
- —
- Monthly P&I
- —
- Monthly cashflow
- —
- DSCR
- —
- Eligible?
- —
Short-term bridge; refi at stabilization.
Rent comps 40 comps
| Address | Beds | Baths | Sqft | Rent | $/sqft | DOM | Units | Dist |
|---|---|---|---|---|---|---|---|---|
| 324 N Roman St New Orleans, LA | 3.0 | 3.0 | 2100 | $2,500 | $1.19 | 45d | 1 | 0.33mi |
| 1433 Esplanade Ave New Orleans, LA | 3.0 | 2.0 | 2411 | $5,000 | $2.07 | 4d | 1 | 0.53mi |
| 2731 Saint Philip St Unit 2733 New Orleans, LA | 4.0 | 2.0 | 2000 | $2,600 | $1.30 | 25d | 1 | 0.57mi |
| 1021 Henriette Delille St New Orleans, LA | 3.0 | 2.0 | 2012 | $2,250 | $1.12 | 19d | 1 | 0.58mi |
| 2331 Columbus St New Orleans, LA | 3.0 | 1.0 | 1976 | $1,850 | $0.94 | 25d | 1 | 0.62mi |
| 2738 Bienville St New Orleans, LA | 4.0 | 3.0 | 1671 | $2,200 | $1.32 | 25d | 1 | 0.66mi |
| 618 N Rampart St #204 New Orleans, LA | 3.0 | 2.5 | 1904 | $4,500 | $2.36 | 45d | 1 | 0.66mi |
| 811 Burgundy St New Orleans, LA | 4.0 | 2.5 | 2059 | $5,000 | $2.43 | 45d | 1 | 0.70mi |
| 1000 Saint Philip St New Orleans, LA | 3.0 | 2.5 | 2650 | $4,800 | $1.81 | 45d | 1 | 0.71mi |
| 2664 Lepage St New Orleans, LA | 3.0 | 2.0 | 1750 | $2,725 | $1.56 | 45d | 1 | 0.76mi |
| 839 Dumaine St New Orleans, LA | 3.0 | 4.0 | 2740 | $6,500 | $2.37 | 45d | 1 | 0.79mi |
| 1011 Canal St Unit 1513939P New Orleans, LA | 4.0 | 4.0 | 1765 | $11,253 | $6.38 | 25d | 1 | 0.83mi |
| 1011 Canal St Unit 1513926P New Orleans, LA | 1.0–4.0 | 1.0–4.0 | 1016 | $12,077 | $11.88 | 3d | 2 | 0.83mi |
| 939 Iberville St New Orleans, LA | 1.0–3.0 | 1.0 | 1502 | $3,800 | $2.53 | 13d | 7 | 0.84mi |
| 928 Kerlerec St New Orleans, LA | 3.0 | 3.5 | 1684 | $2,750 | $1.63 | 5d | 1 | 0.86mi |
| 928 Kerlerec St New Orleans, LA | 3.0 | 3.5 | 1684 | $2,750 | $1.63 | 5d | 1 | 0.86mi |
| 3024 Esplanade Ave New Orleans, LA | 3.0 | 2.5 | 2300 | $4,500 | $1.96 | 45d | 1 | 0.93mi |
| 1860 Burgundy St New Orleans, LA | 4.0 | 4.0 | 3000 | $3,500 | $1.17 | 25d | 1 | 0.93mi |
| 227 S Gayoso St Unit 2h New Orleans, LA | 3.0 | 2.0 | 1800 | $2,500 | $1.39 | 45d | 1 | 0.96mi |
| 751 Chartres St New Orleans, LA | 2.0–3.0 | 2.0 | 1461 | $3,450 | $2.36 | 45d | 1 | 0.97mi |
| 527 Saint Ann St Unit 3 New Orleans, LA | 3.0 | 2.0 | 1687 | $3,500 | $2.07 | 45d | 1 | 1.01mi |
| 515 Saint Ann St Unit 3 New Orleans, LA | 3.0 | 2.0 | 1644 | $3,600 | $2.19 | 46d | 1 | 1.03mi |
| 1831 N Miro St New Orleans, LA | 3.0 | 2.0 | 1882 | $2,500 | $1.33 | 45d | 1 | 1.04mi |
| 3232 Grand Rte Saint John St New Orleans, LA | 3.0 | 3.0 | 2800 | $5,000 | $1.79 | 25d | 1 | 1.04mi |
| 535 Decatur St Unit 3 New Orleans, LA | 3.0 | 2.0 | 1600 | $2,800 | $1.75 | 13d | 1 | 1.06mi |
| 1936 N Johnson St Unit 36 New Orleans, LA | 3.0 | 2.0 | 1844 | $2,400 | $1.30 | 25d | 1 | 1.07mi |
| 1938 N Johnson St Unit 38 New Orleans, LA | 3.0 | 2.0 | 1844 | $2,400 | $1.30 | 25d | 1 | 1.08mi |
| 800 Gravier St Unit 1272312P New Orleans, LA | 2.0–4.0 | 2.0–4.0 | 1673 | $6,169 | $3.69 | 16d | 2 | 1.12mi |
| 822 Perdido St Unit 1272370P New Orleans, LA | 1.0–5.0 | 1.0–5.0 | 1447 | $5,974 | $4.13 | 5d | 4 | 1.15mi |
| 419 Carondelet St Unit PHB New Orleans, LA | 3.0 | 2.5 | 2546 | $5,700 | $2.24 | 5d | 1 | 1.17mi |
| 1837 Touro St New Orleans, LA | 3.0 | 1.0 | 1994 | $2,000 | $1.00 | 25d | 1 | 1.17mi |
| 518 S Rampart St New Orleans, LA | 3.0 | 2.0 | 1853 | $3,995 | $2.16 | 5d | 1 | 1.18mi |
| 305 S Norman C Francis Pkwy New Orleans, LA | 3.0 | 1.5 | 1730 | $2,500 | $1.45 | 16d | 1 | 1.22mi |
| 305 S Norman C Francis Pkwy New Orleans, LA | 3.0 | 1.5 | 1730 | $2,600 | $1.50 | 19d | 1 | 1.22mi |
| 2920 Pauger St New Orleans, LA | 4.0 | 2.0 | 1882 | $1,995 | $1.06 | 25d | 1 | 1.24mi |
| 3700 Orleans Ave New Orleans, LA | 1.0–3.0 | 1.0–2.0 | 1081 | $2,945 | $2.72 | 5d | 48 | 1.25mi |
| 431 Gravier St Ste 4 New Orleans, LA | 3.0 | 2.0 | 2100 | $3,700 | $1.76 | 45d | 1 | 1.26mi |
| 2317 N Rampart St Unit 1272378P New Orleans, LA | 3.0–6.0 | 2.0–4.0 | 1581 | $4,154 | $2.63 | 5d | 2 | 1.27mi |
| 2320 N Rampart St New Orleans, LA | 3.0 | 3.0 | 2317 | $3,700 | $1.60 | 45d | 1 | 1.27mi |
| 1000 Girod St Ph 2 New Orleans, LA | 3.0 | 3.5 | 2008 | $4,800 | $2.39 | 45d | 1 | 1.31mi |
Listing history 12 events
-
2026-02-27status Pending
-
2026-02-03price $60,000
-
2025-12-29price $69,000
-
2025-10-23price $70,000
-
2025-08-09price $80,000
-
2025-07-11$100,000 Active
-
2024-10-30price $125,000
-
2024-10-30price $125,000
-
2024-10-29price $125,000
-
2024-09-23$149,000 Active
-
2024-09-13$149,000 Active
-
2024-08-23soldstatus $60,000
ⓘ Source: listings_history table (triggers on properties + properties_extension) + one-shot
backfill from property_details.listing_events for pre-trigger history.
Tax reassessment forecast LA · Resets to sale price
- Current annual tax
- $1,277 · $106/mo
- Projected year-2 tax
- $1,277 · $106/mo
- Expected delta
- $0/yr ($0/mo · 0.0%)
ⓘ Screening estimate from a state-policy table — verify with the county assessor before closing.
Climate risk First Street
- Flood 8/10 Severe FEMA zone X (shaded) · 77% chance over 30 yrs
- Wildfire 1/10 Low
- Heat 10/10 Extreme 7 d/yr ≥108°F today · 21 d/yr by 30 yrs out
- Wind 10/10 Extreme 99% chance of damaging wind over 30 yrs
- Air quality 4/10 Moderate 4 unhealthy d/yr today · 4 by 30 yrs out
Nearby sold comps map
Loading sold comps map…
Walkable amenities ~0.75 mi
Loading nearby amenities…
Taxation est. · year 1
- Rental income
- $41,160
- − Mortgage interest
- −$3,361
- − Property taxes
- −$1,277
- − Insurance
- −$1,098
- − Repairs & maintenance
- −$3,293
- − Management
- −$3,293
- − Depreciation
- −$1,745
- Taxable income
- $27,093
- Est. tax owed @ 24.0%
- −$6,502
- After-tax cash flow
- $19,863/yr
For passive investors: Depreciation is non-cash, so a rental often shows a tax loss while cash-flowing — sheltering income. Rental losses are passive: they offset passive income freely, and up to $25,000/yr can offset ordinary (W-2) income if you actively participate and your MAGI is under $100k (phasing out to $0 by $150k); unused losses carry forward. On sale, claimed depreciation is recaptured at up to 25%, and gains may owe capital-gains tax (a 1031 exchange can defer both). Figures are a year-1 estimate at your 24.0% rate — not tax advice; consult a CPA.
Schools (NCES district)
- District
- Orleans Parish
- NCES district ID
- 2201170
- Math proficiency
- 11% ▼ -52.00%
- Reading proficiency
- 27% ▼ -46.00%
- Median HH income
- $37,011
- Composite
- 15.78/100
- National rank
- #9271
- State rank
- #69 of 98 in LA
Livability — New Orleans
- Score
- 81/100
- State rank
- #3
- US rank
- #1383
Category grades
Schools grade is shown separately in the Schools card above.
Census & demographics
- Census place
- New Orleans, LA
- County
- Orleans Parish · 338,817 people
- City population
- 338,817
- Metro
- New Orleans-Metairie, LA
- Population (ZIP)
- 10,404
- Household income
- $52,306
- Rent vs Own
- Severe rent burden
- 1001.0
Population outlook (Orleans County) Hauer SSP2
- Today (2025)
- 513,025 people
- By 2030
- 575,781 · +12.2%
- By 2040
- 700,174 · +36.5%
- By 2050
- 826,541 · +61.1%
- By 2075
- 1,123,374 · +119.0%
- By 2100
- 1,355,609 · +164.2%
Race, ethnicity, and origin ACS 2023
- Neighborhood character
- Diverse neighborhood (Simpson 0.63)
- Race & ethnicity
- White 45% Black 40% Hispanic / Latino 10% Two or more races 8%
- Hispanic origin (detail)
- Mexican 1% Cuban 3%
- Common ancestry
- Lithuanian 6% Slovak 3% Romanian 3%
- Foreign-born
- 5% · Canada
- Languages at home
- 90% English-only · Spanish 6% French/Haitian/Cajun 2%
Political lean MEDSL · Orleans
- 2024 margin
- Solid D (+67.0) · D 82.2% · R 15.2% · Other 2.7%
- 2008→2024 swing
- +6.7pp toward D · 2008: 60.3pp · 2024: 67.0pp
- All cycles
- 2024: D+67.0 2020: D+68.2 2016: D+66.2 2012: D+62.5 2008: D+60.3
Not yet ingested
- Civics
- —
Market trends
- HPI YoY
- ▼ -144.83%
- Current HPI
- 275.5453
- Rent YoY
- ▲ 0.18%
- Metro
- New Orleans-Metairie, LA
- State GDP YoY
- ▲ 3.29%
- F500 in state
- 10
Industry mix (Fortune 500 HQ in LA)
| Industry | F500 HQs | Revenue |
|---|---|---|
| Telecommunications | 2 | $23B |
|
||
| Utilities | 1 | $12B |
|
||
| Wholesale / Distribution | 1 | $5B |
|
||
| Advertising | 1 | $2B |
|
||
Price history
+0.0% since first listed12 events — show timeline
- 2026-02-27 Pending — AcadianaMLS
- 2026-02-03 Price Changed $60,000 AcadianaMLS
- 2025-12-29 Price Changed $69,000 AcadianaMLS
- 2025-10-23 Price Changed $70,000 AcadianaMLS
- 2025-08-09 Price Changed $80,000 AcadianaMLS
- 2025-07-11 Listed $100,000 AcadianaMLS
- 2024-10-30 Price Changed $125,000 AcadianaMLS
- 2024-10-30 Price Changed $125,000 AcadianaMLS
- 2024-10-29 Price Changed $125,000 GSREIN
- 2024-09-23 Listed $149,000 AcadianaMLS
- 2024-09-13 Listed $149,000 AcadianaMLS
- 2024-08-23 Sold (Public Records) $60,000 Public Records
Property tax history
+9.2%/yrLatest (2026): $1,277 · -56.5% YoY. Source: county tax records.
Cash-flow waterfall
monthlySold comps — $/sqft
last 12 mo · ≤1 miLoading sold comps…