 Multi-family
18350 Hatteras St · Los Angeles, CA
Flood risk 5/10 · Moderate
- FEMA flood zone
- X (unshaded)
- Chance of flooding over 30 yrs
- 0.24%
- Est. flood insurance / yr
- $507 – $1,088
Fire risk 1/10 · Minimal
- Est. fire insurance / yr
- $659 – $1,223
Heat risk 5/10 · Moderate
- Hot days now (above 101°F)
- 8 days/yr
- Hot days in 30 yrs
- 22 days/yr
Wind risk 1/10 · Minimal
- Chance of severe wind over 30 yrs
- —
Air-quality risk 5/10 · Moderate
- Unhealthy air days now
- 7 days/yr
- Unhealthy air days in 30 yrs
- 8 days/yr
Risk factors via First Street. Map © Google.
Why this score? — see what drove the B- grade
The composite is a weighted blend of 9 inputs, each scored 0–100. Each bar is that input's sub-score; the figure is the points it added to the 100-point composite (weight × sub-score).
- Cash flow +30.0/30.0
- 1% rule +10.0/10.0
- DSCR +10.0/10.0
- ARV discount +7.5/15.0
- Schools +3.6/10.0
- Livability +3.4/5.0
- Condition / age +2.5/5.0
- Rent growth +1.5/5.0
- Appreciation +0.0/10.0
$405,000
🖨 Deal sheet 📄 Offer letter ✓ Due diligence
Multi-family units
County records classify this as Multi-Family (5+ Unit). Listing-text estimate: 1 unit. estimate disagrees with records
5+ unit building — per-unit beds/baths from public records are typically unavailable; the breakdown below (if shown) is an estimate from the listing text.
Listing remarks
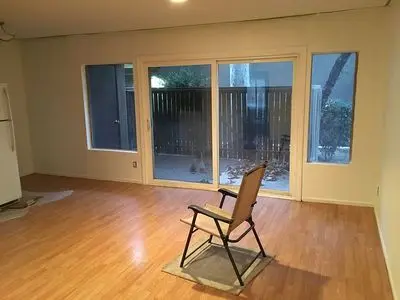
1 st floor with patio, short distance to 2 gated parking spaces, large community pool. new HVAC ystem
Key facts
- 1st floor
- Community pool
- Gated parking
Tags
Property features AI
Exterior
- Home design: Built in 1972
- Construction: Living area approximately 780
- Exterior features: Located in the Tarzana neighborhood
Neighborhood map
What this means for you Summary
Snapshot
- This is a 2-bed/1.0-bath multifamily listed at $405k.
Deal economics
- At list price, monthly cash flow is $7k ($90k/yr) — positive.
- The deal already cash-flows at list — no discount required.
- Meets the 1% rule at list price ($13k rent vs $405k).
- Cap rate 28.4% vs local median 2.1% in Los Angeles — top-decile yield for the area; either an underpriced asset or a hidden risk that comps aren't pricing in. Stress-test before assuming the spread holds.
Location & tenants
- Location reads 68/100 on livability (#273 in CA) — a middle-class / working-renter tenant base. Strengths: amenities A+, commute A+, employment B; Watch: health & safety C-, schools D+, crime F.
- Los Angeles Unified (urban): math 29% / reading 54% proficiency, ranked #223 of 517 in CA (top 43%) — families likely to look elsewhere, expect single-tenant / working-renter base with shorter leases; 67% free/reduced lunch — lower-income household profile, screen leases tightly.
- Market conditions: Rents falling (-3.8%/yr); 135 active listings in the ZIP; 40 comparable units currently listed for rent nearby; rentals at typical pace (median 20d on market — plan ~3-4 weeks tenant-placement turnaround); solid renter incomes; 19,697 units permitted in Los Angeles County in 2024 (9,426 in 5+ unit buildings).
- At $12,986/mo this rent would consume 145% of the median local household income ($107k/yr) (locally 1611% of renters already pay >50% of income on rent) — very limited rent-growth headroom before tenants either downsize or default.
Forward outlook
- Local home prices are declining (-3.0%/yr); year-one equity from $3k of loan paydown is wiped out by about $12k of value loss. Plan a longer hold.
- Los Angeles County population projected at +9% by 2050 — modest demand growth; plan on rents tracking national, not racing it.
- At projected returns (-3.0% appreciation + 0.0% rent growth), your $113k cash investment doubles in ~2 years — after that, you're playing with house money.
Negotiation context
- Only 14 days on market — expect competitive offers; lowballing is unlikely to land.
- 11 sale attempts since 20y ago with the ask held roughly flat each time — persistent listings suggest the price (not the market) is what's stuck; bring a comps-based counter.
Risks & watch-outs
- Climate carrying-cost: moderate flood risk; extreme-heat days projected 8→22/yr by 2055 (HVAC capex compounding) — expect insurance premiums to compound above CPI over the hold.
Questions for the listing agent
- Built in 1972 — when were the roof, HVAC, electrical panel, plumbing, and water heater last replaced?
- Is there a deadline driving the sale (1031 exchange, divorce, estate, relocation)? That informs how much negotiation room exists.
- Schools are D-rated, which usually means shorter tenancies and higher turnover. Who's the typical renter profile here, and what's been the actual vacancy rate?
- Crime grade is F in this area — have there been break-ins, vandalism, or insurance claims at this property in the last 3 years? What carrier currently insures it and at what premium?
- What's the average days-on-market for RENTAL listings here right now (not sales)? A rising rental-DOM trend means longer vacancies and softer asking-rent achievability than the comps imply.
- What's the recent tenant-quality profile in this submarket — average credit score on applications, eviction rate, late-payment / NSF rate, and stable-employment percentage? A property-management company in the area should have these aggregated.
- How much new apartment / multifamily construction is in the pipeline within 1–3 miles? Heavy new supply (>2% of stock underway) typically softens rents 12–24 months out; light construction supports rent growth.
Investment metrics
- 1% rule
- 3.21% ✓
- Cap rate
- 28.40%
- Cash-on-cash
- 78.94%
- DSCR
- 4.51
- GRM
- 2.6
CMA / ARV
No comps found within radius.
Projected returns pro-forma
-3.0% appreciation · 0.0% rent growth · sell at horizon
- IRR
- 75.6%
- Equity multiple
- 4.28×
- Total profit
- $371,648
- Equity at exit
- $60,387
- IRR
- 78.5%
- Equity multiple
- 7.96×
- Total profit
- $789,159
- Equity at exit
- $35,017
Cash invested: $113,400 (down + closing). Projections, not guarantees.
Landlord ↔ Tenant lean methodology
- Overall (CITY)
- 0 Strongly Tenant-Friendly
- State California
- 18 Strongly Tenant-Friendly · D+13
- County
- — inherits STATE
- City Los Angeles
- 0 Strongly Tenant-Friendly · D+22
ZIP-level market 91356
- Rents YoY
- -3.8%
- Active inventory
- 135
- Price-to-rent
- 13.0×
Monthly cashflow live
- Estimated rent
- $12,986 high interval (Pro) →
- Mortgage (P&I)
- −$2,124
- Tax est. 1.5%
- −$506 /mo · $6,075/yr
- Insurance
- −$169
- HOA
- −$0
- Vacancy / Maint / Mgmt
- −$2,727
- Net cashflow
- $7,460
Break-even live
5-unit breakdown (identical units grouped — click to expand)
| Units | Beds | Baths | Est. rent |
|---|---|---|---|
| 5× units | 2 | 1 | $12,985 |
| #1 | 2 | 1 | $2,597 |
| #2 | 2 | 1 | $2,597 |
| #3 | 2 | 1 | $2,597 |
| #4 | 2 | 1 | $2,597 |
| #5 | 2 | 1 | $2,597 |
| Total (5 units) | $12,986 | ||
UW: 25.0% down · 7.5% · 30yr · 1.5% tax · 5.0% vac · 8.0% maint · 8.0% mgmt
Financing live
Cash to close
- Down payment
- $101,250
- Closing costs
- $12,150
- Reserves months
- —
- Total cash needed
- —
Loan-product check · same deal, 3 products live
Conventional
25% down · 7.5% · 30yr
- Down + closing
- —
- Monthly P&I
- —
- Monthly cashflow
- —
- DSCR
- —
- Eligible?
- —
Personal DTI + credit; lowest rate.
DSCR
20% down · 8.5% · 30yr
- Down + closing
- —
- Monthly P&I
- —
- Monthly cashflow
- —
- DSCR
- —
- Eligible?
- —
No personal income docs; deal must DSCR.
Hard money
10% down · 12.0% · 12mo
- Down + closing
- —
- Monthly P&I
- —
- Monthly cashflow
- —
- DSCR
- —
- Eligible?
- —
Short-term bridge; refi at stabilization.
Rent comps 40 comps
| Address | Beds | Baths | Sqft | Rent | $/sqft | DOM | Units | Dist |
|---|---|---|---|---|---|---|---|---|
| 18350 Hatteras St Tarzana, CA | 2.0–3.0 | 2.0 | 1070 | $2,798 | $2.61 | 24d | 2 | 0.03mi |
| 18350 Hatteras St #202 Tarzana, CA | 3.0 | 2.0 | 1070 | $3,100 | $2.90 | 7d | 1 | 0.04mi |
| 5700 Etiwanda Ave Tarzana, CA | 2.0–3.0 | 1.0–2.0 | 975 | $2,600 | $2.67 | 18d | 4 | 0.15mi |
| 5700 Etiwanda Ave Tarzana, CA | 2.0–3.0 | 1.0–2.0 | 975 | $2,495 | $2.56 | 24d | 5 | 0.15mi |
| 5700 Etiwanda Ave Tarzana, CA | 2.0–3.0 | 1.0–2.0 | 975 | $2,495 | $2.56 | 18d | 4 | 0.15mi |
| 6000 Etiwanda Ave Tarzana, CA | 2.0 | 1.0–2.0 | 957 | $2,695 | $2.81 | 43d | 2 | 0.16mi |
| 18433 Hatteras St #207 Tarzana, CA | 1.0 | 1.0 | 742 | $2,180 | $2.94 | 43d | 1 | 0.19mi |
| 18400 Collins St Tarzana, CA | 1.0 | 1.0 | 700 | $1,725 | $2.46 | 15d | 1 | 0.21mi |
| 5830 Reseda Blvd Tarzana, CA | 1.0 | 1.0 | 800 | $2,150 | $2.69 | 5d | 3 | 0.21mi |
| 5900 Reseda Blvd Tarzana, CA | 1.0 | 1.0 | 680 | $2,600 | $3.82 | 43d | 1 | 0.22mi |
| 5917 Reseda Blvd Tarzana, CA | 2.0–3.0 | 1.5–2.0 | 1105 | $2,450 | $2.22 | 2d | 3 | 0.25mi |
| 5825 Reseda Blvd Tarzana, CA | 1.0 | 1.0 | 770 | $2,063 | $2.68 | 7d | 7 | 0.26mi |
| 5680 Reseda Blvd Tarzana, CA | 1.0–2.0 | 1.0 | 696 | $2,565 | $3.69 | 3d | 3 | 0.26mi |
| 5809 Reseda Blvd Tarzana, CA | 1.0 | 1.0 | 600 | $1,662 | $2.77 | 20d | 5 | 0.28mi |
| 5931 Reseda Blvd Tarzana, CA | 2.0 | 1.0–2.0 | 750 | $2,338 | $3.12 | 19d | 8 | 0.28mi |
| 5931 Reseda Blvd Tarzana, CA | 1.0 | 1.0 | 750 | $1,916 | $2.55 | 11d | 2 | 0.28mi |
| 18530 Hatteras St Tarzana, CA | 1.0–3.0 | 1.0–2.0 | 955 | $2,600 | $2.72 | 2d | 5 | 0.29mi |
| 18530 Hatteras St Tarzana, CA | 1.0–3.0 | 1.0–2.0 | 1006 | $2,548 | $2.53 | 7d | 6 | 0.29mi |
| 18530 Hatteras St Tarzana, CA | 1.0–3.0 | 1.0–2.0 | 1006 | $2,725 | $2.71 | 22d | 5 | 0.29mi |
| 18530 Hatteras St Tarzana, CA | 1.0–2.0 | 1.0–2.0 | 765 | $2,750 | $3.59 | 43d | 6 | 0.29mi |
| 18136 Oxnard St #39 Tarzana, CA | 2.0 | 2.0 | 1121 | $3,395 | $3.03 | 24d | 1 | 0.33mi |
| 18555 Collins St Tarzana, CA | 2.0 | 2.0 | 972 | $2,450 | $2.52 | 24d | 3 | 0.36mi |
| 18601 Hatteras St Tarzana, CA | 2.0 | 2.0 | 940 | $2,622 | $2.79 | 3d | 3 | 0.37mi |
| 6130 Reseda Blvd Tarzana, CA | 1.0 | 1.0 | 893 | $1,925 | $2.16 | 43d | 1 | 0.38mi |
| 18620 Hatteras St Tarzana, CA | 1.0–2.0 | 1.0–2.0 | 795 | $2,700 | $3.40 | 2d | 3 | 0.40mi |
| 18620 Hatteras St Tarzana, CA | 1.0–3.0 | 1.5–2.0 | 915 | $2,625 | $2.87 | 43d | 3 | 0.40mi |
| 6150 Reseda Blvd Tarzana, CA | 1.0 | 1.0 | 785 | $1,895 | $2.41 | 12d | 1 | 0.40mi |
| 6155 Reseda Blvd Tarzana, CA | 2.0 | 2.0 | 833 | $2,400 | $2.88 | 24d | 1 | 0.44mi |
| 18618 Collins St Tarzana, CA | 1.0 | 1.0 | 452 | $1,650 | $3.65 | 43d | 2 | 0.44mi |
| 18645 Hatteras St Tarzana, CA | 1.0 | 1.0 | 605 | $2,200 | $3.64 | 20d | 1 | 0.45mi |
| 18645 Hatteras St #206 Tarzana, CA | 1.0 | 1.0 | 605 | $2,200 | $3.64 | 12d | 1 | 0.46mi |
| 18529 Calvert St Tarzana, CA | 1.0 | 1.0 | 785 | $2,175 | $2.77 | 24d | 1 | 0.46mi |
| 6266 Etiwanda Ave Unit 18254 Tarzana, CA | 2.0 | 2.0 | 825 | $2,950 | $3.58 | 11d | 1 | 0.46mi |
| 5536 Lindley Ave Encino, CA | 1.0–2.0 | 1.0–2.0 | 1143 | $2,913 | $2.55 | 2d | 7 | 0.47mi |
| 18632 Collins St Tarzana, CA | 1.0 | 1.0 | 508 | $2,125 | $4.18 | 13d | 3 | 0.47mi |
| 6210 Reseda Blvd Tarzana, CA | 1.0 | 1.0 | 849 | $2,195 | $2.59 | 12d | 1 | 0.47mi |
| 5730 Yolanda Ave Tarzana, CA | 1.0 | 1.0 | 650 | $1,995 | $3.07 | 43d | 1 | 0.49mi |
| 6230 Reseda Blvd Tarzana, CA | 1.0 | 1.0 | 817 | $1,852 | $2.27 | 3d | 5 | 0.49mi |
| 18657 Collins St Unit 12A Tarzana, CA | 2.0 | 1.0 | 950 | $2,295 | $2.42 | 22d | 1 | 0.50mi |
| 18657 Collins St Unit 04 Tarzana, CA | 1.0 | 1.0 | 700 | $1,850 | $2.64 | 24d | 1 | 0.51mi |
Listing history 9 events
-
2026-06-18days on market $405,000 Active 14 DOM
-
2026-06-17days on market $405,000 Active 13 DOM
-
2026-06-16days on market $405,000 Active 12 DOM
-
2026-06-15days on market $405,000 Active 11 DOM
-
2026-06-13days on market $405,000 Active 9 DOM
-
2026-06-09days on market $405,000 Active 5 DOM
-
2026-06-08days on market $405,000 Active 4 DOM
-
2026-06-07remarks 102-char remark
-
2026-06-07$405,000 Active 3 DOM
ⓘ Source: listings_history table (triggers on properties + properties_extension) + one-shot
backfill from property_details.listing_events for pre-trigger history.
Climate risk First Street
- Flood 5/10 Major FEMA zone X (unshaded) · 24% chance over 30 yrs
- Wildfire 1/10 Low
- Heat 5/10 Major 8 d/yr ≥101°F today · 22 d/yr by 30 yrs out
- Wind 1/10 Low
- Air quality 5/10 Major 7 unhealthy d/yr today · 8 by 30 yrs out
Nearby sold comps map
Loading sold comps map…
Walkable amenities ~0.75 mi
Loading nearby amenities…
Taxation est. · year 1
- Rental income
- $155,832
- − Mortgage interest
- −$22,686
- − Property taxes
- −$6,075
- − Insurance
- −$2,025
- − Repairs & maintenance
- −$12,467
- − Management
- −$12,467
- − Depreciation
- −$11,782
- Taxable income
- $88,331
- Est. tax owed @ 24.0%
- −$21,199
- After-tax cash flow
- $68,322/yr
For passive investors: Depreciation is non-cash, so a rental often shows a tax loss while cash-flowing — sheltering income. Rental losses are passive: they offset passive income freely, and up to $25,000/yr can offset ordinary (W-2) income if you actively participate and your MAGI is under $100k (phasing out to $0 by $150k); unused losses carry forward. On sale, claimed depreciation is recaptured at up to 25%, and gains may owe capital-gains tax (a 1031 exchange can defer both). Figures are a year-1 estimate at your 24.0% rate — not tax advice; consult a CPA.
Schools (NCES district)
- District
- Los Angeles Unified
- NCES district ID
- 0622710
- Math proficiency
- 29% ▼ -4.00%
- Reading proficiency
- 54% ▲ 10.00%
- Median HH income
- $50,403
- Composite
- 35.67/100
- National rank
- #4875
- State rank
- #223 of 517 in CA
Livability — Los Angeles
- Score
- 68/100
- State rank
- #273
- US rank
- #9237
Category grades
Schools grade is shown separately in the Schools card above.
Census & demographics
- Census place
- Los Angeles, CA
- County
- Los Angeles County · 9,444,647 people
- City population
- 3,838,149
- Metro
- Los Angeles-Long Beach-Anaheim, CA
- Population (ZIP)
- 30,942
- Household income
- $107,378
- Rent vs Own
- Severe rent burden
- 1611.0
Population outlook (Los Angeles County) Hauer SSP2
- Today (2025)
- 10,940,515 people
- By 2030
- 11,256,481 · +2.9%
- By 2040
- 11,729,929 · +7.2%
- By 2050
- 11,948,407 · +9.2%
- By 2075
- 11,818,114 · +8.0%
- By 2100
- 10,842,928 · -0.9%
Race, ethnicity, and origin ACS 2023
- Neighborhood character
- Diverse neighborhood (Simpson 0.57)
- Race & ethnicity
- White 63% Hispanic / Latino 17% Two or more races 12% Asian 8% Black 6%
- Hispanic origin (detail)
- Mexican 7% Puerto Rican 1%
- Common ancestry
- Scotch-Irish 6% Romanian 4% Italian 2%
- Foreign-born
- 32% · Canada, China, South Korea
- Languages at home
- 58% English-only · Other Indo-European 13% Spanish 13% Russian/Polish/Slavic 5%
Political lean MEDSL · Los Angeles
- 2024 margin
- Solid D (+32.9) · D 64.8% · R 31.9% · Other 3.3%
- 2008→2024 swing
- -7.4pp toward R · 2008: 40.4pp · 2024: 32.9pp
- All cycles
- 2024: D+32.9 2020: D+44.2 2016: D+48.0 2012: D+40.0 2008: D+40.4
Not yet ingested
- Civics
- —
Market trends
- HPI YoY
- ▼ -930.94%
- Current HPI
- 429.7005
- Rent YoY
- ▼ -3.82%
- Metro
- Los Angeles-Long Beach-Anaheim, CA
- State GDP YoY
- ▲ 3.21%
- F500 in state
- 116
Industry mix (Fortune 500 HQ in CA)
| Industry | F500 HQs | Revenue |
|---|---|---|
| Technology | 27 | $1,492B |
|
||
| Financial Services | 3 | $174B |
|
||
| Retail | 3 | $44B |
|
||
| Insurance | 3 | $26B |
|
||
| Media / Entertainment | 2 | $115B |
|
||
| Pharmaceuticals / Biotech | 2 | $62B |
|
||
Price history
-3.3% since first listed23 events — show timeline
- 2026-06-05 Listed $405,000 FSBO.com
- 2026-03-29 Rental Removed $2,750 TURBOTENANT
- 2026-02-28 Listed for Rent $2,750 TURBOTENANT
- 2026-02-27 Rental Removed $2,500 CRMLS
- 2026-02-10 Price Changed $2,500 CRMLS
- 2026-01-24 Listed for Rent $2,750 CRMLS
- 2025-06-19 Rental Removed $2,400 SHOWMOJO
- 2025-05-05 Listed for Rent $2,400 SHOWMOJO
- 2025-05-05 Rental Removed $2,400 SHOWMOJO2
- 2025-05-01 Rental Removed $2,400 SHOWMOJO
- 2025-05-01 Listed for Rent $2,400 SHOWMOJO2
- 2025-04-26 Listed for Rent $2,400 SHOWMOJO
- 2025-03-12 Listing Removed — CRMLS
- 2025-01-15 Rental Removed $3,000 CLAW
- 2024-10-01 Listed $430,000 CRMLS
- 2024-09-18 Listed for Rent $3,000 CLAW
- 2024-08-16 Rental Removed $2,995 APPFOLIO
- 2024-08-06 Listed for Rent $2,995 APPFOLIO
- 2022-07-17 Price Changed $2,700 RENT.
- 2008-03-31 Listing Removed — CRMLS
- 2008-03-27 Listed $267,900 CRMLS
- 2006-12-19 Listing Removed — CRMLS
- 2006-11-06 Listed $419,000 CRMLS
Cash-flow waterfall
monthlySold comps — $/sqft
last 12 mo · ≤1 miLoading sold comps…