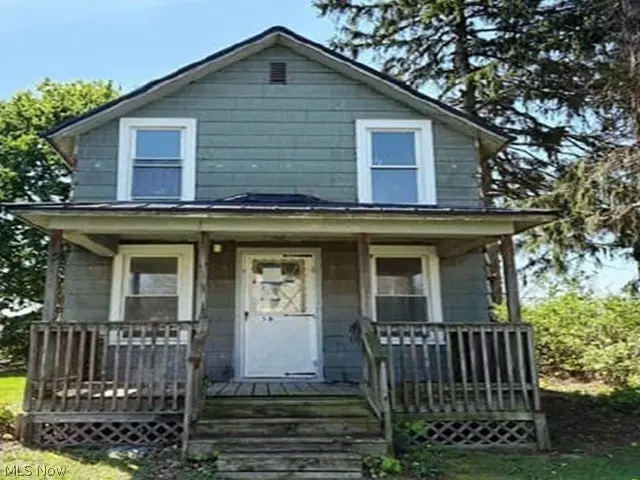
58 Auburn Ave · Shelby, OH
Flood risk 1/10 · Minimal
- FEMA flood zone
- X (unshaded)
- Chance of flooding over 30 yrs
- 0.0%
- Est. flood insurance / yr
- $473 – $860
Fire risk 1/10 · Minimal
- Est. fire insurance / yr
- $713 – $1,323
Heat risk 3/10 · Minor
- Hot days now (above 98°F)
- 7 days/yr
- Hot days in 30 yrs
- 17 days/yr
Wind risk 2/10 · Minimal
- Chance of severe wind over 30 yrs
- —
Air-quality risk 2/10 · Minimal
- Unhealthy air days now
- 1 days/yr
- Unhealthy air days in 30 yrs
- 2 days/yr
Risk factors via First Street. Map © Google.
Why this score? — see what drove the B grade
The composite is a weighted blend of 9 inputs, each scored 0–100. Each bar is that input's sub-score; the figure is the points it added to the 100-point composite (weight × sub-score).
- Cash flow +30.0/30.0
- 1% rule +10.0/10.0
- DSCR +10.0/10.0
- ARV discount +7.5/15.0
- Schools +5.2/10.0
- Livability +3.7/5.0
- Rent growth +2.5/5.0
- Condition / age +2.5/5.0
- Appreciation +0.0/10.0
$41,800
🖨 Deal sheet 📄 Offer letter ✓ Due diligence
Listing remarks
Great opportunity to buy this two story fixer upper located in Shelby, OH and sitting on a . 174 acre lot (50x152). The interior has 896 sq. ft. with 2 bedrooms and 1 bathroom plus a full basement.
Key facts
- 7,601 sq ft lot
- Built 1925
- Listed 49 days
Property features AI
Exterior
- Utilities: Public water; Public sewer
- Home design: 2-story house; Metal roof
- Construction: Built (year source: appraiser); Asbestos exterior material
- Exterior features: Lot approximately 0.1745 acre
Interior
- Bedrooms: 2 main-level bedrooms
- Bathrooms: 1 full bathroom on the main level
- Heating & cooling: Forced-air heating (gas)
- Interior features: Full unfinished basement
Neighborhood map
What this means for you Summary
Snapshot
- This is a 2-bed/1.0-bath single-family listed at $42k.
Deal economics
- At list price, monthly cash flow is $346 ($4k/yr) — positive.
- The deal already cash-flows at list — no discount required.
- Meets the 1% rule at list price ($795 rent vs $42k).
- Recommended offer: $41k (3.0% below list) — sets the bar for market timing.
- Cap rate 16.2% vs local median 4.7% in Shelby — top-decile yield for the area; either an underpriced asset or a hidden risk that comps aren't pricing in. Stress-test before assuming the spread holds.
Location & tenants
- Location reads 74/100 on livability (#301 in OH, #4,837 nationally) — a middle-class / working-renter tenant base. Strengths: cost of living A+, housing A+, schools B+; Watch: commute D+, employment D, amenities F.
- Shelby City (town): math 62% / reading 62% proficiency, ranked #269 of 656 in OH (top 41%) — acceptable for families but not a draw, mixed tenant base, ~2y average lease.
- Market conditions: 58 active listings in the ZIP; 1 comparable units currently listed for rent nearby; 145 units permitted in Richland County in 2024 (0 in 5+ unit buildings).
- This rent is only 16% of the median local income ($61k/yr) — well below the 30% rent-burden line; pricing power to push rent on renewal without tenant pushback.
Forward outlook
- Local home prices are declining (-3.0%/yr); year-one equity from $289 of loan paydown is wiped out by about $1k of value loss. Plan a longer hold.
- Richland County population projected at -18% by 2050 — secular population decline; favor cash flow + early exit over multi-decade hold.
- At projected returns (-3.0% appreciation + 3.0% rent growth), your $12k cash investment doubles in ~4 years — after that, you're playing with house money.
Negotiation context
- It's been on market 50 days — a 3% lower offer ($41k) is reasonable based on typical stale-listing flexibility.
- Current owner paid $25k; list at $42k implies a 67% gain — meaningful room to come down on a strong offer.
Risks & watch-outs
- Watch-outs: built in 1925 — expect roof / HVAC / electrical / plumbing capex.
Questions for the listing agent
- It's been on market 50 days. Have you received any prior offers? Is the seller open to a 3% concession, seller financing, or rate buy-down credit?
- Built in 1925 — when were the roof, HVAC, electrical panel, plumbing, and water heater last replaced?
- Is there a deadline driving the sale (1031 exchange, divorce, estate, relocation)? That informs how much negotiation room exists.
- Schools are B-rated — typically a magnet for longer-tenancy family renters. What's the average tenant stay here, and is there a school-zone premium baked into asking?
- What's the average days-on-market for RENTAL listings here right now (not sales)? A rising rental-DOM trend means longer vacancies and softer asking-rent achievability than the comps imply.
- What's the recent tenant-quality profile in this submarket — average credit score on applications, eviction rate, late-payment / NSF rate, and stable-employment percentage? A property-management company in the area should have these aggregated.
- How much new for-sale + rental construction is in the pipeline within 1–3 miles? Heavy new supply typically softens prices + rents 12–24 months out; constrained supply supports both.
Investment metrics
- 1% rule
- 1.90% ✓
- Cap rate
- 16.22%
- Cash-on-cash
- 35.47%
- DSCR
- 2.58
- GRM
- 4.4
CMA / ARV
- ARV (median comp)
- $124,000
- List price
- $41,800
- Delta
- -66.29%
- Verdict
- UNDERPRICED
- Comps
- 20 within 1.0 mi
Show comp detail 10 sales within ~0.75 mi
| Address | Dist | Beds/Ba | Sqft | Sold | Price | $/sf | Match |
|---|---|---|---|---|---|---|---|
| 67 W Smiley Ave | 0.27mi | 2/1.0 | 900 (+0%) | 4mo | $125,000 | $139 | 83 |
| 62 Raymond Ave | 0.11mi | 3/1.5 (+1) | 840 (-6%) | 7mo | $170,000 | $202 | 72 |
| 22 W Park Dr | 0.40mi | 2/1.0 | 840 (-6%) | 0mo | $130,000 | $155 | 70 |
| 38 Auburn Ave | 0.11mi | 3/1.0 (+1) | 907 (+1%) | 21mo | $40,000 | $44 | 70 |
| 176 W Park Dr | 0.44mi | 3/1.0 (+1) | 920 (+3%) | 21mo | $115,000 | $125 | 53 |
| 62 Shelby Ave | 0.51mi | 2/1.0 | 990 (+10%) | 8mo | $150,000 | $152 | 52 |
| 70 W Park Dr | 0.53mi | 2/1.0 | 1,020 (+14%) | 6mo | $128,000 | $125 | 47 |
| 30 Taft St | 0.70mi | 2/1.0 | 1,008 (+12%) | 1mo | $171,000 | $170 | 45 |
| 16 Steele Ave | 0.38mi | 2/2.0 | 984 (+10%) | 23mo | $135,000 | $137 | 42 |
| 31 W End Blvd | 0.63mi | 3/1.5 (+1) | 998 (+11%) | 7mo | $159,900 | $160 | 38 |
Match score weights: distance 35% · size 25% · config 20% · recency 20%. Top-matched comps best support the ARV.
Projected returns pro-forma
-3.0% appreciation · 3.0% rent growth · sell at horizon
- IRR
- 31.1%
- Equity multiple
- 2.30×
- Total profit
- $15,268
- Equity at exit
- $6,233
- IRR
- 38.3%
- Equity multiple
- 4.56×
- Total profit
- $41,698
- Equity at exit
- $3,614
Cash invested: $11,704 (down + closing). Projections, not guarantees.
Landlord ↔ Tenant lean methodology
- Overall (STATE)
- 73 Landlord-Friendly
- State Ohio
- 73 Landlord-Friendly · R+6
- County
- — inherits STATE
- City
- — inherits STATE
ZIP-level market 44875
- Home prices YoY
- -26.2%
- Active inventory
- 58
- Price-to-rent
- 4.4×
Monthly cashflow live
- Estimated rent
- $795 medium interval (Pro) →
- Mortgage (P&I)
- −$219
- Tax from tax record
- −$45 /mo · $545/yr
- Insurance
- −$17
- HOA
- −$0
- Vacancy / Maint / Mgmt
- −$167
- Net cashflow
- $346
Break-even live
UW: 25.0% down · 7.5% · 30yr · 1.5% tax · 5.0% vac · 8.0% maint · 8.0% mgmt
Financing live
Cash to close
- Down payment
- $10,450
- Closing costs
- $1,254
- Reserves months
- —
- Total cash needed
- —
Loan-product check · same deal, 3 products live
Conventional
25% down · 7.5% · 30yr
- Down + closing
- —
- Monthly P&I
- —
- Monthly cashflow
- —
- DSCR
- —
- Eligible?
- —
Personal DTI + credit; lowest rate.
DSCR
20% down · 8.5% · 30yr
- Down + closing
- —
- Monthly P&I
- —
- Monthly cashflow
- —
- DSCR
- —
- Eligible?
- —
No personal income docs; deal must DSCR.
Hard money
10% down · 12.0% · 12mo
- Down + closing
- —
- Monthly P&I
- —
- Monthly cashflow
- —
- DSCR
- —
- Eligible?
- —
Short-term bridge; refi at stabilization.
Rent comps 1 comps
| Address | Beds | Baths | Sqft | Rent | $/sqft | DOM | Units | Dist |
|---|---|---|---|---|---|---|---|---|
| 116 1/2 2nd St Unit 62 UP Shelby, OH | 1.0 | 1.0 | 652 | $695 | $1.07 | 44d | 1 | 0.89mi |
Listing history 18 events
-
2026-06-19days on market $41,800 Active 50 DOM
-
2026-06-18days on market $41,800 Active 49 DOM
-
2026-06-17days on market $41,800 Active 48 DOM
-
2026-06-16days on market $41,800 Active 47 DOM
-
2026-06-15days on market $41,800 Active 46 DOM
-
2026-06-14days on market $41,800 Active 44 DOM
-
2026-06-12days on market $41,800 Active 43 DOM
-
2026-06-09days on market $41,800 Active 40 DOM
-
2026-06-08days on market $41,800 Active 39 DOM
-
2026-06-07pricedays on market $41,800 Active 38 DOM
-
2026-06-03days on market $49,600 Active 34 DOM
-
2026-06-02days on market $49,600 Active 33 DOM
-
2026-06-01days on market $49,600 Active 32 DOM
-
2026-05-31days on market $49,600 Active 31 DOM
-
2026-05-30days on market $49,600 Active 30 DOM
-
2026-05-18price $49,600 197-char remark
-
2026-04-30$49,900 Active 197-char remark
-
1995-05-26soldstatus $25,000
ⓘ Source: listings_history table (triggers on properties + properties_extension) + one-shot
backfill from property_details.listing_events for pre-trigger history.
Tax reassessment forecast OH · Partial reset (capped growth)
- Current annual tax
- $545 · $45/mo
- Projected year-2 tax
- $599 · $50/mo
- Expected delta
- +$53/yr (+$4/mo · 9.8%)
ⓘ Screening estimate from a state-policy table — verify with the county assessor before closing.
Climate risk First Street
- Flood 1/10 Low FEMA zone X (unshaded) · 0% chance over 30 yrs
- Wildfire 1/10 Low
- Heat 3/10 Moderate 7 d/yr ≥98°F today · 17 d/yr by 30 yrs out
- Wind 2/10 Low
- Air quality 2/10 Low 1 unhealthy d/yr today · 2 by 30 yrs out
Nearby sold comps map
Loading sold comps map…
Walkable amenities ~0.75 mi
Loading nearby amenities…
Taxation est. · year 1
- Rental income
- $9,539
- − Mortgage interest
- −$2,341
- − Property taxes
- −$545
- − Insurance
- −$209
- − Repairs & maintenance
- −$763
- − Management
- −$763
- − Depreciation
- −$1,216
- Taxable income
- $3,701
- Est. tax owed @ 24.0%
- −$888
- After-tax cash flow
- $3,263/yr
For passive investors: Depreciation is non-cash, so a rental often shows a tax loss while cash-flowing — sheltering income. Rental losses are passive: they offset passive income freely, and up to $25,000/yr can offset ordinary (W-2) income if you actively participate and your MAGI is under $100k (phasing out to $0 by $150k); unused losses carry forward. On sale, claimed depreciation is recaptured at up to 25%, and gains may owe capital-gains tax (a 1031 exchange can defer both). Figures are a year-1 estimate at your 24.0% rate — not tax advice; consult a CPA.
Schools (NCES district)
- District
- Shelby City
- NCES district ID
- 3910009
- Math proficiency
- 62% ▼ -12.00%
- Reading proficiency
- 62% ▼ -8.00%
- Median HH income
- $44,197
- Composite
- 52.19/100
- National rank
- #1609
- State rank
- #269 of 656 in OH
Livability — Shelby
- Score
- 74/100
- State rank
- #301
- US rank
- #4837
Category grades
Schools grade is shown separately in the Schools card above.
Census & demographics
- Census place
- Shelby, OH
- County
- Richland County · 43,943 people
- City population
- 14,144
- Metro
- Mansfield, OH
- Population (ZIP)
- 14,144
- Household income
- $61,276
- Rent vs Own
- Severe rent burden
- 284.0
Population outlook (Richland County) Hauer SSP2
- Today (2025)
- 115,577 people
- By 2030
- 111,669 · -3.4%
- By 2040
- 103,323 · -10.6%
- By 2050
- 95,135 · -17.7%
- By 2075
- 76,719 · -33.6%
- By 2100
- 57,188 · -50.5%
Race, ethnicity, and origin ACS 2023
- Neighborhood character
- Predominantly White (95%)
- Race & ethnicity
- White 95% Hispanic / Latino 2% Two or more races 2% Asian 1%
- Common ancestry
- Lithuanian 2% Romanian 2% Slovak 1%
- Foreign-born
- 1% · Canada
- Languages at home
- 97% English-only · Spanish 2% German/W. Germanic 1%
Political lean MEDSL · Richland
- 2024 margin
- Solid R (+42.3) · D 28.4% · R 70.8%
- 2008→2024 swing
- -28.8pp toward R · 2008: -13.6pp · 2024: -42.3pp
- All cycles
- 2024: R+42.3 2020: R+39.7 2016: R+37.5 2012: R+20.1 2008: R+13.6
Not yet ingested
- Civics
- —
Market trends
- HPI YoY
- ▼ -78.08%
- Current HPI
- 220.0577
- Rent YoY
- —
- Metro
- Mansfield, OH
- State GDP YoY
- ▲ 1.98%
- F500 in state
- 48
Industry mix (Fortune 500 HQ in OH)
| Industry | F500 HQs | Revenue |
|---|---|---|
| Insurance | 3 | $145B |
|
||
| Industrial Machinery | 3 | $49B |
|
||
| Financial Services | 3 | $24B |
|
||
| Consumer Goods | 2 | $93B |
|
||
| Aerospace / Defense | 2 | $47B |
|
||
| Utilities | 2 | $33B |
|
||
Price history
+67.2% since first listed4 events — show timeline
- 2026-06-03 Price Changed $41,800 MLSNOW
- 2026-05-18 Price Changed $49,600 MLSNOW
- 2026-04-30 Listed $49,900 MLSNOW
- 1995-05-26 Sold (Public Records) $25,000 Public Records
Property tax history
+0.1%/yrLatest (2025): $545 · -2.5% YoY. Source: county tax records.
Cash-flow waterfall
monthlySold comps — $/sqft
last 12 mo · ≤1 miLoading sold comps…