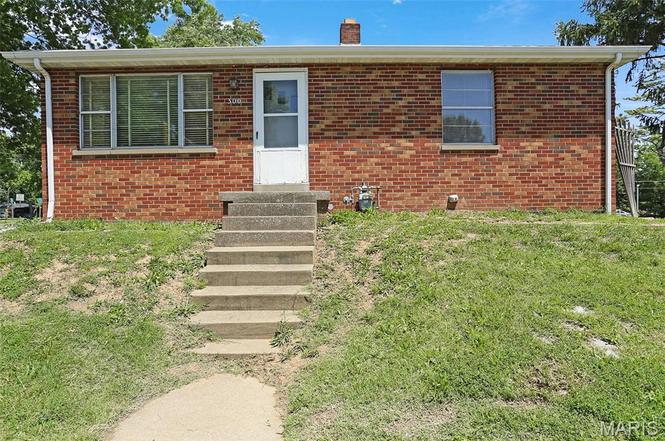
300 N Belt E · Swansea, IL
Flood risk 1/10 · Minimal
- FEMA flood zone
- X
- Chance of flooding over 30 yrs
- 0.0%
- Est. flood insurance / yr
- $473 – $860
Fire risk 1/10 · Minimal
- Est. fire insurance / yr
- $804 – $1,492
Heat risk 5/10 · Moderate
- Hot days now (above 107°F)
- 7 days/yr
- Hot days in 30 yrs
- 21 days/yr
Wind risk 2/10 · Minimal
- Chance of severe wind over 30 yrs
- 1.0%
Air-quality risk 4/10 · Minor
- Unhealthy air days now
- 3 days/yr
- Unhealthy air days in 30 yrs
- 6 days/yr
Risk factors via First Street. Map © Google.
Why this score? — see what drove the C- grade
The composite is a weighted blend of 9 inputs, each scored 0–100. Each bar is that input's sub-score; the figure is the points it added to the 100-point composite (weight × sub-score).
- Cash flow +21.1/30.0
- 1% rule +7.1/10.0
- DSCR +6.7/10.0
- ARV discount +5.0/15.0
- Livability +4.0/5.0
- Rent growth +3.6/5.0
- Condition / age +2.5/5.0
- Schools +2.2/10.0
- Appreciation +0.0/10.0
$105,000
🖨 Deal sheet 📄 Offer letter ✓ Due diligence
Listing remarks
Brick two bedroom, 1.. 5 bath property situated on a large lot. Features include full walk up basement, easy bike trail access, gravel parking lot, rear entrance and new roof in 2025. This property offers flexibility for rental, office space, residential or future redevelopment opportunities. Property is being sold AS IS and seller to make no repairs.
Key facts
- Rear entrance
- Gravel parking lot
- New roof
Tags
Property features AI
Finance
- Other: Property listed in fixer condition; Above-grade living area reported by assessor
- Financial info: Seller may consider concessions; Lease not considered
- HOA & community: Street lights in the community
Exterior
- Parking: Off-street parking and parking lot; additional parking available; no garage
- Utilities: Public water and public sewer; Electric service (other); Cable available; Electricity available; Natural gas available; Sewer available; Water available
- Home design: Single-family residence; One level
- Construction: Brick construction; Shingle roof; Block foundation; Built area reported by assessor
- Exterior features: Back yard; A few trees; Near public transit; City street frontage; Asphalt road surface; No fencing
Interior
- Kitchen: Main-level kitchen (18 x 14)
- Bedrooms: Two bedrooms on the main level (one 12 x 9, one 13 x 10)
- Flooring: Hardwood, carpet, vinyl, linoleum, and concrete flooring
- Bathrooms: One full bathroom on the main level; Additional full bathroom in the basement
- Heating & cooling: Forced air heating with natural gas; Central air conditioning and exhaust fan
- Interior features: Basement with full bathroom, storage space, unfinished areas, and walk-up access; Lighting included
- Laundry & utility: Laundry located in the basement
Neighborhood map
What this means for you Summary
Snapshot
- This is a 2-bed/3.0-bath single-family listed at $105k.
Deal economics
- At list price, monthly cash flow is $150 ($2k/yr) — positive.
- The deal already cash-flows at list — no discount required.
- Meets the 1% rule at list price ($1k rent vs $105k).
- Cap rate 8.0% vs local median 1.9% in Swansea — top-decile yield for the area; either an underpriced asset or a hidden risk that comps aren't pricing in. Stress-test before assuming the spread holds.
Location & tenants
- Location reads 80/100 on livability (#105 in IL, #1,705 nationally) — a professional / high-income tenant draw. Strengths: crime A+, commute A+, employment A+; Watch: health & safety C-, amenities F.
- Belleville Twp Hsd 201 (suburban): math 21% / reading 28% proficiency, ranked #308 of 620 in IL (top 50%) — low school quality limits family demand, transient renter base, plan for 1-2y turnover.
- Zoned schools: Belleville High School-West (math 19% / reading 26%, grade F, #317 of 693 statewide, top 46%, 2,234 students, 0% FRL).
- Market conditions: Rents rising fast (+4.6%/yr); 190 active listings in the ZIP; 10 comparable units currently listed for rent nearby; rentals leasing fast (median 13d on market — plan ~1-2 weeks tenant-placement turnaround); 783 units permitted in St. Clair County in 2024 (378 in 5+ unit buildings).
Forward outlook
- Local home prices are declining (-3.0%/yr); year-one equity from $726 of loan paydown is wiped out by about $3k of value loss. Plan a longer hold.
- St. Clair County population projected at -23% by 2050 — secular population decline; favor cash flow + early exit over multi-decade hold.
Negotiation context
- Only 3 days on market — expect competitive offers; lowballing is unlikely to land.
Risks & watch-outs
- Watch-outs: property tax is 3.0% of price; built in 1952 — expect roof / HVAC / electrical / plumbing capex.
- Climate carrying-cost: extreme-heat days projected 7→21/yr by 2055 (HVAC capex compounding) — expect insurance premiums to compound above CPI over the hold.
Questions for the listing agent
- Built in 1952 — when were the roof, HVAC, electrical panel, plumbing, and water heater last replaced?
- Property tax is high relative to price — has the assessment been appealed recently, and will the sale trigger a re-assessment?
- Is there a deadline driving the sale (1031 exchange, divorce, estate, relocation)? That informs how much negotiation room exists.
- What's the average days-on-market for RENTAL listings here right now (not sales)? A rising rental-DOM trend means longer vacancies and softer asking-rent achievability than the comps imply.
- What's the recent tenant-quality profile in this submarket — average credit score on applications, eviction rate, late-payment / NSF rate, and stable-employment percentage? A property-management company in the area should have these aggregated.
- How much new for-sale + rental construction is in the pipeline within 1–3 miles? Heavy new supply typically softens prices + rents 12–24 months out; constrained supply supports both.
Investment metrics
- 1% rule
- 1.21% ✓
- Cap rate
- 8.00%
- Cash-on-cash
- 6.11%
- DSCR
- 1.27
- GRM
- 6.9
CMA / ARV
- ARV (on-the-fly)
- $99,470
- Comps found
- 12
Show comp detail 12 sales within ~0.75 mi
| Address | Dist | Beds/Ba | Sqft | Sold | Price | $/sf | Match |
|---|---|---|---|---|---|---|---|
| 116 Bobbie Dr | 0.17mi | 3/2.0 (+1) | 988 (-3%) | 14mo | $175,000 | $177 | 67 |
| 1539 N Charles St | 0.61mi | 2/1.0 | 1,008 (-1%) | 12mo | $125,000 | $124 | 53 |
| 1419 Lebanon Ave | 0.62mi | 3/2.0 (+1) | 1,053 (+4%) | 6mo | $55,000 | $52 | 51 |
| 1636 N Charles St | 0.65mi | 2/1.0 | 1,056 (+4%) | 6mo | $100,000 | $95 | 50 |
| 1425 Lebanon Ave | 0.62mi | 2/1.0 | 1,036 (+2%) | 14mo | $135,000 | $130 | 48 |
| 1621 La Salle St | 0.68mi | 2/1.0 | 1,080 (+6%) | 3mo | $58,000 | $54 | 48 |
| 1649 N Church St | 0.58mi | 2/1.0 | 1,100 (+8%) | 6mo | $39,900 | $36 | 47 |
| 227 Parkway Dr | 0.38mi | 2/2.0 | 862 (-15%) | 9mo | $154,000 | $179 | 46 |
| 1800 N Church St | 0.66mi | 3/1.0 (+1) | 1,064 (+5%) | 12mo | $135,000 | $127 | 38 |
| 1815 N Church St | 0.68mi | 2/1.0 | 1,108 (+9%) | 12mo | $109,000 | $98 | 35 |
| 1210 N Church St | 0.62mi | 3/1.5 (+1) | 1,160 (+14%) | 2mo | $79,900 | $69 | 34 |
| 110 Brackett St | 0.71mi | 2/1.0 | 1,110 (+9%) | 19mo | $8,500 | $8 | 28 |
Match score weights: distance 35% · size 25% · config 20% · recency 20%. Top-matched comps best support the ARV.
Projected returns pro-forma
-3.0% appreciation · 4.56% rent growth · sell at horizon
- IRR
- -4.8%
- Equity multiple
- 0.82×
- Total profit
- $-5,353
- Equity at exit
- $15,656
- IRR
- 6.9%
- Equity multiple
- 1.56×
- Total profit
- $16,609
- Equity at exit
- $9,078
Cash invested: $29,400 (down + closing). Projections, not guarantees.
Landlord ↔ Tenant lean methodology
- Overall (STATE)
- 43 Moderately Tenant-Leaning
- State Illinois
- 43 Moderately Tenant-Leaning · D+7
- County
- — inherits STATE
- City
- — inherits STATE
ZIP-level market 62226
- Rents YoY
- 4.6%
- Active inventory
- 190
- Price-to-rent
- 6.9×
Monthly cashflow live
- Estimated rent
- $1,272 high interval (Pro) →
- Mortgage (P&I)
- −$551
- Tax from tax record
- −$261 /mo · $3,134/yr
- Insurance
- −$44
- HOA
- −$0
- Vacancy / Maint / Mgmt
- −$267
- Net cashflow
- $150
Break-even live
UW: 25.0% down · 7.5% · 30yr · 1.5% tax · 5.0% vac · 8.0% maint · 8.0% mgmt
Financing live
Cash to close
- Down payment
- $26,250
- Closing costs
- $3,150
- Reserves months
- —
- Total cash needed
- —
Loan-product check · same deal, 3 products live
Conventional
25% down · 7.5% · 30yr
- Down + closing
- —
- Monthly P&I
- —
- Monthly cashflow
- —
- DSCR
- —
- Eligible?
- —
Personal DTI + credit; lowest rate.
DSCR
20% down · 8.5% · 30yr
- Down + closing
- —
- Monthly P&I
- —
- Monthly cashflow
- —
- DSCR
- —
- Eligible?
- —
No personal income docs; deal must DSCR.
Hard money
10% down · 12.0% · 12mo
- Down + closing
- —
- Monthly P&I
- —
- Monthly cashflow
- —
- DSCR
- —
- Eligible?
- —
Short-term bridge; refi at stabilization.
Rent comps 10 comps
| Address | Beds | Baths | Sqft | Rent | $/sqft | DOM | Units | Dist |
|---|---|---|---|---|---|---|---|---|
| 1671 Shadow Ridge Ct Belleville, IL | 1.0–2.0 | 1.0 | 815 | $1,325 | $1.62 | 1d | 12 | 0.21mi |
| 1730 Shadow Ridge Ct Belleville, IL | 1.0 | 1.0 | 750 | $1,050 | $1.40 | 1d | 1 | 0.26mi |
| 308 Bobbie Dr Swansea, IL | 2.0 | 2.0 | 1130 | $1,500 | $1.33 | 23d | 1 | 0.36mi |
| 1107 Bristow St Belleville, IL | 3.0 | 1.0 | 1238 | $1,500 | $1.21 | 12d | 1 | 0.60mi |
| 1528 Lebanon Ave Belleville, IL | 2.0 | 1.0 | 900 | $1,095 | $1.22 | 12d | 1 | 0.72mi |
| 1717 La Salle St Belleville, IL | 3.0 | 1.0 | 1104 | $1,350 | $1.22 | 23d | 1 | 0.73mi |
| 1308 Caseyville Ave Swansea, IL | 2.0 | 1.0 | 890 | $1,200 | $1.35 | 4d | 1 | 0.83mi |
| 25 Glencoe Dr Belleville, IL | 3.0 | 1.0 | 1200 | $1,275 | $1.06 | 23d | 1 | 1.09mi |
| 1912 N 17th St Swansea, IL | 2.0 | 1.0 | 1414 | $1,500 | $1.06 | 17d | 1 | 1.34mi |
| 310 N 10th St Belleville, IL | 2.0 | 1.0 | 1270 | $1,300 | $1.02 | 2d | 1 | 1.42mi |
Listing history 4 events
-
2026-06-18days on market $105,000 Active 3 DOM
-
2026-06-17days on market $105,000 Active 2 DOM
-
2026-06-16remarks 353-char remark
-
2026-06-16$105,000 Active 1 DOM
ⓘ Source: listings_history table (triggers on properties + properties_extension) + one-shot
backfill from property_details.listing_events for pre-trigger history.
Tax reassessment forecast IL · Partial reset (capped growth)
- Current annual tax
- $3,134 · $261/mo
- Projected year-2 tax
- $3,134 · $261/mo
- Expected delta
- $0/yr ($0/mo · 0.0%)
ⓘ Screening estimate from a state-policy table — verify with the county assessor before closing.
Climate risk First Street
- Flood 1/10 Low FEMA zone X · 0% chance over 30 yrs
- Wildfire 1/10 Low
- Heat 5/10 Major 7 d/yr ≥107°F today · 21 d/yr by 30 yrs out
- Wind 2/10 Low 100% chance of damaging wind over 30 yrs
- Air quality 4/10 Moderate 3 unhealthy d/yr today · 6 by 30 yrs out
Nearby sold comps map
Loading sold comps map…
Walkable amenities ~0.75 mi
Loading nearby amenities…
Taxation est. · year 1
- Rental income
- $15,269
- − Mortgage interest
- −$5,882
- − Property taxes
- −$3,134
- − Insurance
- −$525
- − Repairs & maintenance
- −$1,222
- − Management
- −$1,222
- − Depreciation
- −$3,055
- Taxable income
- $231
- Est. tax owed @ 24.0%
- −$55
- After-tax cash flow
- $1,741/yr
For passive investors: Depreciation is non-cash, so a rental often shows a tax loss while cash-flowing — sheltering income. Rental losses are passive: they offset passive income freely, and up to $25,000/yr can offset ordinary (W-2) income if you actively participate and your MAGI is under $100k (phasing out to $0 by $150k); unused losses carry forward. On sale, claimed depreciation is recaptured at up to 25%, and gains may owe capital-gains tax (a 1031 exchange can defer both). Figures are a year-1 estimate at your 24.0% rate — not tax advice; consult a CPA.
Schools (NCES district)
- District
- Belleville Twp Hsd 201
- NCES district ID
- 1705640
- Math proficiency
- 21% ▼ -8.00%
- Reading proficiency
- 28% ▼ -3.00%
- Median HH income
- $58,064
- Composite
- 22.39/100
- National rank
- #8115
- State rank
- #308 of 620 in IL
Livability — Swansea
- Score
- 80/100
- State rank
- #105
- US rank
- #1705
Category grades
Schools grade is shown separately in the Schools card above.
Census & demographics
- Census place
- Swansea, IL
- County
- Saint Clair County · 169,691 people
- City population
- 28,543
- Metro
- St. Louis, MO-IL
- Population (ZIP)
- 28,255
- Household income
- $70,797
- Rent vs Own
- Severe rent burden
- 824.0
Population outlook (St. Clair County) Hauer SSP2
- Today (2025)
- 250,366 people
- By 2030
- 240,511 · -3.9%
- By 2040
- 217,391 · -13.2%
- By 2050
- 192,699 · -23.0%
- By 2075
- 140,637 · -43.8%
- By 2100
- 100,499 · -59.9%
Race, ethnicity, and origin ACS 2023
- Neighborhood character
- Majority White (64%)
- Race & ethnicity
- White 64% Black 24% Two or more races 7% Hispanic / Latino 3% Asian 2%
- Common ancestry
- Romanian 4% Lithuanian 2% Slovak 2%
- Foreign-born
- 4% · Canada, China
- Languages at home
- 96% English-only · Chinese 1% Spanish 1%
Political lean MEDSL · St. Clair
- 2024 margin
- Lean D (+7.9) · D 53.0% · R 45.1% · Other 1.8%
- 2008→2024 swing
- -14.6pp toward R · 2008: 22.4pp · 2024: 7.9pp
- All cycles
- 2024: D+7.9 2020: D+8.7 2016: D+5.6 2012: D+14.5 2008: D+22.4
Not yet ingested
- Civics
- —
Market trends
- HPI YoY
- ▼ -83.57%
- Current HPI
- 133.9028
- Rent YoY
- ▲ 4.56%
- Metro
- St. Louis, MO-IL
- State GDP YoY
- ▲ 1.59%
- F500 in state
- 60
Industry mix (Fortune 500 HQ in IL)
| Industry | F500 HQs | Revenue |
|---|---|---|
| Insurance | 4 | $201B |
|
||
| Consumer Goods | 4 | $87B |
|
||
| Industrial Machinery | 3 | $64B |
|
||
| Healthcare | 2 | $55B |
|
||
| Retail / Pharmacy | 1 | $148B |
|
||
| Agriculture / Food | 1 | $86B |
|
||
Price history
1 event — show timeline
- 2026-06-15 Listed $105,000 MARIS as Distributed by MLS Grid
Property tax history
+2.0%/yrLatest (2024): $3,134 · -2.2% YoY. Source: county tax records.
Cash-flow waterfall
monthlySold comps — $/sqft
last 12 mo · ≤1 miLoading sold comps…