 Duplex
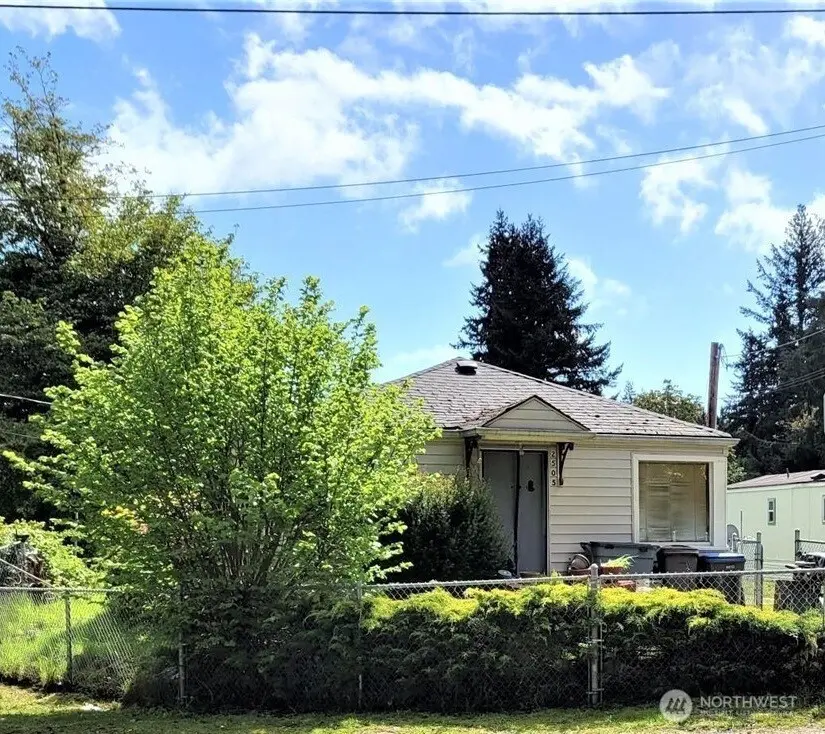
2507 Erlands Point Rd NW · Kitsap Lake, WA
Flood risk 1/10 · Minimal
- FEMA flood zone
- X (unshaded)
- Chance of flooding over 30 yrs
- 0.0%
- Est. flood insurance / yr
- $507 – $1,088
Fire risk 1/10 · Minimal
- Est. fire insurance / yr
- $604 – $1,122
Heat risk 3/10 · Minor
- Hot days now (above 86°F)
- 7 days/yr
- Hot days in 30 yrs
- 16 days/yr
Wind risk 1/10 · Minimal
- Chance of severe wind over 30 yrs
- —
Air-quality risk 7/10 · Major
- Unhealthy air days now
- 10 days/yr
- Unhealthy air days in 30 yrs
- 10 days/yr
Risk factors via First Street. Map © Google.
Why this score? — see what drove the C grade
The composite is a weighted blend of 9 inputs, each scored 0–100. Each bar is that input's sub-score; the figure is the points it added to the 100-point composite (weight × sub-score).
- Cash flow +22.9/30.0
- ARV discount +7.5/15.0
- DSCR +7.3/10.0
- Schools +5.5/10.0
- 1% rule +5.1/10.0
- Rent growth +2.6/5.0
- Livability +2.5/5.0
- Condition / age +2.5/5.0
- Appreciation +0.0/10.0
$409,900
🖨 Deal sheet 📄 Offer letter ✓ Due diligence
Multi-family units
County records classify this as Multi-Family (2-4 Unit). Listing-text estimate: 2 units. confirmed
Listing remarks
Centrally located duplex in the desirable Erlands Point Community and 1 block from the Kitsap Golf & Country Club! EZ property to rent! 2505 is a 1 bedroom / 1 bath unit with a long-term tenant and in great shape. 2507 is 2 bedroom / 1 bath with new "Life Proof" flooring and a modest remodel. Both units have newer dbl pane vinyl windows. This property can be purchased together with the neighboring property located at 3500 Dyes Inlet Rd, MLS# 2456797 and the owner is willing to consider owner financing with agreeable terms, OAC. Great opportunity for the first time home buyer or an investor!
Key facts
- 3,920 sq ft lot
- Built 1944
- Listed 75 days
Tags
Neighborhood map
What this means for you Summary
Snapshot
- This is a 2 × 3-bed/1.0-bath units multifamily listed at $410k.
Deal economics
- At list price, monthly cash flow is $718 ($9k/yr) — positive. Per door: $359/mo.
- The deal already cash-flows at list — no discount required.
- Meets the 1% rule at list price ($4k rent vs $410k).
- Recommended offer: $385k (6.0% below list) — sets the bar for market timing.
Location & tenants
- Location reads: area grade C — affects rentability + tenant quality, not the cash-flow math above.
- Central Kitsap School District (urban): math 55% / reading 67% proficiency, ranked #49 of 291 in WA (top 17%) — acceptable for families but not a draw, mixed tenant base, ~2y average lease.
- Market conditions: Rents flat; 349 active listings in the ZIP; 8 comparable units currently listed for rent nearby; rentals leasing fast (median 14d on market — plan ~1-2 weeks tenant-placement turnaround); solid renter incomes; 1,294 units permitted in Kitsap County in 2024 (302 in 5+ unit buildings).
- At $4,132/mo this rent would consume 55% of the median local household income ($90k/yr) (locally 993% of renters already pay >50% of income on rent) — very limited rent-growth headroom before tenants either downsize or default.
Forward outlook
- Local home prices are declining (-3.0%/yr); year-one equity from $3k of loan paydown is wiped out by about $12k of value loss. Plan a longer hold.
- Kitsap County population projected at +8% by 2050 — modest demand growth; plan on rents tracking national, not racing it.
Negotiation context
- It's been on market 75 days — a 6% lower offer ($385k) is reasonable based on typical stale-listing flexibility.
- 2 sale attempts since 23y ago with the ask held roughly flat each time — persistent listings suggest the price (not the market) is what's stuck; bring a comps-based counter.
- Current owner paid $128k; list at $410k implies a 219% gain — meaningful room to come down on a strong offer.
Risks & watch-outs
- Watch-outs: built in 1944 — expect roof / HVAC / electrical / plumbing capex.
Questions for the listing agent
- It's been on market 75 days. Have you received any prior offers? Is the seller open to a 6% concession, seller financing, or rate buy-down credit?
- Can we see the unit-by-unit rent roll, current vacancy, and any below-market leases? What's the average tenancy length?
- What capital expenditures (roof, boiler, parking lot, exteriors) have been made in the last 5 years, and what's planned in the next 2?
- Built in 1944 — when were the roof, HVAC, electrical panel, plumbing, and water heater last replaced?
- Why hasn't it sold? Are there any deal-killer items the seller is aware of (foundation, flood, title, zoning, code violations)?
- Is there a deadline driving the sale (1031 exchange, divorce, estate, relocation)? That informs how much negotiation room exists.
- What's the average days-on-market for RENTAL listings here right now (not sales)? A rising rental-DOM trend means longer vacancies and softer asking-rent achievability than the comps imply.
- What's the recent tenant-quality profile in this submarket — average credit score on applications, eviction rate, late-payment / NSF rate, and stable-employment percentage? A property-management company in the area should have these aggregated.
- How much new apartment / multifamily construction is in the pipeline within 1–3 miles? Heavy new supply (>2% of stock underway) typically softens rents 12–24 months out; light construction supports rent growth.
Investment metrics
- 1% rule
- 1.01% ✓
- Cap rate
- 8.40%
- Cash-on-cash
- 7.51%
- DSCR
- 1.33
- GRM
- 8.3
CMA / ARV
No comps found within radius.
Projected returns pro-forma
-3.0% appreciation · 0.28% rent growth · sell at horizon
- IRR
- -7.7%
- Equity multiple
- 0.72×
- Total profit
- $-31,791
- Equity at exit
- $61,117
- IRR
- -1.7%
- Equity multiple
- 0.90×
- Total profit
- $-12,014
- Equity at exit
- $35,441
Cash invested: $114,772 (down + closing). Projections, not guarantees.
Landlord ↔ Tenant lean methodology
- Overall (STATE)
- 28 Tenant-Leaning
- State Washington
- 28 Tenant-Leaning · D+8
- County
- — inherits STATE
- City
- — inherits STATE
ZIP-level market 98312
- Rents YoY
- 0.3%
- Active inventory
- 349
- Price-to-rent
- 16.5×
Monthly cashflow live
- Estimated rent
- $4,132 medium interval (Pro) →
- Mortgage (P&I)
- −$2,150
- Tax from tax record
- −$226 /mo · $2,707/yr
- Insurance
- −$171
- HOA
- −$0
- Vacancy / Maint / Mgmt
- −$868
- Net cashflow
- $718
Break-even live
2-unit breakdown (identical units grouped — click to expand)
| Units | Beds | Baths | Est. rent |
|---|---|---|---|
| 2× units | 3 | 1 | $4,132 |
| #1 | 3 | 1 | $2,066 |
| #2 | 3 | 1 | $2,066 |
| Total (2 units) | $4,132 | ||
UW: 25.0% down · 7.5% · 30yr · 1.5% tax · 5.0% vac · 8.0% maint · 8.0% mgmt
Financing live
Cash to close
- Down payment
- $102,475
- Closing costs
- $12,297
- Reserves months
- —
- Total cash needed
- —
Loan-product check · same deal, 3 products live
Conventional
25% down · 7.5% · 30yr
- Down + closing
- —
- Monthly P&I
- —
- Monthly cashflow
- —
- DSCR
- —
- Eligible?
- —
Personal DTI + credit; lowest rate.
DSCR
20% down · 8.5% · 30yr
- Down + closing
- —
- Monthly P&I
- —
- Monthly cashflow
- —
- DSCR
- —
- Eligible?
- —
No personal income docs; deal must DSCR.
Hard money
10% down · 12.0% · 12mo
- Down + closing
- —
- Monthly P&I
- —
- Monthly cashflow
- —
- DSCR
- —
- Eligible?
- —
Short-term bridge; refi at stabilization.
Rent comps 8 comps
| Address | Beds | Baths | Sqft | Rent | $/sqft | DOM | Units | Dist |
|---|---|---|---|---|---|---|---|---|
| 3000 Austin Dr Bremerton, WA | 1.0–3.0 | 1.0–2.0 | 950 | $2,150 | $2.26 | 13d | 10 | 0.17mi |
| 3873 NW Fairway Ln Bremerton, WA | 2.0–3.0 | 2.0 | 1025 | $2,125 | $2.07 | 13d | 10 | 0.20mi |
| 3985 NW Dyes Inlet Ln Bremerton, WA | 2.0 | 1.0 | 900 | $2,100 | $2.33 | 13d | 1 | 0.23mi |
| 3405 Northlake Way NW Unit 3 Bremerton, WA | 2.0 | 1.0 | 748 | $1,500 | $2.01 | 13d | 1 | 0.44mi |
| 3000 Northlake Way NW Bremerton, WA | 2.0 | 1.0 | 729 | $1,400 | $1.92 | 43d | 1 | 0.66mi |
| 4091 NW Country Ln Bremerton, WA | 2.0 | 1.0 | 800 | $1,600 | $2.00 | 13d | 1 | 0.77mi |
| 4091 Country Ln NW Unit 9 Bremerton, WA | 2.0 | 1.0 | 800 | $1,600 | $2.00 | 21d | 1 | 0.77mi |
| 5302 Chico Way NW Bremerton, WA | 2.0 | 1.0 | 1200 | $2,700 | $2.25 | 21d | 1 | 1.16mi |
Listing history 10 events
-
2026-06-02days on market $409,900 Active 75 DOM
-
2026-06-01days on market $409,900 Active 74 DOM
-
2026-05-31days on market $409,900 Active 73 DOM
-
2026-05-30days on market $409,900 Active 72 DOM
-
2026-04-16price $409,900
-
2026-03-19$413,900 Active
-
2003-10-09soldstatus $128,500
-
2003-10-09soldstatus $128,500
-
2003-05-05$133,900
-
1999-04-26soldstatus $44,000
ⓘ Source: listings_history table (triggers on properties + properties_extension) + one-shot
backfill from property_details.listing_events for pre-trigger history.
Tax reassessment forecast WA · Resets to sale price
- Current annual tax
- $2,707 · $226/mo
- Projected year-2 tax
- $4,017 · $335/mo
- Expected delta
- +$1,310/yr (+$109/mo · 48.4%)
ⓘ Screening estimate from a state-policy table — verify with the county assessor before closing.
Climate risk First Street
- Flood 1/10 Low FEMA zone X (unshaded) · 0% chance over 30 yrs
- Wildfire 1/10 Low
- Heat 3/10 Moderate 7 d/yr ≥86°F today · 16 d/yr by 30 yrs out
- Wind 1/10 Low
- Air quality 7/10 Severe 10 unhealthy d/yr today · 10 by 30 yrs out
Nearby sold comps map
Loading sold comps map…
Walkable amenities ~0.75 mi
Loading nearby amenities…
Taxation est. · year 1
- Rental income
- $49,584
- − Mortgage interest
- −$22,961
- − Property taxes
- −$2,707
- − Insurance
- −$2,050
- − Repairs & maintenance
- −$3,967
- − Management
- −$3,967
- − Depreciation
- −$11,924
- Taxable income
- $2,009
- Est. tax owed @ 24.0%
- −$482
- After-tax cash flow
- $8,138/yr
For passive investors: Depreciation is non-cash, so a rental often shows a tax loss while cash-flowing — sheltering income. Rental losses are passive: they offset passive income freely, and up to $25,000/yr can offset ordinary (W-2) income if you actively participate and your MAGI is under $100k (phasing out to $0 by $150k); unused losses carry forward. On sale, claimed depreciation is recaptured at up to 25%, and gains may owe capital-gains tax (a 1031 exchange can defer both). Figures are a year-1 estimate at your 24.0% rate — not tax advice; consult a CPA.
Schools (NCES district)
- District
- Central Kitsap School District
- NCES district ID
- 5301080
- Math proficiency
- 55% ▲ 1.00%
- Reading proficiency
- 67% ▬ 0.00%
- Median HH income
- $64,825
- Composite
- 54.87/100
- National rank
- #2813
- State rank
- #49 of 291 in WA
Livability — Kitsap Lake
No livability data for this city. (Only ~50 U.S. cities are tracked.)
Census & demographics
- Census place
- Kitsap Lake, WA
- County
- Kitsap County · 243,099 people
- Metro
- Bremerton-Silverdale-Port Orchard, WA
- Population (ZIP)
- 36,307
- Household income
- $90,449
- Rent vs Own
- Severe rent burden
- 993.0
Population outlook (Kitsap County) Hauer SSP2
- Today (2025)
- 277,525 people
- By 2030
- 285,040 · +2.7%
- By 2040
- 294,957 · +6.3%
- By 2050
- 300,622 · +8.3%
- By 2075
- 315,580 · +13.7%
- By 2100
- 304,340 · +9.7%
Race, ethnicity, and origin ACS 2023
- Neighborhood character
- Predominantly White (68%)
- Race & ethnicity
- White 68% Two or more races 13% Hispanic / Latino 12% Asian 4% Black 4% Native American 1%
- Hispanic origin (detail)
- Mexican 6% Puerto Rican 1%
- Common ancestry
- Italian 7% Portuguese 5% Slovak 4%
- Foreign-born
- 6% · Canada, China
- Languages at home
- 91% English-only · Spanish 4% Tagalog/Filipino 2% Other Asian/Pacific 1%
Political lean MEDSL · Kitsap
- 2024 margin
- Strong D (+20.9) · D 58.8% · R 37.9% · Other 3.3%
- 2008→2024 swing
- +8.6pp toward D · 2008: 12.3pp · 2024: 20.9pp
- All cycles
- 2024: D+20.9 2020: D+18.1 2016: D+11.6 2012: D+11.1 2008: D+12.3
Not yet ingested
- Civics
- —
Market trends
- HPI YoY
- ▼ -436.68%
- Current HPI
- 379.2342
- Rent YoY
- ▲ 0.28%
- Metro
- Bremerton-Silverdale-Port Orchard, WA
- State GDP YoY
- ▲ 4.65%
- F500 in state
- 22
Industry mix (Fortune 500 HQ in WA)
| Industry | F500 HQs | Revenue |
|---|---|---|
| Retail | 2 | $269B |
|
||
| Technology / Retail | 1 | $638B |
|
||
| Technology | 1 | $245B |
|
||
| Telecommunications | 1 | $38B |
|
||
| Food / Beverage | 1 | $36B |
|
||
| Automotive / Trucks | 1 | $34B |
|
||
Price history
+831.6% since first listed6 events — show timeline
- 2026-04-16 Price Changed $409,900 NWMLS as Distributed by MLS Grid
- 2026-03-19 Listed $413,900 NWMLS as Distributed by MLS Grid
- 2003-10-09 Sold (Public Records) $128,500 Public Records
- 2003-10-09 Sold (MLS) $128,500 NWMLS as Distributed by MLS Grid
- 2003-05-05 Listed $133,900 NWMLS as Distributed by MLS Grid
- 1999-04-26 Sold (Public Records) $44,000 Public Records
Property tax history
+2.9%/yrLatest (2026): $2,707 · +1.1% YoY. Source: county tax records.
Cash-flow waterfall
monthlySold comps — $/sqft
last 12 mo · ≤1 miLoading sold comps…