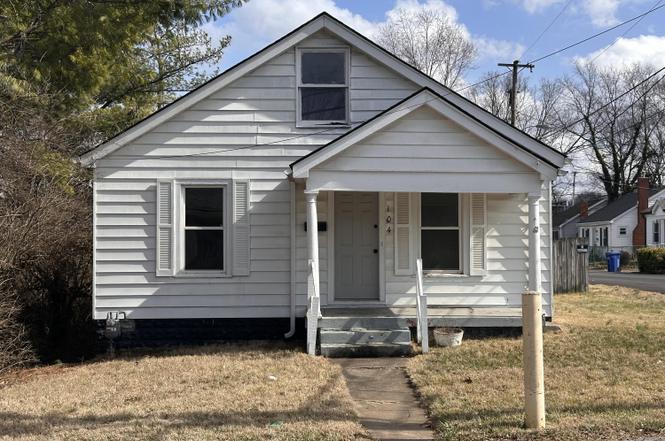
104 Cisco Rd · Lexington-Fayette, KY
Flood risk 1/10 · Minimal
- FEMA flood zone
- X (unshaded)
- Chance of flooding over 30 yrs
- 0.0%
- Est. flood insurance / yr
- $507 – $1,088
Fire risk 1/10 · Minimal
- Est. fire insurance / yr
- $839 – $1,559
Heat risk 4/10 · Minor
- Hot days now (above 101°F)
- 7 days/yr
- Hot days in 30 yrs
- 19 days/yr
Wind risk 2/10 · Minimal
- Chance of severe wind over 30 yrs
- 1.0%
Air-quality risk 1/10 · Minimal
- Unhealthy air days now
- 0 days/yr
- Unhealthy air days in 30 yrs
- 0 days/yr
Risk factors via First Street. Map © Google.
Why this score? — see what drove the B+ grade
The composite is a weighted blend of 9 inputs, each scored 0–100. Each bar is that input's sub-score; the figure is the points it added to the 100-point composite (weight × sub-score).
- Cash flow +30.0/30.0
- ARV discount +15.0/15.0
- 1% rule +10.0/10.0
- DSCR +10.0/10.0
- Rent growth +3.9/5.0
- Schools +3.4/10.0
- Livability +2.5/5.0
- Condition / age +2.5/5.0
- Appreciation +0.0/10.0
$99,000
🖨 Deal sheet 📄 Offer letter ✓ Due diligence
Listing remarks
Affordable Lexington opportunity for buyers ready to renovate and add value or inverters looking to add to their portfolio. This property features a covered front porch and a compact footprint with potential, including an upper/attic area and multiple rooms to reconfigure to your vision. Interior condition reflects significant deferred maintenance and repair needs; bring your contractor and plan accordingly. Property is being sold AS-IS, where-is, with no warranties expressed or implied. Buyer to verify all information including but not limited to square footage, condition, utilities, schools, zoning, and suitability for buyer's intended use.
Key facts
- Covered front porch
- Upper attic area
- Multiple rooms
Tags
Neighborhood map
What this means for you Summary
Snapshot
- This is a 3-bed/1.0-bath single-family listed at $99k.
Deal economics
- At list price, monthly cash flow is $669 ($8k/yr) — positive.
- The deal already cash-flows at list — no discount required.
- Meets the 1% rule at list price ($2k rent vs $99k).
- Cap rate 14.4% vs local median 3.8% in Lexington-Fayette — top-decile yield for the area; either an underpriced asset or a hidden risk that comps aren't pricing in. Stress-test before assuming the spread holds.
Location & tenants
- Location reads: area grade B — affects rentability + tenant quality, not the cash-flow math above.
- Fayette County (urban): math 35% / reading 45% proficiency, ranked #27 of 165 in KY (top 16%) — families likely to look elsewhere, expect single-tenant / working-renter base with shorter leases.
- Zoned schools: Picadome Elementary School (math 32% / reading 42%, grade F, #255 of 676 statewide, top 42%, 430 students, 56% FRL); Jessie M Clark Middle School (math 39% / reading 54%, grade D+, #28 of 217 statewide, top 13%, 1,044 students, 34% FRL); Lafayette High School (math 47% / reading 54%, grade D+, #10 of 254 statewide, top 4%, 2,432 students, 38% FRL) — zoned schools at 43% FRL track the district average.
- Market conditions: Rents rising fast (+5.7%/yr); 59 active listings in the ZIP; 24 comparable units currently listed for rent nearby; rentals at typical pace (median 23d on market — plan ~3-4 weeks tenant-placement turnaround); 1,036 units permitted in Fayette County in 2024 (542 in 5+ unit buildings).
- This rent runs 41% of the median local income ($46k/yr) — at the standard rent-burdened threshold; future hikes will face affordability resistance.
Forward outlook
- Local home prices are declining (-3.0%/yr); year-one equity from $684 of loan paydown is wiped out by about $3k of value loss. Plan a longer hold.
- Fayette County population projected at +35% by 2050 — long-run rental-demand tailwind backs the buy-and-hold thesis.
- At projected returns (-3.0% appreciation + 5.7% rent growth), your $28k cash investment doubles in ~4 years — after that, you're playing with house money.
Negotiation context
- Only 1 days on market — expect competitive offers; lowballing is unlikely to land.
Risks & watch-outs
- Watch-outs: built in 1940 — expect roof / HVAC / electrical / plumbing capex.
Questions for the listing agent
- Built in 1940 — when were the roof, HVAC, electrical panel, plumbing, and water heater last replaced?
- Is there a deadline driving the sale (1031 exchange, divorce, estate, relocation)? That informs how much negotiation room exists.
- What's the average days-on-market for RENTAL listings here right now (not sales)? A rising rental-DOM trend means longer vacancies and softer asking-rent achievability than the comps imply.
- What's the recent tenant-quality profile in this submarket — average credit score on applications, eviction rate, late-payment / NSF rate, and stable-employment percentage? A property-management company in the area should have these aggregated.
- How much new for-sale + rental construction is in the pipeline within 1–3 miles? Heavy new supply typically softens prices + rents 12–24 months out; constrained supply supports both.
Investment metrics
- 1% rule
- 1.60% ✓
- Cap rate
- 14.40%
- Cash-on-cash
- 28.94%
- DSCR
- 2.29
- GRM
- 5.2
CMA / ARV
- ARV (on-the-fly)
- $157,383
- Comps found
- 2
Show comp detail 2 sales within ~0.75 mi
| Address | Dist | Beds/Ba | Sqft | Sold | Price | $/sf | Match |
|---|---|---|---|---|---|---|---|
| 416 Ferguson St | 0.54mi | 2/1.0 (-1) | 755 (-4%) | 18mo | $52,500 | $70 | 49 |
| 1162 Martin St | 0.48mi | 2/1.0 (-1) | 735 (-6%) | 18mo | $148,000 | $201 | 47 |
Match score weights: distance 35% · size 25% · config 20% · recency 20%. Top-matched comps best support the ARV.
Projected returns pro-forma
-3.0% appreciation · 5.7% rent growth · sell at horizon
- IRR
- 26.1%
- Equity multiple
- 2.12×
- Total profit
- $30,920
- Equity at exit
- $14,761
- IRR
- 35.2%
- Equity multiple
- 4.64×
- Total profit
- $100,774
- Equity at exit
- $8,560
Cash invested: $27,720 (down + closing). Projections, not guarantees.
Landlord ↔ Tenant lean methodology
- Overall (STATE)
- 83 Strongly Landlord-Friendly
- State Kentucky
- 83 Strongly Landlord-Friendly · R+16
- County
- — inherits STATE
- City
- — inherits STATE
ZIP-level market 40504
- Rents YoY
- 5.7%
- Active inventory
- 59
- Price-to-rent
- 5.2×
Monthly cashflow live
- Estimated rent
- $1,585 high interval (Pro) →
- Mortgage (P&I)
- −$519
- Tax from tax record
- −$23 /mo · $277/yr
- Insurance
- −$41
- HOA
- −$0
- Vacancy / Maint / Mgmt
- −$333
- Net cashflow
- $669
Break-even live
UW: 25.0% down · 7.5% · 30yr · 1.5% tax · 5.0% vac · 8.0% maint · 8.0% mgmt
Financing live
Cash to close
- Down payment
- $24,750
- Closing costs
- $2,970
- Reserves months
- —
- Total cash needed
- —
Loan-product check · same deal, 3 products live
Conventional
25% down · 7.5% · 30yr
- Down + closing
- —
- Monthly P&I
- —
- Monthly cashflow
- —
- DSCR
- —
- Eligible?
- —
Personal DTI + credit; lowest rate.
DSCR
20% down · 8.5% · 30yr
- Down + closing
- —
- Monthly P&I
- —
- Monthly cashflow
- —
- DSCR
- —
- Eligible?
- —
No personal income docs; deal must DSCR.
Hard money
10% down · 12.0% · 12mo
- Down + closing
- —
- Monthly P&I
- —
- Monthly cashflow
- —
- DSCR
- —
- Eligible?
- —
Short-term bridge; refi at stabilization.
Rent comps 24 comps
| Address | Beds | Baths | Sqft | Rent | $/sqft | DOM | Units | Dist |
|---|---|---|---|---|---|---|---|---|
| 700 Red Mile Rd Lexington, KY | 1.0–2.0 | 1.0 | 699 | $1,295 | $1.85 | 21d | 1 | 0.15mi |
| 845 Red Mile Rd Lexington, KY | 1.0–3.0 | 1.0–2.0 | 821 | $1,953 | $2.38 | 13d | 33 | 0.33mi |
| 1861 Dunkirk Dr Lexington, KY | 3.0 | 1.0 | 975 | $1,595 | $1.64 | 13d | 1 | 0.61mi |
| 208 Clyde St Lexington, KY | 2.0 | 1.0 | 982 | $1,100 | $1.12 | 21d | 1 | 0.74mi |
| 1885 Dunkirk Dr Lexington, KY | 3.0 | 1.0 | 1090 | $1,600 | $1.47 | 13d | 1 | 0.75mi |
| 301 Thompson Rd Lexington, KY | 3.0 | 1.0 | 1008 | $1,450 | $1.44 | 13d | 1 | 0.77mi |
| 832 W High St Unit 1 Lexington, KY | 3.0 | 1.5 | 900 | $1,400 | $1.56 | 23d | 1 | 0.95mi |
| 380 Virginia Ave Lexington, KY | 2.0 | 1.0–2.0 | 771 | $2,615 | $3.39 | 13d | 50 | 0.96mi |
| 261 Simpson Ave Lexington, KY | 3.0 | 2.0 | 1025 | $1,710 | $1.67 | 13d | 1 | 0.99mi |
| 585 S Upper St #114 Lexington, KY | 2.0 | 2.0 | 1000 | $1,995 | $2.00 | 23d | 1 | 1.14mi |
| 120 Burley Ave Lexington, KY | 3.0 | 1.0 | 928 | $1,500 | $1.62 | 23d | 1 | 1.19mi |
| 805 Press Ave Lexington, KY | 1.0–2.0 | 1.0 | 507 | $1,450 | $2.86 | 23d | 1 | 1.25mi |
| 2059 Deauville Dr Lexington, KY | 3.0 | 1.0 | 925 | $1,695 | $1.83 | 23d | 1 | 1.27mi |
| 1728 Shenandoah Dr Lexington, KY | 3.0 | 1.0 | 1125 | $1,650 | $1.47 | 13d | 1 | 1.27mi |
| 261 S Limestone #303 Lexington, KY | 2.0 | 2.0 | 1102 | $2,995 | $2.72 | 23d | 1 | 1.35mi |
| 149 Old Towne Walk Lexington, KY | 1.0–3.0 | 1.0–3.0 | 906 | $1,964 | $2.17 | 23d | 1 | 1.35mi |
| 275 S Limestone #115 Lexington, KY | 2.0 | 2.0 | 1010 | $2,500 | $2.48 | 23d | 1 | 1.35mi |
| 140 Gazette Ave Lexington, KY | 3.0 | 1.5 | 875 | $1,750 | $2.00 | 23d | 1 | 1.38mi |
| 2045 Cambridge Dr Lexington, KY | 2.0 | 1.0 | 800 | $1,185 | $1.48 | 21d | 1 | 1.40mi |
| 476 Bob O Link Dr Unit B Lexington, KY | 2.0 | 1.0 | 1002 | $1,300 | $1.30 | 23d | 1 | 1.41mi |
| 342 Waller Ave Lexington, KY | 1.0–2.0 | 1.0–1.5 | 720 | $1,400 | $1.94 | 23d | 1 | 1.42mi |
| 1568 Alexandria Dr Lexington, KY | 2.0 | 1.0 | 900 | $875 | $0.97 | 13d | 1 | 1.47mi |
| 723 Charles Ave Lexington, KY | 3.0 | 1.0 | 992 | $1,300 | $1.31 | 13d | 1 | 1.48mi |
| 330 Newtown Pike Lexington, KY | 1.0–3.0 | 1.0–2.0 | 976 | $1,377 | $1.41 | 23d | 1 | 1.48mi |
Listing history 3 events
-
2026-04-23soldstatus $99,000
-
2026-03-06status Pending
-
2026-02-17$99,000 Active
ⓘ Source: listings_history table (triggers on properties + properties_extension) + one-shot
backfill from property_details.listing_events for pre-trigger history.
Tax reassessment forecast KY · Resets to sale price
- Current annual tax
- $277 · $23/mo
- Projected year-2 tax
- $851 · $71/mo
- Expected delta
- +$575/yr (+$48/mo · 207.7%)
ⓘ Screening estimate from a state-policy table — verify with the county assessor before closing.
Climate risk First Street
- Flood 1/10 Low FEMA zone X (unshaded) · 0% chance over 30 yrs
- Wildfire 1/10 Low
- Heat 4/10 Moderate 7 d/yr ≥101°F today · 19 d/yr by 30 yrs out
- Wind 2/10 Low 100% chance of damaging wind over 30 yrs
- Air quality 1/10 Low 0 unhealthy d/yr today · 0 by 30 yrs out
Nearby sold comps map
Loading sold comps map…
Walkable amenities ~0.75 mi
Loading nearby amenities…
Taxation est. · year 1
- Rental income
- $19,018
- − Mortgage interest
- −$5,546
- − Property taxes
- −$277
- − Insurance
- −$495
- − Repairs & maintenance
- −$1,521
- − Management
- −$1,521
- − Depreciation
- −$2,880
- Taxable income
- $6,778
- Est. tax owed @ 24.0%
- −$1,627
- After-tax cash flow
- $6,396/yr
For passive investors: Depreciation is non-cash, so a rental often shows a tax loss while cash-flowing — sheltering income. Rental losses are passive: they offset passive income freely, and up to $25,000/yr can offset ordinary (W-2) income if you actively participate and your MAGI is under $100k (phasing out to $0 by $150k); unused losses carry forward. On sale, claimed depreciation is recaptured at up to 25%, and gains may owe capital-gains tax (a 1031 exchange can defer both). Figures are a year-1 estimate at your 24.0% rate — not tax advice; consult a CPA.
Schools (NCES district)
- District
- Fayette County
- NCES district ID
- 2101860
- Math proficiency
- 35% ▼ -16.00%
- Reading proficiency
- 45% ▼ -13.00%
- Median HH income
- $49,245
- Composite
- 34.38/100
- National rank
- #5211
- State rank
- #27 of 165 in KY
Livability — Lexington-Fayette
No livability data for this city. (Only ~50 U.S. cities are tracked.)
Census & demographics
- Census place
- Lexington-Fayette, KY
- County
- Fayette County · 317,143 people
- City population
- 321,882
- Metro
- Lexington-Fayette, KY
- Population (ZIP)
- 25,816
- Household income
- $46,055
- Rent vs Own
- Severe rent burden
- 2225.0
Population outlook (Fayette County) Hauer SSP2
- Today (2025)
- 363,454 people
- By 2030
- 388,270 · +6.8%
- By 2040
- 438,688 · +20.7%
- By 2050
- 490,667 · +35.0%
- By 2075
- 625,394 · +72.1%
- By 2100
- 721,354 · +98.5%
Race, ethnicity, and origin ACS 2023
- Neighborhood character
- Diverse neighborhood (Simpson 0.57)
- Race & ethnicity
- White 61% Hispanic / Latino 18% Black 15% Two or more races 9% Asian 2%
- Hispanic origin (detail)
- Mexican 13%
- Common ancestry
- Slovak 2% Iranian 2% Lithuanian 2%
- Foreign-born
- 15% · Canada, China
- Languages at home
- 79% English-only · Spanish 15% Arabic 1% Chinese 1%
Political lean MEDSL · Fayette
- 2024 margin
- D (+18.1) · D 58.0% · R 39.9% · Other 2.1%
- 2008→2024 swing
- +13.3pp toward D · 2008: 4.8pp · 2024: 18.1pp
- All cycles
- 2024: D+18.1 2020: D+20.8 2016: D+9.5 2012: D+1.0 2008: D+4.8
Not yet ingested
- Civics
- —
Market trends
- HPI YoY
- ▼ -221.10%
- Current HPI
- 255.3941
- Rent YoY
- ▲ 5.70%
- Metro
- Lexington-Fayette, KY
- State GDP YoY
- ▲ 1.81%
- F500 in state
- 4
Industry mix (Fortune 500 HQ in KY)
| Industry | F500 HQs | Revenue |
|---|---|---|
| Healthcare | 1 | $118B |
|
||
| Food / Beverage | 1 | $7B |
|
||
Price history
+0.0% since first listed3 events — show timeline
- 2026-04-23 Sold (Public Records) $99,000 Public Records
- 2026-03-06 Pending — ImagineMLS
- 2026-02-17 Listed $99,000 ImagineMLS
Property tax history
-1.9%/yrLatest (2015): $277 · -1.9% YoY. Source: county tax records.
Cash-flow waterfall
monthlySold comps — $/sqft
last 12 mo · ≤1 miLoading sold comps…