 5-Plex
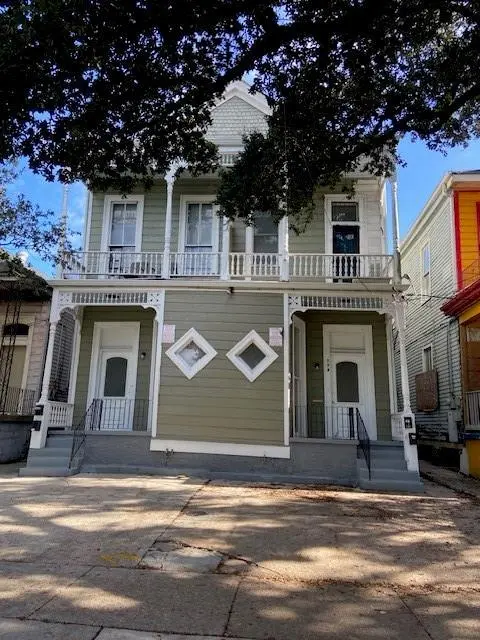
122 24 S Norman C Francis Pkwy · New Orleans, LA
Flood risk 8/10 · Major
- FEMA flood zone
- X (shaded)
- Chance of flooding over 30 yrs
- 0.76%
- Est. flood insurance / yr
- $507 – $1,088
Fire risk 1/10 · Minimal
- Est. fire insurance / yr
- $1,269 – $2,357
Heat risk 10/10 · Severe
- Hot days now (above 108°F)
- 7 days/yr
- Hot days in 30 yrs
- 21 days/yr
Wind risk 10/10 · Severe
- Chance of severe wind over 30 yrs
- 99.0%
Air-quality risk 4/10 · Minor
- Unhealthy air days now
- 4 days/yr
- Unhealthy air days in 30 yrs
- 4 days/yr
Risk factors via First Street. Map © Google.
Why this score? — see what drove the C+ grade
The composite is a weighted blend of 9 inputs, each scored 0–100. Each bar is that input's sub-score; the figure is the points it added to the 100-point composite (weight × sub-score).
- Cash flow +30.0/30.0
- 1% rule +10.0/10.0
- DSCR +10.0/10.0
- Livability +4.0/5.0
- ARV discount +3.2/15.0
- Rent growth +2.5/5.0
- Condition / age +2.5/5.0
- Schools +1.6/10.0
- Appreciation +0.0/10.0
$495,000
🖨 Deal sheet 📄 Offer letter ✓ Due diligence
Multi-family units
County records classify this as Multi-Family (5+ Unit). Listing-text estimate: 5 units. confirmed
5+ unit building — per-unit beds/baths from public records are typically unavailable; the breakdown below (if shown) is an estimate from the listing text.
Listing remarks MLS
Located just three doors away from Canal Street; this 5-unit multifamily home brings $4545 in monthly rents. Huge rooms throughout, soaring ceilings. One water meter - Owner pays water and sanitation. Tenants pays their electric and gas. Laundry hookups in attached shed - could be used as a communal laundry area.The listing broker is also part owner of the seller corporation.
Key facts
- Huge rooms
- Multifamily home
- Soaring ceilings
Tags
Neighborhood map
What this means for you Summary
Snapshot
- This is a 5 × 8-bed/6.0-bath units multifamily listed at $495k.
Deal economics
- At list price, monthly cash flow is $5k ($57k/yr) — positive. Per door: $943/mo.
- The deal already cash-flows at list — no discount required.
- Meets the 1% rule at list price ($10k rent vs $495k).
- Recommended offer: $436k (12.0% below list) — sets the bar for market timing.
- Cap rate 17.9% vs local median 4.4% in New Orleans — top-decile yield for the area; either an underpriced asset or a hidden risk that comps aren't pricing in. Stress-test before assuming the spread holds.
Location & tenants
- Location reads 81/100 on livability (#3 in LA, #1,383 nationally) — a professional / high-income tenant draw. Strengths: amenities A+, commute A+, health & safety A+; Watch: crime C-, employment D.
- Orleans Parish (urban): math 11% / reading 27% proficiency, ranked #69 of 98 in LA (top 70%) — low school quality limits family demand, transient renter base, plan for 1-2y turnover; 68% free/reduced lunch — lower-income household profile, screen leases tightly.
- Market conditions: Rents soft (-0.2%/yr); 381 active listings in the ZIP; 710 units permitted in Orleans Parish in 2024 (244 in 5+ unit buildings).
- At $10,152/mo this rent would consume 229% of the median local household income ($53k/yr) (locally 3381% of renters already pay >50% of income on rent) — very limited rent-growth headroom before tenants either downsize or default.
Forward outlook
- Local home prices are declining (-3.0%/yr); year-one equity from $3k of loan paydown is wiped out by about $15k of value loss. Plan a longer hold.
- Orleans County population projected at +61% by 2050 — long-run rental-demand tailwind backs the buy-and-hold thesis.
- At projected returns (-3.0% appreciation + 0.0% rent growth), your $139k cash investment doubles in ~4 years — after that, you're playing with house money.
Negotiation context
- It's been on market 146 days — a 12% lower offer ($436k) is reasonable based on typical stale-listing flexibility.
- 7 sale attempts since 16y ago with the ask held roughly flat each time — persistent listings suggest the price (not the market) is what's stuck; bring a comps-based counter.
- Current owner paid $160k; list at $495k implies a 209% gain — meaningful room to come down on a strong offer.
Risks & watch-outs
- Watch-outs: flood insurance adds $66/mo; built in 1920 — expect roof / HVAC / electrical / plumbing capex.
- Climate carrying-cost: severe flood risk; severe wind risk, 99% chance of damaging wind over 30y; extreme-heat days projected 7→21/yr by 2055 (HVAC capex compounding) — expect insurance premiums to compound above CPI over the hold.
Questions for the listing agent
- It's been on market 146 days. Have you received any prior offers? Is the seller open to a 12% concession, seller financing, or rate buy-down credit?
- Can we see the unit-by-unit rent roll, current vacancy, and any below-market leases? What's the average tenancy length?
- What capital expenditures (roof, boiler, parking lot, exteriors) have been made in the last 5 years, and what's planned in the next 2?
- Built in 1920 — when were the roof, HVAC, electrical panel, plumbing, and water heater last replaced?
- What's the actual annual flood-insurance premium (NFIP or private), and is the property in a SFHA with mandatory coverage?
- Why hasn't it sold? Are there any deal-killer items the seller is aware of (foundation, flood, title, zoning, code violations)?
- Is there a deadline driving the sale (1031 exchange, divorce, estate, relocation)? That informs how much negotiation room exists.
- What's the average days-on-market for RENTAL listings here right now (not sales)? A rising rental-DOM trend means longer vacancies and softer asking-rent achievability than the comps imply.
- What's the recent tenant-quality profile in this submarket — average credit score on applications, eviction rate, late-payment / NSF rate, and stable-employment percentage? A property-management company in the area should have these aggregated.
- How much new apartment / multifamily construction is in the pipeline within 1–3 miles? Heavy new supply (>2% of stock underway) typically softens rents 12–24 months out; light construction supports rent growth.
Investment metrics
- 1% rule
- 2.05% ✓
- Cap rate
- 17.88%
- Cash-on-cash
- 41.38%
- DSCR
- 2.84
- GRM
- 4.1
CMA / ARV
- ARV (median comp)
- $452,035
- List price
- $495,000
- Delta
- 9.50%
- Verdict
- FAIR
- Comps
- 20 within 1.0 mi
Projected returns pro-forma
-3.0% appreciation · 0.0% rent growth · sell at horizon
- IRR
- 33.9%
- Equity multiple
- 2.37×
- Total profit
- $190,315
- Equity at exit
- $73,806
- IRR
- 39.2%
- Equity multiple
- 4.16×
- Total profit
- $437,631
- Equity at exit
- $42,799
Cash invested: $138,600 (down + closing). Projections, not guarantees.
Landlord ↔ Tenant lean methodology
- Overall (STATE)
- 90 Strongly Landlord-Friendly
- State Louisiana
- 90 Strongly Landlord-Friendly · R+12
- County
- — inherits STATE
- City
- — inherits STATE
ZIP-level market 70119
- Home prices YoY
- -34.8%
- Rents YoY
- -0.2%
- Active inventory
- 381
- Price-to-rent
- 20.3×
Monthly cashflow live
- Estimated rent
- $10,152 medium interval (Pro) →
- Mortgage (P&I)
- −$2,596
- Tax from tax record
- −$438 /mo · $5,258/yr
- Insurance
- −$206
- Flood insurance flood zone
- −$66 /mo · $798/yr
- HOA
- −$0
- Vacancy / Maint / Mgmt
- −$2,132
- Net cashflow
- $4,713
Break-even live
5-unit breakdown (identical units grouped — click to expand)
| Units | Beds | Baths | Est. rent |
|---|---|---|---|
| 5× units | 8 | 6 | $10,150 |
| #1 | 8 | 6 | $2,030 |
| #2 | 8 | 6 | $2,030 |
| #3 | 8 | 6 | $2,030 |
| #4 | 8 | 6 | $2,030 |
| #5 | 8 | 6 | $2,030 |
| Total (5 units) | $10,152 | ||
UW: 25.0% down · 7.5% · 30yr · 1.5% tax · 5.0% vac · 8.0% maint · 8.0% mgmt
Financing live
Cash to close
- Down payment
- $123,750
- Closing costs
- $14,850
- Reserves months
- —
- Total cash needed
- —
Loan-product check · same deal, 3 products live
Conventional
25% down · 7.5% · 30yr
- Down + closing
- —
- Monthly P&I
- —
- Monthly cashflow
- —
- DSCR
- —
- Eligible?
- —
Personal DTI + credit; lowest rate.
DSCR
20% down · 8.5% · 30yr
- Down + closing
- —
- Monthly P&I
- —
- Monthly cashflow
- —
- DSCR
- —
- Eligible?
- —
No personal income docs; deal must DSCR.
Hard money
10% down · 12.0% · 12mo
- Down + closing
- —
- Monthly P&I
- —
- Monthly cashflow
- —
- DSCR
- —
- Eligible?
- —
Short-term bridge; refi at stabilization.
Listing history 26 events
-
2026-06-18days on market $495,000 Active 146 DOM
-
2026-06-17days on market $495,000 Active 145 DOM
-
2026-06-16days on market $495,000 Active 144 DOM
-
2026-06-15days on market $495,000 Active 143 DOM
-
2026-06-13days on market $495,000 Active 141 DOM
-
2026-06-10days on market $495,000 Active 138 DOM
-
2026-06-09days on market $495,000 Active 137 DOM
-
2026-06-08days on market $495,000 Active 136 DOM
-
2026-06-07days on market $495,000 Active 135 DOM
-
2026-06-05days on market $495,000 Active 132 DOM
-
2026-06-03days on market $495,000 Active 131 DOM
-
2026-06-02days on market $495,000 Active 130 DOM
-
2026-06-01days on market $495,000 Active 129 DOM
-
2026-05-31days on market $495,000 Active 128 DOM
-
2026-01-07$495,000 Active 378-char remark
Show marketing remark (379 chars)
Located just three doors away from Canal Street; this 5-unit multifamily home brings $4545 in monthly rents. Huge rooms throughout, soaring ceilings. One water meter - Owner pays water and sanitation. Tenants pays their electric and gas. Laundry hookups in attached shed - could be used as a communal laundry area. The listing broker is also part owner of the seller corporation.
-
2026-01-07$495,000 Active 379-char remark
Show marketing remark (379 chars)
Located just three doors away from Canal Street; this 5-unit multifamily home brings $4545 in monthly rents. Huge rooms throughout, soaring ceilings. One water meter - Owner pays water and sanitation. Tenants pays their electric and gas. Laundry hookups in attached shed - could be used as a communal laundry area. The listing broker is also part owner of the seller corporation.
-
2025-07-17$495,000 Active
-
2025-03-12$495,000 Active
-
2025-01-11price $495,000
-
2025-01-08price $495,000
-
2024-10-30$499,000 Active
-
2011-05-04soldstatus $160,000
-
2011-04-27soldstatus $160,000
-
2011-02-07$209,000
-
2010-08-06$225,000
-
1993-03-09soldstatus $80,000
ⓘ Source: listings_history table (triggers on properties + properties_extension) + one-shot
backfill from property_details.listing_events for pre-trigger history.
Tax reassessment forecast LA · Resets to sale price
- Current annual tax
- $5,258 · $438/mo
- Projected year-2 tax
- $5,258 · $438/mo
- Expected delta
- $0/yr ($0/mo · 0.0%)
ⓘ Screening estimate from a state-policy table — verify with the county assessor before closing.
Climate risk First Street
- Flood 8/10 Severe FEMA zone X (shaded) · 76% chance over 30 yrs
- Wildfire 1/10 Low
- Heat 10/10 Extreme 7 d/yr ≥108°F today · 21 d/yr by 30 yrs out
- Wind 10/10 Extreme 99% chance of damaging wind over 30 yrs
- Air quality 4/10 Moderate 4 unhealthy d/yr today · 4 by 30 yrs out
Nearby sold comps map
Loading sold comps map…
Walkable amenities ~0.75 mi
Loading nearby amenities…
Taxation est. · year 1
- Rental income
- $121,824
- − Mortgage interest
- −$27,728
- − Property taxes
- −$5,258
- − Insurance
- −$3,272
- − Repairs & maintenance
- −$9,746
- − Management
- −$9,746
- − Depreciation
- −$14,400
- Taxable income
- $51,673
- Est. tax owed @ 24.0%
- −$12,402
- After-tax cash flow
- $44,158/yr
For passive investors: Depreciation is non-cash, so a rental often shows a tax loss while cash-flowing — sheltering income. Rental losses are passive: they offset passive income freely, and up to $25,000/yr can offset ordinary (W-2) income if you actively participate and your MAGI is under $100k (phasing out to $0 by $150k); unused losses carry forward. On sale, claimed depreciation is recaptured at up to 25%, and gains may owe capital-gains tax (a 1031 exchange can defer both). Figures are a year-1 estimate at your 24.0% rate — not tax advice; consult a CPA.
Schools (NCES district)
- District
- Orleans Parish
- NCES district ID
- 2201170
- Math proficiency
- 11% ▼ -52.00%
- Reading proficiency
- 27% ▼ -46.00%
- Median HH income
- $37,011
- Composite
- 15.78/100
- National rank
- #9271
- State rank
- #69 of 98 in LA
Livability — New Orleans
- Score
- 81/100
- State rank
- #3
- US rank
- #1383
Category grades
Schools grade is shown separately in the Schools card above.
Census & demographics
- Census place
- New Orleans, LA
- County
- Orleans Parish · 338,817 people
- City population
- 338,817
- Metro
- New Orleans-Metairie, LA
- Population (ZIP)
- 37,253
- Household income
- $53,143
- Rent vs Own
- Severe rent burden
- 3381.0
Population outlook (Orleans County) Hauer SSP2
- Today (2025)
- 513,025 people
- By 2030
- 575,781 · +12.2%
- By 2040
- 700,174 · +36.5%
- By 2050
- 826,541 · +61.1%
- By 2075
- 1,123,374 · +119.0%
- By 2100
- 1,355,609 · +164.2%
Race, ethnicity, and origin ACS 2023
- Neighborhood character
- Diverse neighborhood (Simpson 0.64)
- Race & ethnicity
- Black 44% White 40% Two or more races 10% Hispanic / Latino 9% Asian 1%
- Hispanic origin (detail)
- Mexican 2%
- Common ancestry
- Lithuanian 8% Slovak 2% Romanian 1%
- Foreign-born
- 6% · Canada, Jamaica
- Languages at home
- 91% English-only · Spanish 6% French/Haitian/Cajun 1% Other Indo-European 0%
Political lean MEDSL · Orleans
- 2024 margin
- Solid D (+67.0) · D 82.2% · R 15.2% · Other 2.7%
- 2008→2024 swing
- +6.7pp toward D · 2008: 60.3pp · 2024: 67.0pp
- All cycles
- 2024: D+67.0 2020: D+68.2 2016: D+66.2 2012: D+62.5 2008: D+60.3
Not yet ingested
- Civics
- —
Market trends
- HPI YoY
- ▼ -135.38%
- Current HPI
- 253.1929
- Rent YoY
- ▼ -0.20%
- Metro
- New Orleans-Metairie, LA
- State GDP YoY
- ▲ 3.29%
- F500 in state
- 10
Industry mix (Fortune 500 HQ in LA)
| Industry | F500 HQs | Revenue |
|---|---|---|
| Telecommunications | 2 | $23B |
|
||
| Utilities | 1 | $12B |
|
||
| Wholesale / Distribution | 1 | $5B |
|
||
| Advertising | 1 | $2B |
|
||
Price history
+518.8% since first listed12 events — show timeline
- 2026-01-07 Listed $495,000 GSREIN
- 2026-01-07 Listed $495,000 AcadianaMLS
- 2025-07-17 Listed $495,000 AcadianaMLS
- 2025-03-12 Listed $495,000 AcadianaMLS
- 2025-01-11 Price Changed $495,000 AcadianaMLS
- 2025-01-08 Price Changed $495,000 GSREIN
- 2024-10-30 Listed $499,000 AcadianaMLS
- 2011-05-04 Sold (Public Records) $160,000 Public Records
- 2011-04-27 Sold (MLS) $160,000 GSREIN
- 2011-02-07 Listed $209,000 GSREIN
- 2010-08-06 Listed $225,000 GSREIN
- 1993-03-09 Sold (Public Records) $80,000 Public Records
Property tax history
+2.3%/yrLatest (2026): $5,258 · +1.0% YoY. Source: county tax records.
Cash-flow waterfall
monthlySold comps — $/sqft
last 12 mo · ≤1 miLoading sold comps…