 Multi-family
980 Sutter Ave · New York, NY
Flood risk No data
- FEMA flood zone
- —
- Chance of flooding over 30 yrs
- —
- Est. flood insurance / yr
- —
Fire risk No data
- Est. fire insurance / yr
- —
Heat risk No data
- Hot days now (above threshold)
- —
- Hot days in 30 yrs
- —
Wind risk No data
- Chance of severe wind over 30 yrs
- —
Air-quality risk No data
- Unhealthy air days now
- —
- Unhealthy air days in 30 yrs
- —
Risk factors via First Street. Map © Google.
Why this score? — see what drove the D+ grade
The composite is a weighted blend of 9 inputs, each scored 0–100. Each bar is that input's sub-score; the figure is the points it added to the 100-point composite (weight × sub-score).
- Cash flow +18.5/30.0
- DSCR +5.8/10.0
- 1% rule +5.0/10.0
- Schools +5.0/10.0
- Rent growth +4.0/5.0
- Livability +3.8/5.0
- Condition / age +3.8/5.0
- ARV discount +0.0/15.0
- Appreciation +0.0/10.0
$1,299,999
🖨 Deal sheet 📄 Offer letter ✓ Due diligence
Multi-family units
County records classify this as Multi-Family (5+ Unit). Listing-text estimate: 1 unit. estimate disagrees with records
5+ unit building — per-unit beds/baths from public records are typically unavailable; the breakdown below (if shown) is an estimate from the listing text.
Listing remarks
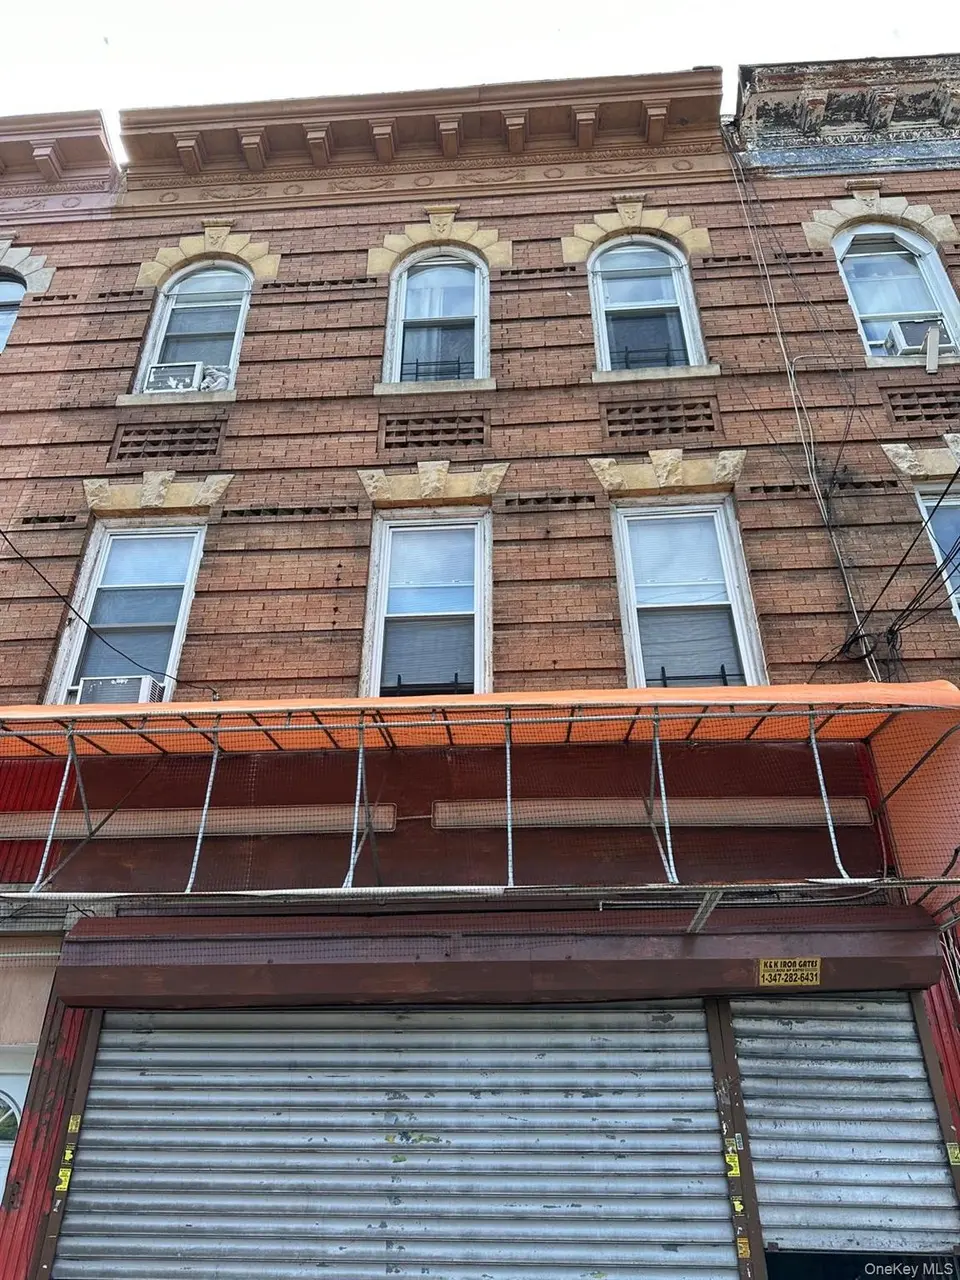
This meticulously maintained mixed-use building offers the perfect blend of stable rental income and business potential. Featuring a vacant ground-floor retail storefront and two well maintained apartments above, this property is ideal for investors and owner-users alike. Both residential units have been tastefully updated, showcasing white shaker cabinetry, hardwood flooring, and modern tile bathrooms. Each unit is separately metered for gas and electric, giving tenants full control over their utilities and simplifying management. Situated in a highly accessible location, this property offers excellent exposure for retail and easy commuting for residents. Just minutes from major public tra
Key facts
- Hardwood flooring
- Mixed-use building
- 1,500 sq ft lot
Tags
Property features AI
Exterior
- Parking: On-street parking
- Utilities: Public sewer; Electricity connected; Natural gas connected
- Home design: Duplex; Total building area approximately 2,640 sq ft (per public records)
- Construction: Brick construction
- Exterior features: Brick exterior; Not waterfront
Interior
- Bedrooms: Two 3-bedroom units
- Bathrooms: Two full bathrooms
- Heating & cooling: Heating: See remarks / Other; Cooling varies by unit
- Interior features: Other interior features; Basement present (see remarks)
Neighborhood map
What this means for you Summary
Snapshot
- This is a 6-bed/2.0-bath multifamily listed at $1.30M. Condition is rated good.
Deal economics
- At list price, monthly cash flow is $1k ($15k/yr) — positive.
- The deal already cash-flows at list — no discount required.
- To meet the 1% rule (rent ≥ 1% of price), the offer needs to be $1.29M (0.5% below list).
- Recommended offer: $1.28M (1.5% below list) — sets the bar for market timing.
- Cap rate 7.4% vs local median 2.6% in New York — top-decile yield for the area; either an underpriced asset or a hidden risk that comps aren't pricing in. Stress-test before assuming the spread holds.
Location & tenants
- Location reads 75/100 on livability (#268 in NY, #4,188 nationally) — a middle-class / working-renter tenant base. Strengths: amenities A+, commute A+, health & safety A; Watch: crime F, cost of living F.
- Market conditions: Rents rising fast (+6.1%/yr); 192 active listings in the ZIP; 10,063 units permitted in Kings County in 2024 (9,789 in 5+ unit buildings).
- At $12,941/mo this rent would consume 250% of the median local household income ($62k/yr) (locally 7574% of renters already pay >50% of income on rent) — very limited rent-growth headroom before tenants either downsize or default.
Forward outlook
- Local home prices are declining (-3.0%/yr); year-one equity from $9k of loan paydown is wiped out by about $39k of value loss. Plan a longer hold.
- Kings County population projected at +13% by 2050 — modest demand growth; plan on rents tracking national, not racing it.
Negotiation context
- It's been on market 15 days — a 2% lower offer ($1.28M) is reasonable based on typical stale-listing flexibility.
Risks & watch-outs
- Watch-outs: built in 1925 — expect roof / HVAC / electrical / plumbing capex.
Questions for the listing agent
- Built in 1925 — when were the roof, HVAC, electrical panel, plumbing, and water heater last replaced?
- Is there a deadline driving the sale (1031 exchange, divorce, estate, relocation)? That informs how much negotiation room exists.
- Schools are B-rated — typically a magnet for longer-tenancy family renters. What's the average tenant stay here, and is there a school-zone premium baked into asking?
- Crime grade is F in this area — have there been break-ins, vandalism, or insurance claims at this property in the last 3 years? What carrier currently insures it and at what premium?
- The area grade is low — what's the realistic commute time and amenity access for the typical tenant pool here? Any planned neighborhood developments (good or bad) we should know about?
- What's the average days-on-market for RENTAL listings here right now (not sales)? A rising rental-DOM trend means longer vacancies and softer asking-rent achievability than the comps imply.
- What's the recent tenant-quality profile in this submarket — average credit score on applications, eviction rate, late-payment / NSF rate, and stable-employment percentage? A property-management company in the area should have these aggregated.
- How much new apartment / multifamily construction is in the pipeline within 1–3 miles? Heavy new supply (>2% of stock underway) typically softens rents 12–24 months out; light construction supports rent growth.
Investment metrics
- 1% rule
- 1.00% ✗
- Cap rate
- 7.44%
- Cash-on-cash
- 4.09%
- DSCR
- 1.18
- GRM
- 8.4
CMA / ARV
- ARV (on-the-fly)
- $1,042,800
- Comps found
- 11
Show comp detail 11 sales within ~0.75 mi
| Address | Dist | Beds/Ba | Sqft | Sold | Price | $/sf | Match |
|---|---|---|---|---|---|---|---|
| 762 Belmont Ave | 0.11mi | 7/3.0 (+1) | 2,520 (-4%) | 7mo | $1,140,000 | $452 | 72 |
| 852 Glenmore Ave | 0.37mi | 6/3.0 | 2,484 (-6%) | 1mo | $995,000 | $401 | 68 |
| 982 Dumont Ave | 0.22mi | 6/3.0 | 2,452 (-7%) | 9mo | $847,390 | $346 | 67 |
| 346 Van Siclen Ave | 0.40mi | 5/3.0 (-1) | 2,700 (+2%) | 6mo | $1,090,740 | $404 | 63 |
| 471 Shepherd Ave | 0.18mi | 5/3.5 (-1) | 2,800 (+6%) | 20mo | $989,000 | $353 | 54 |
| 700 Bradford St | 0.73mi | 6/4.0 | 2,646 (+0%) | 7mo | $850,000 | $321 | 51 |
| 807 Barbey | 0.58mi | 6/3.0 | 2,400 (-9%) | 3mo | $1,100,000 | $458 | 51 |
| 95 Wyona St | 0.74mi | 5/3.0 (-1) | 2,712 (+3%) | 8mo | $1,070,000 | $395 | 46 |
| 919 Dumont Ave | 0.25mi | 7/4.0 (+1) | 2,320 (-12%) | 18mo | $1,050,000 | $453 | 41 |
| 504 Vermont St | 0.62mi | 5/3.0 (-1) | 3,000 (+14%) | 3mo | $810,000 | $270 | 37 |
| 637 Blake Ave | 0.71mi | 5/3.0 (-1) | 2,922 (+11%) | 4mo | $935,000 | $320 | 37 |
Match score weights: distance 35% · size 25% · config 20% · recency 20%. Top-matched comps best support the ARV.
Projected returns pro-forma
-3.0% appreciation · 6.14% rent growth · sell at horizon
- IRR
- -6.4%
- Equity multiple
- 0.75×
- Total profit
- $-89,353
- Equity at exit
- $193,834
- IRR
- 6.7%
- Equity multiple
- 1.57×
- Total profit
- $209,213
- Equity at exit
- $112,400
Cash invested: $364,000 (down + closing). Projections, not guarantees.
Landlord ↔ Tenant lean methodology
- Overall (CITY)
- 0 Strongly Tenant-Friendly
- State New York
- 15 Strongly Tenant-Friendly · D+10
- County
- — inherits STATE
- City New York
- 0 Strongly Tenant-Friendly · D+34
ZIP-level market 11208
- Rents YoY
- 6.1%
- Active inventory
- 192
- Price-to-rent
- 41.9×
Monthly cashflow live
- Estimated rent
- $12,941 medium interval (Pro) →
- Mortgage (P&I)
- −$6,817
- Tax est. 1.5%
- −$1,625 /mo · $19,500/yr
- Insurance
- −$542
- HOA
- −$0
- Vacancy / Maint / Mgmt
- −$2,718
- Net cashflow
- $1,239
Break-even live
5-unit breakdown (identical units grouped — click to expand)
| Units | Beds | Baths | Est. rent |
|---|---|---|---|
| 5× units | 2 | 1 | $12,940 |
| #1 | 2 | 1 | $2,588 |
| #2 | 2 | 1 | $2,588 |
| #3 | 2 | 1 | $2,588 |
| #4 | 2 | 1 | $2,588 |
| #5 | 2 | 1 | $2,588 |
| Total (5 units) | $12,941 | ||
UW: 25.0% down · 7.5% · 30yr · 1.5% tax · 5.0% vac · 8.0% maint · 8.0% mgmt
Financing live
Cash to close
- Down payment
- $325,000
- Closing costs
- $39,000
- Reserves months
- —
- Total cash needed
- —
Loan-product check · same deal, 3 products live
Conventional
25% down · 7.5% · 30yr
- Down + closing
- —
- Monthly P&I
- —
- Monthly cashflow
- —
- DSCR
- —
- Eligible?
- —
Personal DTI + credit; lowest rate.
DSCR
20% down · 8.5% · 30yr
- Down + closing
- —
- Monthly P&I
- —
- Monthly cashflow
- —
- DSCR
- —
- Eligible?
- —
No personal income docs; deal must DSCR.
Hard money
10% down · 12.0% · 12mo
- Down + closing
- —
- Monthly P&I
- —
- Monthly cashflow
- —
- DSCR
- —
- Eligible?
- —
Short-term bridge; refi at stabilization.
Listing history 10 events
-
2026-06-18days on market $1,299,999 Active 15 DOM
-
2026-06-17days on market $1,299,999 Active 14 DOM
-
2026-06-16days on market $1,299,999 Active 13 DOM
-
2026-06-15days on market $1,299,999 Active 12 DOM
-
2026-06-13days on market $1,299,999 Active 10 DOM
-
2026-06-09days on market $1,299,999 Active 6 DOM
-
2026-06-08days on market $1,299,999 Active 5 DOM
-
2026-06-08days on market $1,299,999 Active 4 DOM
-
2026-06-04remarks 699-char remark
-
2026-06-04$1,299,999 Active 1 DOM
ⓘ Source: listings_history table (triggers on properties + properties_extension) + one-shot
backfill from property_details.listing_events for pre-trigger history.
Nearby sold comps map
Loading sold comps map…
Walkable amenities ~0.75 mi
Loading nearby amenities…
Taxation est. · year 1
- Rental income
- $155,292
- − Mortgage interest
- −$72,820
- − Property taxes
- −$19,500
- − Insurance
- −$6,500
- − Repairs & maintenance
- −$12,423
- − Management
- −$12,423
- − Depreciation
- −$37,818
- Taxable loss
- −$6,193
- Est. tax savings @ 24.0%
- +$1,486
- After-tax cash flow
- $16,359/yr
For passive investors: Depreciation is non-cash, so a rental often shows a tax loss while cash-flowing — sheltering income. Rental losses are passive: they offset passive income freely, and up to $25,000/yr can offset ordinary (W-2) income if you actively participate and your MAGI is under $100k (phasing out to $0 by $150k); unused losses carry forward. On sale, claimed depreciation is recaptured at up to 25%, and gains may owe capital-gains tax (a 1031 exchange can defer both). Figures are a year-1 estimate at your 24.0% rate — not tax advice; consult a CPA.
Condition & rehab AI · 13 photos
This well-maintained mixed-use building offers a balance of stable rental income and business potential. The two apartments are tastefully updated with modern finishes and separate utility meters, making it ideal for investors and owner-users.
Value-add opportunities
- Both Paint exterior — Enhances curb appeal and property value
- Both Replace awnings — Improves aesthetics and functionality
- Both Upgrade lighting — Enhances safety and property value
Renovation cost estimate screening
Value-add ROI direction
- Both Paint exterior — Enhances curb appeal and property value ↑
- Both Replace awnings — Improves aesthetics and functionality ↑
- Both Upgrade lighting — Enhances safety and property value ↑
ⓘ Cost ranges are severity-bucket heuristics (US national rule-of-thumb). Get contractor quotes + a written scope before underwriting a rehab budget.
Schools (NCES district)
No district data.
Livability — New York
- Score
- 75/100
- State rank
- #268
- US rank
- #4188
Category grades
Schools grade is shown separately in the Schools card above.
Census & demographics
- Census place
- New York, NY
- County
- Kings County · 2,614,986 people
- City population
- 7,731,280
- Metro
- New York-Newark-Jersey City, NY-NJ-PA
- Population (ZIP)
- 105,428
- Household income
- $62,077
- Rent vs Own
- Severe rent burden
- 7574.0
Population outlook (Kings County) Hauer SSP2
- Today (2025)
- 2,847,441 people
- By 2030
- 2,937,006 · +3.1%
- By 2040
- 3,095,491 · +8.7%
- By 2050
- 3,228,968 · +13.4%
- By 2075
- 3,321,723 · +16.7%
- By 2100
- 3,111,387 · +9.3%
Race, ethnicity, and origin ACS 2023
- Neighborhood character
- Diverse neighborhood (Simpson 0.66)
- Race & ethnicity
- Black 42% Hispanic / Latino 39% Asian 10% Two or more races 8% White 3%
- Hispanic origin (detail)
- Mexican 2% Puerto Rican 9% Dominican 16%
- Common ancestry
- Hispanic 1%
- Foreign-born
- 40% · Canada, China, Mexico
- Languages at home
- 48% English-only · Spanish 36% Other Indo-European 11% French/Haitian/Cajun 1%
Political lean MEDSL · Kings
- 2024 margin
- Solid D (+44.0) · D 72.0% · R 28.0%
- 2008→2024 swing
- -15.5pp toward R · 2008: 59.4pp · 2024: 44.0pp
- All cycles
- 2024: D+44.0 2020: D+54.8 2016: D+61.8 2012: D+63.9 2008: D+59.4
Not yet ingested
- Civics
- —
Market trends
- HPI YoY
- ▼ -546.38%
- Current HPI
- 376.1489
- Rent YoY
- ▲ 6.14%
- Metro
- New York-Newark-Jersey City, NY-NJ-PA
- State GDP YoY
- ▲ 2.60%
- F500 in state
- 92
Industry mix (Fortune 500 HQ in NY)
| Industry | F500 HQs | Revenue |
|---|---|---|
| Financial Services | 10 | $950B |
|
||
| Consumer Goods | 9 | $162B |
|
||
| Insurance | 4 | $225B |
|
||
| Telecommunications | 2 | $144B |
|
||
| Pharmaceuticals | 2 | $112B |
|
||
| Media / Entertainment | 2 | $69B |
|
||
Price history
2 events — show timeline
- 2026-06-03 Listed $1,299,999 OneKey® MLS as Distributed by MLS Grid
- 2022-11-23 Rental Removed — RENT.
Cash-flow waterfall
monthlySold comps — $/sqft
last 12 mo · ≤1 miLoading sold comps…