86 Ashfield Rd · Williamsburg, MA
Flood risk 10/10 · Severe
- FEMA flood zone
- X
- Chance of flooding over 30 yrs
- 0.99%
- Est. flood insurance / yr
- $507 – $1,088
Fire risk 3/10 · Minor
- Est. fire insurance / yr
- $915 – $1,699
Heat risk 2/10 · Minimal
- Hot days now (above 93°F)
- 7 days/yr
- Hot days in 30 yrs
- 17 days/yr
Wind risk 4/10 · Minor
- Chance of severe wind over 30 yrs
- 15.0%
Air-quality risk 2/10 · Minimal
- Unhealthy air days now
- 1 days/yr
- Unhealthy air days in 30 yrs
- 1 days/yr
Risk factors via First Street. Map © Google.
Why this score? — see what drove the B- grade
The composite is a weighted blend of 9 inputs, each scored 0–100. Each bar is that input's sub-score; the figure is the points it added to the 100-point composite (weight × sub-score).
- Cash flow +18.0/30.0
- ARV discount +15.0/15.0
- Appreciation +10.0/10.0
- DSCR +5.6/10.0
- 1% rule +5.1/10.0
- Schools +4.2/10.0
- Rent growth +2.5/5.0
- Livability +2.5/5.0
- Condition / age +2.5/5.0
$160,000
🖨 Deal sheet 📄 Offer letter ✓ Due diligence
Listing remarks MLS
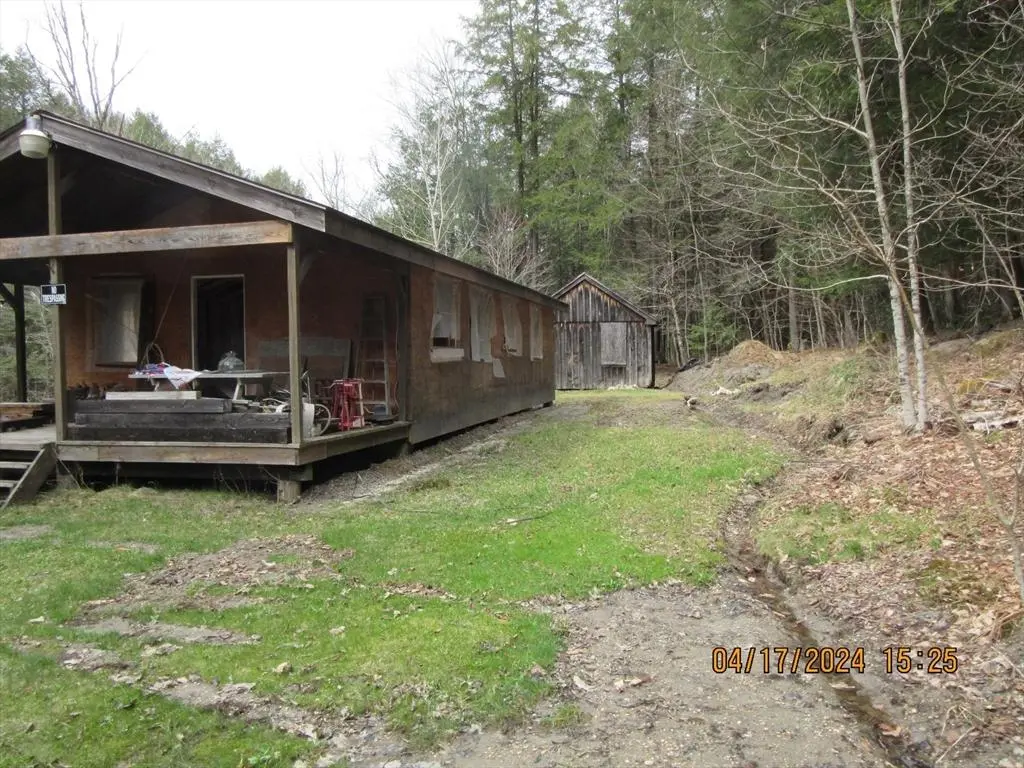
2.7+/- Acres of land with a stream running right along the front of it. Very peaceful, great location for campsite or for someone to make this lot a year round home. This property will need much work to make inhabitable and the right buyer to make it a HOME. Title V inspection is Fail, bridge connecting house to main road is in disrepair and will need work done to be able to use safely. BRIDGE MAY BE UNSAFE--- EXTREME CAUTION SHOULD BE USED IF CROSSING!!! ALL INDIVIDUALS USING BRIDGE DO SO AT THEIR OWN RISK!!
Key facts
- 2.73 acre lot
- 2 parking spots
- Built 1966
Property features AI
Finance
- Other: Lot size approximately 2.73 acres; Property is listed as active
- HOA & community: Community has public transportation, shopping, tennis courts, parks, walk/jog trails, golf, medical facility, house of worship, and public school access; Not a senior community
Exterior
- Parking: 2 open parking spaces (total 2)
- Utilities: Private water source
- Home design: Single-family residence; One-story (above grade finished area 738); Year built from public records
- Construction: Frame construction; Shingle roof; Above grade finished area 738
- Exterior features: Deck with roof; Waterfront property with stream/river/creek; Wooded, sloped lot
Interior
- Flooring: Plywood
- Bathrooms: 1 full bathroom
- Heating & cooling: Heating present (type: other); Cooling present (type: other)
- Interior features: 6 total rooms; Plywood flooring; Crawl space basement; Other interior features
- Laundry & utility: Water heater; Other appliances
Neighborhood map
What this means for you Summary
Snapshot
- This is a 1-bed/1.0-bath single-family listed at $160k.
Deal economics
- At list price, monthly cash flow is $71 ($855/yr) — positive.
- The deal already cash-flows at list — no discount required.
- Meets the 1% rule at list price ($2k rent vs $160k).
- Recommended offer: $158k (1.5% below list) — sets the bar for market timing.
Location & tenants
- Location reads: area grade B — affects rentability + tenant quality, not the cash-flow math above.
- Williamsburg (rural): math 35% / reading 55% proficiency, ranked #271 of 371 in MA (top 73%) — families likely to look elsewhere, expect single-tenant / working-renter base with shorter leases; only 18% free/reduced lunch — higher-income household profile.
- Market conditions: 2 active listings in the ZIP; 349 units permitted in Hampshire County in 2024 (185 in 5+ unit buildings).
Forward outlook
- In year one you build about $17k of equity ($1k loan paydown + $16k appreciation (10.0% local appreciation)).
- Hampshire County population projected at +5% by 2050 — modest demand growth; plan on rents tracking national, not racing it.
- At projected returns (10.0% appreciation + 3.0% rent growth), your $45k cash investment doubles in ~3 years — after that, you're playing with house money.
- By year 3, paydown + projected appreciation supports a ~$43k cash-out refi (75% LTV) — recoverable capital for the next deal without selling this one.
Negotiation context
- It's been on market 23 days — a 2% lower offer ($158k) is reasonable based on typical stale-listing flexibility.
- 2 sale attempts since 9y ago with the ask held roughly flat each time — persistent listings suggest the price (not the market) is what's stuck; bring a comps-based counter.
- Current owner paid $25k; list at $160k implies a 540% gain — meaningful room to come down on a strong offer.
Risks & watch-outs
- Watch-outs: flood insurance adds $66/mo.
- Climate carrying-cost: severe flood risk — expect insurance premiums to compound above CPI over the hold.
Questions for the listing agent
- Built in 1966 — when were the roof, HVAC, electrical panel, plumbing, and water heater last replaced?
- What's the actual annual flood-insurance premium (NFIP or private), and is the property in a SFHA with mandatory coverage?
- Is there a deadline driving the sale (1031 exchange, divorce, estate, relocation)? That informs how much negotiation room exists.
- What's the average days-on-market for RENTAL listings here right now (not sales)? A rising rental-DOM trend means longer vacancies and softer asking-rent achievability than the comps imply.
- What's the recent tenant-quality profile in this submarket — average credit score on applications, eviction rate, late-payment / NSF rate, and stable-employment percentage? A property-management company in the area should have these aggregated.
- How much new for-sale + rental construction is in the pipeline within 1–3 miles? Heavy new supply typically softens prices + rents 12–24 months out; constrained supply supports both.
Investment metrics
- 1% rule
- 1.01% ✓
- Cap rate
- 7.33%
- Cash-on-cash
- 3.69%
- DSCR
- 1.16
- GRM
- 8.2
CMA / ARV
- ARV (on-the-fly)
- $318,960
- Comps found
- 1
Show comp detail 1 sale within ~0.75 mi
| Address | Dist | Beds/Ba | Sqft | Sold | Price | $/sf | Match |
|---|---|---|---|---|---|---|---|
| 146 Ashfield Rd | 0.50mi | 2/1.0 (+1) | 768 (+7%) | 18mo | $340,000 | $443 | 45 |
Match score weights: distance 35% · size 25% · config 20% · recency 20%. Top-matched comps best support the ARV.
Projected returns pro-forma
10.0% appreciation · 3.0% rent growth · sell at horizon
- IRR
- 25.7%
- Equity multiple
- 3.05×
- Total profit
- $91,766
- Equity at exit
- $144,141
- IRR
- 22.6%
- Equity multiple
- 6.96×
- Total profit
- $266,836
- Equity at exit
- $310,845
Cash invested: $44,800 (down + closing). Projections, not guarantees.
Landlord ↔ Tenant lean methodology
- Overall (STATE)
- 20 Strongly Tenant-Friendly
- State Massachusetts
- 20 Strongly Tenant-Friendly · D+15
- County
- — inherits STATE
- City
- — inherits STATE
ZIP-level market 01096
- Home prices YoY
- 8.3%
- Active inventory
- 2
- Price-to-rent
- 8.2×
Monthly cashflow live
- Estimated rent
- $1,617 medium interval (Pro) →
- Mortgage (P&I)
- −$839
- Tax from tax record
- −$234 /mo · $2,803/yr
- Insurance
- −$67
- Flood insurance flood zone
- −$66 /mo · $798/yr
- HOA
- −$0
- Vacancy / Maint / Mgmt
- −$339
- Net cashflow
- $71
Break-even live
UW: 25.0% down · 7.5% · 30yr · 1.5% tax · 5.0% vac · 8.0% maint · 8.0% mgmt
Financing live
Cash to close
- Down payment
- $40,000
- Closing costs
- $4,800
- Reserves months
- —
- Total cash needed
- —
Loan-product check · same deal, 3 products live
Conventional
25% down · 7.5% · 30yr
- Down + closing
- —
- Monthly P&I
- —
- Monthly cashflow
- —
- DSCR
- —
- Eligible?
- —
Personal DTI + credit; lowest rate.
DSCR
20% down · 8.5% · 30yr
- Down + closing
- —
- Monthly P&I
- —
- Monthly cashflow
- —
- DSCR
- —
- Eligible?
- —
No personal income docs; deal must DSCR.
Hard money
10% down · 12.0% · 12mo
- Down + closing
- —
- Monthly P&I
- —
- Monthly cashflow
- —
- DSCR
- —
- Eligible?
- —
Short-term bridge; refi at stabilization.
Listing history 20 events
-
2026-06-18days on market $160,000 Active 23 DOM
-
2026-06-17days on market $160,000 Active 22 DOM
-
2026-06-16days on market $160,000 Active 21 DOM
-
2026-06-15days on market $160,000 Active 20 DOM
-
2026-06-13days on market $160,000 Active 18 DOM
-
2026-06-12days on market $160,000 Active 17 DOM
-
2026-06-10days on market $160,000 Active 15 DOM
-
2026-06-09days on market $160,000 Active 14 DOM
-
2026-06-08days on market $160,000 Active 13 DOM
-
2026-06-07days on market $160,000 Active 12 DOM
-
2026-06-05days on market $160,000 Active 10 DOM
-
2026-06-03days on market $160,000 Active 8 DOM
-
2026-06-02days on market $160,000 Active 7 DOM
-
2026-06-01days on market $160,000 Active 6 DOM
-
2026-05-31days on market $160,000 Active 5 DOM
-
2026-05-30statusdays on market $160,000 Active 4 DOM
-
2026-05-26$160,000 Price Changed
-
2017-05-24soldstatus $25,000 516-char remark
Show marketing remark (516 chars)
2.7+/- Acres of land with a stream running right along the front of it. Very peaceful, great location for campsite or for someone to make this lot a year round home. This property will need much work to make inhabitable and the right buyer to make it a HOME. Title V inspection is Fail, bridge connecting house to main road is in disrepair and will need work done to be able to use safely. BRIDGE MAY BE UNSAFE--- EXTREME CAUTION SHOULD BE USED IF CROSSING!!! ALL INDIVIDUALS USING BRIDGE DO SO AT THEIR OWN RISK!!
-
2017-04-25$21,999 516-char remark
Show marketing remark (516 chars)
2.7+/- Acres of land with a stream running right along the front of it. Very peaceful, great location for campsite or for someone to make this lot a year round home. This property will need much work to make inhabitable and the right buyer to make it a HOME. Title V inspection is Fail, bridge connecting house to main road is in disrepair and will need work done to be able to use safely. BRIDGE MAY BE UNSAFE--- EXTREME CAUTION SHOULD BE USED IF CROSSING!!! ALL INDIVIDUALS USING BRIDGE DO SO AT THEIR OWN RISK!!
-
2007-08-31soldstatus $50,000
ⓘ Source: listings_history table (triggers on properties + properties_extension) + one-shot
backfill from property_details.listing_events for pre-trigger history.
Tax reassessment forecast MA · Partial reset (capped growth)
- Current annual tax
- $2,803 · $234/mo
- Projected year-2 tax
- $2,803 · $234/mo
- Expected delta
- $0/yr ($0/mo · 0.0%)
ⓘ Screening estimate from a state-policy table — verify with the county assessor before closing.
Climate risk First Street
- Flood 10/10 Extreme FEMA zone X · 99% chance over 30 yrs
- Wildfire 3/10 Moderate
- Heat 2/10 Low 7 d/yr ≥93°F today · 17 d/yr by 30 yrs out
- Wind 4/10 Moderate 15% chance of damaging wind over 30 yrs
- Air quality 2/10 Low 1 unhealthy d/yr today · 1 by 30 yrs out
Nearby sold comps map
Loading sold comps map…
Walkable amenities ~0.75 mi
Loading nearby amenities…
Taxation est. · year 1
- Rental income
- $19,398
- − Mortgage interest
- −$8,962
- − Property taxes
- −$2,803
- − Insurance
- −$1,598
- − Repairs & maintenance
- −$1,552
- − Management
- −$1,552
- − Depreciation
- −$4,655
- Taxable loss
- −$1,723
- Est. tax savings @ 24.0%
- +$414
- After-tax cash flow
- $1,269/yr
For passive investors: Depreciation is non-cash, so a rental often shows a tax loss while cash-flowing — sheltering income. Rental losses are passive: they offset passive income freely, and up to $25,000/yr can offset ordinary (W-2) income if you actively participate and your MAGI is under $100k (phasing out to $0 by $150k); unused losses carry forward. On sale, claimed depreciation is recaptured at up to 25%, and gains may owe capital-gains tax (a 1031 exchange can defer both). Figures are a year-1 estimate at your 24.0% rate — not tax advice; consult a CPA.
Schools (NCES district)
- District
- Williamsburg
- NCES district ID
- 2512990
- Math proficiency
- 35% ▬ 0.00%
- Reading proficiency
- 55% ▲ 5.00%
- Median HH income
- $66,104
- Composite
- 42.36/100
- National rank
- #6934
- State rank
- #271 of 371 in MA
Livability — Williamsburg
No livability data for this city. (Only ~50 U.S. cities are tracked.)
Census & demographics
- Population (ZIP)
- 2,566
Population outlook (Hampshire County) Hauer SSP2
- Today (2025)
- 166,577 people
- By 2030
- 168,928 · +1.4%
- By 2040
- 171,197 · +2.8%
- By 2050
- 175,542 · +5.4%
- By 2075
- 199,884 · +20.0%
- By 2100
- 211,819 · +27.2%
Race, ethnicity, and origin ACS 2023
- Neighborhood character
- Predominantly White (91%)
- Race & ethnicity
- White 91% Two or more races 5% Asian 2% Hispanic / Latino 2%
- Common ancestry
- Romanian 13% Lithuanian 11% Slovak 3%
- Foreign-born
- 5% · China, Canada
- Languages at home
- 95% English-only · Spanish 2% Other Indo-European 1% French/Haitian/Cajun 1%
Political lean MEDSL · Hampshire
- 2024 margin
- Solid D (+41.9) · D 69.5% · R 27.6% · Other 2.9%
- 2008→2024 swing
- -3.6pp toward R · 2008: 45.6pp · 2024: 41.9pp
- All cycles
- 2024: D+41.9 2020: D+46.8 2016: D+39.5 2012: D+43.8 2008: D+45.6
Not yet ingested
- Civics
- —
Market trends
- HPI YoY
- ▲ 19.50%
- Current HPI
- 255.4604
- Rent YoY
- —
- Metro
- —
- State GDP YoY
- ▲ 2.28%
- F500 in state
- 38
Industry mix (Fortune 500 HQ in MA)
| Industry | F500 HQs | Revenue |
|---|---|---|
| Technology | 3 | $17B |
|
||
| Insurance | 2 | $84B |
|
||
| Retail | 2 | $76B |
|
||
| Life Sciences | 1 | $43B |
|
||
| Energy Technology | 1 | $31B |
|
||
| Aerospace / Defense | 1 | $18B |
|
||
Price history
+220.0% since first listed4 events — show timeline
- 2026-05-26 Listed $160,000 MLS PIN
- 2017-05-24 Sold (MLS) $25,000 MLS PIN
- 2017-04-25 Listed $21,999 MLS PIN
- 2007-08-31 Sold (Public Records) $50,000 Public Records
Property tax history
+2.5%/yrLatest (2023): $2,803 · +15.1% YoY. Source: county tax records.
Cash-flow waterfall
monthlySold comps — $/sqft
last 12 mo · ≤1 miLoading sold comps…