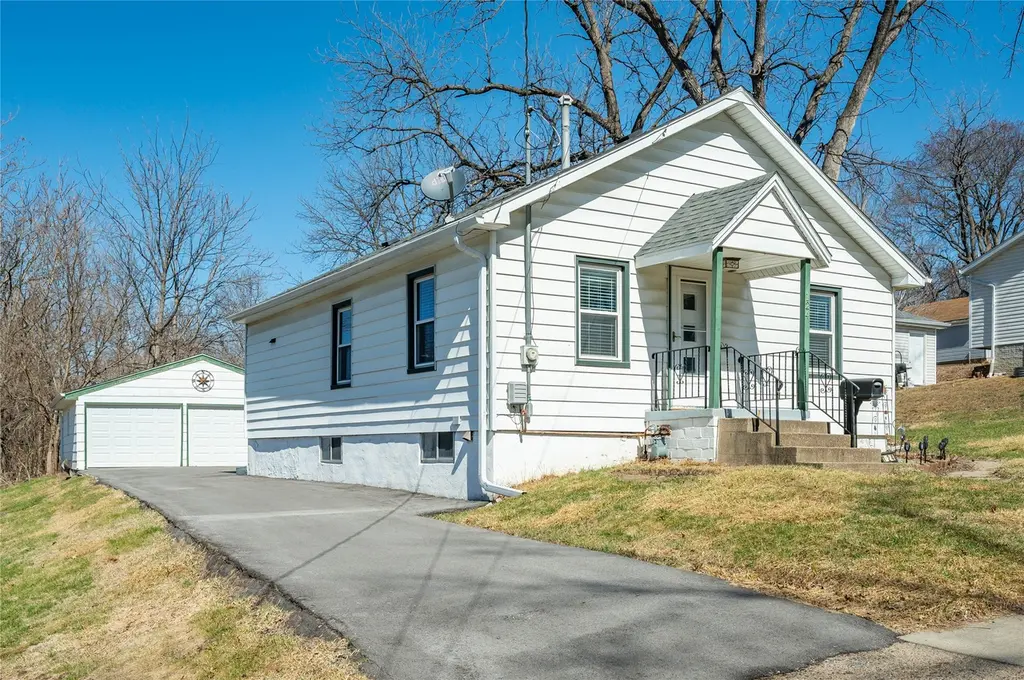
124 E Bell Ave · Des Moines, IA
Flood risk 1/10 · Minimal
- FEMA flood zone
- X (unshaded)
- Chance of flooding over 30 yrs
- 0.0%
- Est. flood insurance / yr
- $473 – $860
Fire risk 1/10 · Minimal
- Est. fire insurance / yr
- $902 – $1,676
Heat risk 3/10 · Minor
- Hot days now (above 103°F)
- 7 days/yr
- Hot days in 30 yrs
- 15 days/yr
Wind risk 2/10 · Minimal
- Chance of severe wind over 30 yrs
- —
Air-quality risk 2/10 · Minimal
- Unhealthy air days now
- 1 days/yr
- Unhealthy air days in 30 yrs
- 2 days/yr
Risk factors via First Street. Map © Google.
Why this score? — see what drove the D grade
The composite is a weighted blend of 9 inputs, each scored 0–100. Each bar is that input's sub-score; the figure is the points it added to the 100-point composite (weight × sub-score).
- ARV discount +15.0/15.0
- Cash flow +8.2/30.0
- Livability +4.0/5.0
- Schools +3.8/10.0
- Rent growth +3.4/5.0
- 1% rule +2.5/10.0
- Condition / age +2.5/5.0
- DSCR +2.2/10.0
- Appreciation +0.0/10.0
$155,000
🖨 Deal sheet 📄 Offer letter ✓ Due diligence
Listing remarks MLS
Nice south side gem features 2 beds, 1 bath, over 800 SF, an oversized 2 car garage and sets on over half an acre lot. Home is in solid condition. Big ticket items such as HVAC, roof, windows, carpet and asphalt driveway all done within the last several years. Conveniently located a few minutes from downtown, I-235 and all other amenities. Perfect starter home, come check it out!
Key facts
- 0.61 acre lot
- 2 garage spots
- Built 1908
Tags
Neighborhood map
What this means for you Summary
Snapshot
- This is a 2-bed/1.0-bath single-family listed at $155k.
Deal economics
- At list price, monthly cash flow is $-144 ($-2k/yr) — negative.
- To cash-flow at today's rent, offer at most $130k (16.4% below list).
- To meet the 1% rule (rent ≥ 1% of price), the offer needs to be $117k (24.6% below list).
- Recommended offer: $117k (24.6% below list) — sets the bar for 1% rule.
- Cap rate 5.2% vs local median 3.1% in Des Moines — top-decile yield for the area; either an underpriced asset or a hidden risk that comps aren't pricing in. Stress-test before assuming the spread holds.
Location & tenants
- Location reads 81/100 on livability (#63 in IA, #1,432 nationally) — a professional / high-income tenant draw. Strengths: commute A+, cost of living A+, housing A+; Watch: employment C-, schools D+, crime F.
- Des Moines Independent Community School District (urban): math 43% / reading 46% proficiency, ranked #289 of 289 in IA (top 100%) — families likely to look elsewhere, expect single-tenant / working-renter base with shorter leases; 63% free/reduced lunch — lower-income household profile, screen leases tightly.
- Market conditions: Rents rising (+3.5%/yr); 227 active listings in the ZIP; 38 comparable units currently listed for rent nearby; rentals at typical pace (median 24d on market — plan ~3-4 weeks tenant-placement turnaround); 2,953 units permitted in Polk County in 2024 (540 in 5+ unit buildings).
Forward outlook
- Local home prices are declining (-3.0%/yr); year-one equity from $1k of loan paydown is wiped out by about $5k of value loss. Plan a longer hold.
- Polk County population projected at +37% by 2050 — long-run rental-demand tailwind backs the buy-and-hold thesis.
Negotiation context
- It's been on market 83 days — a 6% lower offer ($146k) is reasonable based on typical stale-listing flexibility.
- 2 sale attempts; this cycle's ask has dropped $10k (6%) from the opening price — seller is motivated, your offer sets the floor, not the list.
- Current owner paid $85k; list at $155k implies a 82% gain — meaningful room to come down on a strong offer.
Risks & watch-outs
- Watch-outs: built in 1908 — expect roof / HVAC / electrical / plumbing capex.
Questions for the listing agent
- What do current leases actually rent for vs. the listed asking? Can we see a recent rent roll and the last 12 months of T-12 income?
- It's been on market 83 days. Have you received any prior offers? Is the seller open to a 25% concession, seller financing, or rate buy-down credit?
- Built in 1908 — when were the roof, HVAC, electrical panel, plumbing, and water heater last replaced?
- Why hasn't it sold? Are there any deal-killer items the seller is aware of (foundation, flood, title, zoning, code violations)?
- Is there a deadline driving the sale (1031 exchange, divorce, estate, relocation)? That informs how much negotiation room exists.
- Schools are D-rated, which usually means shorter tenancies and higher turnover. Who's the typical renter profile here, and what's been the actual vacancy rate?
- Crime grade is F in this area — have there been break-ins, vandalism, or insurance claims at this property in the last 3 years? What carrier currently insures it and at what premium?
- The area grade is low — what's the realistic commute time and amenity access for the typical tenant pool here? Any planned neighborhood developments (good or bad) we should know about?
- What's the average days-on-market for RENTAL listings here right now (not sales)? A rising rental-DOM trend means longer vacancies and softer asking-rent achievability than the comps imply.
- What's the recent tenant-quality profile in this submarket — average credit score on applications, eviction rate, late-payment / NSF rate, and stable-employment percentage? A property-management company in the area should have these aggregated.
- How much new for-sale + rental construction is in the pipeline within 1–3 miles? Heavy new supply typically softens prices + rents 12–24 months out; constrained supply supports both.
Investment metrics
- 1% rule
- 0.75% ✗
- Cap rate
- 5.18%
- Cash-on-cash
- -3.97%
- DSCR
- 0.82
- GRM
- 11.0
CMA / ARV
- ARV (median comp)
- $193,708
- List price
- $155,000
- Delta
- -19.98%
- Verdict
- UNDERPRICED
- Comps
- 20 within 1.0 mi
Show comp detail 12 sales within ~0.75 mi
| Address | Dist | Beds/Ba | Sqft | Sold | Price | $/sf | Match |
|---|---|---|---|---|---|---|---|
| 343 E Bell Ave | 0.20mi | 3/2.0 (+1) | 864 (+3%) | 0mo | $153,500 | $178 | 77 |
| 2505 SE 8th St | 0.55mi | 2/1.0 | 852 (+1%) | 2mo | $120,000 | $141 | 71 |
| 101 Lacona Ave | 0.21mi | 2/2.0 | 768 (-9%) | 3mo | $174,000 | $227 | 70 |
| 2420 SE 6th St | 0.39mi | 3/1.0 (+1) | 874 (+4%) | 2mo | $215,000 | $246 | 69 |
| 412 Fulton Dr | 0.48mi | 2/2.0 | 880 (+5%) | 1mo | $167,500 | $190 | 65 |
| 505 Kirkwood Ave | 0.38mi | 2/1.0 | 720 (-14%) | 3mo | $122,000 | $169 | 56 |
| 820 Creston Ave | 0.67mi | 2/1.0 | 902 (+7%) | 1mo | $164,500 | $182 | 55 |
| 3111 SE 6th St | 0.66mi | 2/1.0 | 912 (+9%) | 5mo | $167,000 | $183 | 51 |
| 3216 SE 3rd St | 0.62mi | 3/1.0 (+1) | 924 (+10%) | 0mo | $175,000 | $189 | 49 |
| 309 E Park Ave | 0.59mi | 3/1.5 (+1) | 912 (+9%) | 4mo | $210,000 | $230 | 48 |
| 206 E Hughes Cir | 0.61mi | 3/1.5 (+1) | 922 (+10%) | 4mo | $230,000 | $249 | 45 |
| 801 Boulder Ave | 0.75mi | 3/2.0 (+1) | 892 (+6%) | 1mo | $218,000 | $244 | 45 |
Match score weights: distance 35% · size 25% · config 20% · recency 20%. Top-matched comps best support the ARV.
Projected returns pro-forma
-3.0% appreciation · 3.48% rent growth · sell at horizon
- IRR
- -22.4%
- Equity multiple
- 0.22×
- Total profit
- $-33,690
- Equity at exit
- $23,111
- IRR
- -15.5%
- Equity multiple
- 0.11×
- Total profit
- $-38,714
- Equity at exit
- $13,402
Cash invested: $43,400 (down + closing). Projections, not guarantees.
Landlord ↔ Tenant lean methodology
- Overall (STATE)
- 83 Strongly Landlord-Friendly
- State Iowa
- 83 Strongly Landlord-Friendly · R+6
- County
- — inherits STATE
- City
- — inherits STATE
ZIP-level market 50315
- Rents YoY
- 3.5%
- Active inventory
- 227
- Price-to-rent
- 11.0×
Monthly cashflow live
- Estimated rent
- $1,169 high interval (Pro) →
- Mortgage (P&I)
- −$813
- Tax from tax record
- −$190 /mo · $2,280/yr
- Insurance
- −$65
- HOA
- −$0
- Vacancy / Maint / Mgmt
- −$246
- Net cashflow
- $-144
Break-even live
UW: 25.0% down · 7.5% · 30yr · 1.5% tax · 5.0% vac · 8.0% maint · 8.0% mgmt
Financing live
Cash to close
- Down payment
- $38,750
- Closing costs
- $4,650
- Reserves months
- —
- Total cash needed
- —
Loan-product check · same deal, 3 products live
Conventional
25% down · 7.5% · 30yr
- Down + closing
- —
- Monthly P&I
- —
- Monthly cashflow
- —
- DSCR
- —
- Eligible?
- —
Personal DTI + credit; lowest rate.
DSCR
20% down · 8.5% · 30yr
- Down + closing
- —
- Monthly P&I
- —
- Monthly cashflow
- —
- DSCR
- —
- Eligible?
- —
No personal income docs; deal must DSCR.
Hard money
10% down · 12.0% · 12mo
- Down + closing
- —
- Monthly P&I
- —
- Monthly cashflow
- —
- DSCR
- —
- Eligible?
- —
Short-term bridge; refi at stabilization.
Rent comps 38 comps
| Address | Beds | Baths | Sqft | Rent | $/sqft | DOM | Units | Dist |
|---|---|---|---|---|---|---|---|---|
| 404 E Pleasant View Dr Des Moines, IA | 3.0 | 2.0 | 936 | $1,125 | $1.20 | 43d | 1 | 0.44mi |
| 701 Loomis Ave Unit 7011 Des Moines, IA | 2.0 | 1.0 | 600 | $800 | $1.33 | 14d | 1 | 0.56mi |
| 116 Park Ave Des Moines, IA | 2.0 | 1.0 | 728 | $1,200 | $1.65 | 43d | 1 | 0.58mi |
| 612 Bancroft St Unit 618-2 Des Moines, IA | 1.0 | 1.0 | 525 | $775 | $1.48 | 19d | 1 | 0.60mi |
| 2440 SW 9th St Unit 5 Des Moines, IA | 2.0 | 1.0 | 780 | $1,100 | $1.41 | 43d | 1 | 0.63mi |
| 1201 E Bell Ave Des Moines, IA | 3.0 | 2.0 | 1107 | $1,100 | $0.99 | 14d | 1 | 0.71mi |
| 3310 SE 5th St Des Moines, IA | 2.0 | 1.0 | 700 | $1,150 | $1.64 | 43d | 1 | 0.71mi |
| 700 Monona Ave Des Moines, IA | 1.0–2.0 | 1.0 | 875 | $1,100 | $1.26 | 23d | 3 | 0.75mi |
| 822 Hartford Ave Des Moines, IA | 2.0 | 1.0 | 710 | $975 | $1.37 | 43d | 1 | 0.75mi |
| 824 Hartford Ave Des Moines, IA | 2.0 | 1.0 | 730 | $975 | $1.34 | 23d | 1 | 0.75mi |
| 703 Monona Ave Des Moines, IA | 2.0 | 1.0 | 850 | $1,100 | $1.29 | 14d | 3 | 0.75mi |
| 828 Hartford Ave Des Moines, IA | 2.0 | 1.0 | 710 | $975 | $1.37 | 43d | 1 | 0.76mi |
| 701 Monona Ave Des Moines, IA | 1.0–2.0 | 1.0 | 825 | $1,100 | $1.33 | 23d | 2 | 0.76mi |
| 815 Boulder Ave Des Moines, IA | 1.0 | 1.0 | 800 | $745 | $0.93 | 43d | 1 | 0.76mi |
| 315 Miller Ave Des Moines, IA | 3.0 | 1.0 | 1018 | $1,595 | $1.57 | 43d | 1 | 0.78mi |
| 3130 Indianola Ave Des Moines, IA | 1.0–2.0 | 1.0 | 900 | $1,495 | $1.66 | 43d | 1 | 0.84mi |
| 100 Jackson Ave Des Moines, IA | 3.0 | 1.0–2.0 | 885 | $1,461 | $1.65 | 14d | 21 | 0.92mi |
| 3200 Indianola Ave Des Moines, IA | 2.0 | 1.0 | 850 | $900 | $1.06 | 14d | 8 | 0.95mi |
| 1405 SE 1st St Des Moines, IA | 1.0–2.0 | 1.0–2.0 | 802 | $1,435 | $1.79 | 14d | 8 | 0.95mi |
| 580 SW 9th St Unit 302 Des Moines, IA | 1.0 | 1.0 | 650 | $1,275 | $1.96 | 23d | 1 | 1.14mi |
| 1085 Dart Way Unit 204 Des Moines, IA | 1.0 | 1.0 | 595 | $1,200 | $2.02 | 23d | 1 | 1.16mi |
| 3712 SE 14th St Unit 3708-36 Des Moines, IA | 2.0 | 1.0 | 850 | $855 | $1.01 | 14d | 1 | 1.18mi |
| 550 SW 9th St Unit 407 Des Moines, IA | 1.0 | 1.0 | 694 | $1,375 | $1.98 | 14d | 1 | 1.19mi |
| 1627 E Glenwood Dr Des Moines, IA | 3.0 | 1.0 | 1040 | $1,295 | $1.25 | 43d | 1 | 1.20mi |
| 1512 Evergreen Ave Des Moines, IA | 1.0–2.0 | 1.0–2.0 | 756 | $970 | $1.28 | 19d | 3 | 1.24mi |
| 425 SW 11th St Des Moines, IA | 2.0 | 1.0–2.0 | 879 | $2,384 | $2.71 | 14d | 38 | 1.25mi |
| 910 E Railroad Ave Des Moines, IA | 2.0 | 1.0 | 768 | $925 | $1.20 | 43d | 1 | 1.27mi |
| 1300 E Watrous Ave Des Moines, IA | 1.0 | 1.0 | 650 | $756 | $1.16 | 14d | 3 | 1.27mi |
| 3810 SW 12th St Des Moines, IA | 2.0 | 1.0 | 790 | $1,095 | $1.39 | 23d | 1 | 1.30mi |
| 400 SW 11th St Des Moines, IA | 1.0 | 1.0 | 841 | $1,544 | $1.83 | 14d | 9 | 1.33mi |
| 320 SW 7th St Des Moines, IA | 1.0–2.0 | 1.0–2.0 | 920 | $1,459 | $1.59 | 14d | 10 | 1.36mi |
| 100 Market St #405 Des Moines, IA | 1.0 | 1.0 | 733 | $1,275 | $1.74 | 23d | 1 | 1.40mi |
| 900 Elder Ln Unit 9 Des Moines, IA | 1.0 | 1.0 | 575 | $675 | $1.17 | 14d | 1 | 1.41mi |
| 4221 SE 13th St Des Moines, IA | 1.0 | 1.0 | 650 | $650 | $1.00 | 23d | 1 | 1.42mi |
| 1012 Carrie Ave Des Moines, IA | 2.0 | 1.0 | 1100 | $1,700 | $1.55 | 21d | 1 | 1.44mi |
| 401 SE 6th St Des Moines, IA | 1.0–2.0 | 1.0 | 764 | $1,397 | $1.83 | 14d | 6 | 1.45mi |
| 103 SW 3rd St Des Moines, IA | 2.0 | 1.0–2.0 | 725 | $2,043 | $2.82 | 14d | 17 | 1.45mi |
| 210 SW 11th St Des Moines, IA | 3.0 | 1.0–2.5 | 947 | $2,283 | $2.41 | 14d | 90 | 1.48mi |
Listing history 16 events
-
2026-06-09status $155,000 Pending 83 DOM
-
2026-06-08days on market $155,000 Active 83 DOM
-
2026-06-07days on market $155,000 Active 82 DOM
-
2026-06-05days on market $155,000 Active 79 DOM
-
2026-06-03days on market $155,000 Active 78 DOM
-
2026-06-02days on market $155,000 Active 77 DOM
-
2026-06-01days on market $155,000 Active 76 DOM
-
2026-05-31days on market $155,000 Active 75 DOM
-
2026-05-31days on market $155,000 Active 74 DOM
-
2026-04-24price $160,000 382-char remark
Show marketing remark (382 chars)
Nice south side gem features 2 beds, 1 bath, over 800 SF, an oversized 2 car garage and sets on over half an acre lot. Home is in solid condition. Big ticket items such as HVAC, roof, windows, carpet and asphalt driveway all done within the last several years. Conveniently located a few minutes from downtown, I-235 and all other amenities. Perfect starter home, come check it out!
-
2026-04-06price $162,500 382-char remark
Show marketing remark (382 chars)
Nice south side gem features 2 beds, 1 bath, over 800 SF, an oversized 2 car garage and sets on over half an acre lot. Home is in solid condition. Big ticket items such as HVAC, roof, windows, carpet and asphalt driveway all done within the last several years. Conveniently located a few minutes from downtown, I-235 and all other amenities. Perfect starter home, come check it out!
-
2026-03-20status Active 382-char remark
Show marketing remark (382 chars)
Nice south side gem features 2 beds, 1 bath, over 800 SF, an oversized 2 car garage and sets on over half an acre lot. Home is in solid condition. Big ticket items such as HVAC, roof, windows, carpet and asphalt driveway all done within the last several years. Conveniently located a few minutes from downtown, I-235 and all other amenities. Perfect starter home, come check it out!
-
2026-03-13status Pending 382-char remark
Show marketing remark (382 chars)
Nice south side gem features 2 beds, 1 bath, over 800 SF, an oversized 2 car garage and sets on over half an acre lot. Home is in solid condition. Big ticket items such as HVAC, roof, windows, carpet and asphalt driveway all done within the last several years. Conveniently located a few minutes from downtown, I-235 and all other amenities. Perfect starter home, come check it out!
-
2026-03-10$165,000 Active 382-char remark
Show marketing remark (382 chars)
Nice south side gem features 2 beds, 1 bath, over 800 SF, an oversized 2 car garage and sets on over half an acre lot. Home is in solid condition. Big ticket items such as HVAC, roof, windows, carpet and asphalt driveway all done within the last several years. Conveniently located a few minutes from downtown, I-235 and all other amenities. Perfect starter home, come check it out!
-
2016-04-18soldstatus $85,000
-
2012-02-08soldstatus $85,000
ⓘ Source: listings_history table (triggers on properties + properties_extension) + one-shot
backfill from property_details.listing_events for pre-trigger history.
Tax reassessment forecast IA · Partial reset (capped growth)
- Current annual tax
- $2,280 · $190/mo
- Projected year-2 tax
- $2,357 · $196/mo
- Expected delta
- +$77/yr (+$6/mo · 3.4%)
ⓘ Screening estimate from a state-policy table — verify with the county assessor before closing.
Climate risk First Street
- Flood 1/10 Low FEMA zone X (unshaded) · 0% chance over 30 yrs
- Wildfire 1/10 Low
- Heat 3/10 Moderate 7 d/yr ≥103°F today · 15 d/yr by 30 yrs out
- Wind 2/10 Low
- Air quality 2/10 Low 1 unhealthy d/yr today · 2 by 30 yrs out
Nearby sold comps map
Loading sold comps map…
Walkable amenities ~0.75 mi
Loading nearby amenities…
Taxation est. · year 1
- Rental income
- $14,030
- − Mortgage interest
- −$8,682
- − Property taxes
- −$2,280
- − Insurance
- −$775
- − Repairs & maintenance
- −$1,122
- − Management
- −$1,122
- − Depreciation
- −$4,509
- Taxable loss
- −$4,461
- Est. tax savings @ 24.0%
- +$1,071
- After-tax cash flow
- $-654/yr
For passive investors: Depreciation is non-cash, so a rental often shows a tax loss while cash-flowing — sheltering income. Rental losses are passive: they offset passive income freely, and up to $25,000/yr can offset ordinary (W-2) income if you actively participate and your MAGI is under $100k (phasing out to $0 by $150k); unused losses carry forward. On sale, claimed depreciation is recaptured at up to 25%, and gains may owe capital-gains tax (a 1031 exchange can defer both). Figures are a year-1 estimate at your 24.0% rate — not tax advice; consult a CPA.
Schools (NCES district)
- District
- Des Moines Independent Community School District
- NCES district ID
- 1908970
- Math proficiency
- 43% ▼ -6.00%
- Reading proficiency
- 46% ▼ -1.00%
- Median HH income
- $45,905
- Composite
- 37.83/100
- National rank
- #4331
- State rank
- #289 of 289 in IA
Livability — Des Moines
- Score
- 81/100
- State rank
- #63
- US rank
- #1432
Category grades
Schools grade is shown separately in the Schools card above.
Census & demographics
- Census place
- Des Moines, IA
- County
- Polk County · 453,298 people
- City population
- 203,612
- Metro
- Des Moines-West Des Moines, IA
- Population (ZIP)
- 34,816
- Household income
- $60,590
- Rent vs Own
- Severe rent burden
- 1072.0
Population outlook (Polk County) Hauer SSP2
- Today (2025)
- 548,042 people
- By 2030
- 588,557 · +7.4%
- By 2040
- 670,629 · +22.4%
- By 2050
- 752,830 · +37.4%
- By 2075
- 955,069 · +74.3%
- By 2100
- 1,115,436 · +103.5%
Race, ethnicity, and origin ACS 2023
- Neighborhood character
- Predominantly White (66%)
- Race & ethnicity
- White 66% Hispanic / Latino 19% Two or more races 11% Black 9% Asian 2%
- Hispanic origin (detail)
- Mexican 14%
- Common ancestry
- Iranian 2% Portuguese 2% Italian 2%
- Foreign-born
- 10% · Canada, Philippines
- Languages at home
- 83% English-only · Spanish 13% Other Asian/Pacific 1%
Political lean MEDSL · Polk
- 2024 margin
- D (+10.9) · D 54.8% · R 43.9% · Other 1.3%
- 2008→2024 swing
- -3.7pp toward R · 2008: 14.6pp · 2024: 10.9pp
- All cycles
- 2024: D+10.9 2020: D+15.2 2016: D+11.5 2012: D+14.2 2008: D+14.6
Not yet ingested
- Civics
- —
Market trends
- HPI YoY
- ▼ -259.03%
- Current HPI
- 269.7231
- Rent YoY
- ▲ 3.48%
- Metro
- Des Moines-West Des Moines, IA
- State GDP YoY
- ▲ 2.48%
- F500 in state
- 4
Industry mix (Fortune 500 HQ in IA)
| Industry | F500 HQs | Revenue |
|---|---|---|
| Financial Services | 1 | $16B |
|
||
| Retail / Convenience | 1 | $15B |
|
||
Price history
+88.2% since first listed7 events — show timeline
- 2026-04-24 Price Changed $160,000 DMMLS
- 2026-04-06 Price Changed $162,500 DMMLS
- 2026-03-20 Relisted — DMMLS
- 2026-03-13 Pending — DMMLS
- 2026-03-10 Listed $165,000 DMMLS
- 2016-04-18 Sold (Public Records) $85,000 Public Records
- 2012-02-08 Sold (Public Records) $85,000 Public Records
Property tax history
+3.7%/yrLatest (2025): $2,280 · +2.5% YoY. Source: county tax records.
Cash-flow waterfall
monthlySold comps — $/sqft
last 12 mo · ≤1 miLoading sold comps…