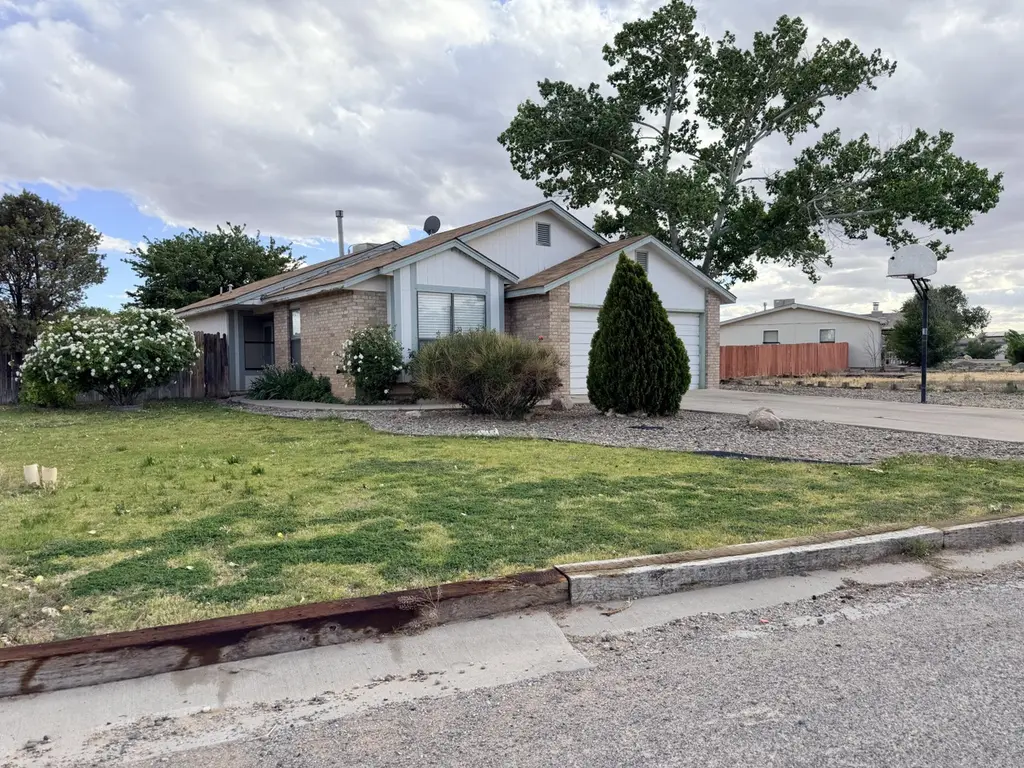
4 Owens Dr · Meadow Lake, NM
Flood risk 1/10 · Minimal
- FEMA flood zone
- X (unshaded)
- Chance of flooding over 30 yrs
- 0.0%
- Est. flood insurance / yr
- $507 – $1,088
Fire risk 5/10 · Moderate
- Est. fire insurance / yr
- $706 – $1,312
Heat risk 5/10 · Moderate
- Hot days now (above 96°F)
- 7 days/yr
- Hot days in 30 yrs
- 18 days/yr
Wind risk 1/10 · Minimal
- Chance of severe wind over 30 yrs
- —
Air-quality risk 2/10 · Minimal
- Unhealthy air days now
- 1 days/yr
- Unhealthy air days in 30 yrs
- 1 days/yr
Risk factors via First Street. Map © Google.
Why this score? — see what drove the C grade
The composite is a weighted blend of 9 inputs, each scored 0–100. Each bar is that input's sub-score; the figure is the points it added to the 100-point composite (weight × sub-score).
- Cash flow +20.8/30.0
- ARV discount +12.5/15.0
- DSCR +6.6/10.0
- Rent growth +5.0/5.0
- 1% rule +4.6/10.0
- Schools +2.6/10.0
- Condition / age +2.5/5.0
- Livability +2.4/5.0
- Appreciation +0.0/10.0
$239,999
🖨 Deal sheet 📄 Offer letter ✓ Due diligence
Listing remarks
This is a great opportunity to own a 3-bedroom, 2-bathroom home featuring a new Mastercool 5000CFM AC installed in 2025.The kitchen includes a pantry and newer appliances, and the washer and dryer are negotiable. The property also offers a finished garage and a large backyard with a covered patio, perfect for children and pets.
Key facts
- Large backyard
- Covered patio
- Finished garage
Tags
Property features AI
Finance
- HOA & community: Homeowners association with an annual fee of $190 covering common areas and road maintenance
Exterior
- Parking: Attached finished garage with garage door opener; 2 garage spaces
- Utilities: Electricity connected; Natural gas connected; Water connected (community/co-op); Sewer connected (septic tank)
- Home design: Single-story home; Faces north; Resale property
- Construction: Frame construction; Pitched roof; Slab foundation; Built by unknown builder
- Exterior features: Covered patio; Patio; Shed(s); Back yard fencing; Sprinklers in rear; Landscaped yard; Few trees
Interior
- Kitchen: Dishwasher; Free-standing gas range
- Bedrooms: Primary bedroom on the main level
- Flooring: Carpet; Tile
- Bathrooms: 1 full bathroom; 1 three-quarter bathroom
- Heating & cooling: Forced air heating; Evaporative cooling
- Interior features: Ceiling fan(s); Pantry; Double pane and insulated windows
- Laundry & utility: Electric dryer hookup
Neighborhood map
What this means for you Summary
Snapshot
- This is a 3-bed/2.0-bath single-family listed at $240k.
Deal economics
- At list price, monthly cash flow is $329 ($4k/yr) — positive.
- The deal already cash-flows at list — no discount required.
- To meet the 1% rule (rent ≥ 1% of price), the offer needs to be $230k (4.3% below list).
- Recommended offer: $230k (4.3% below list) — sets the bar for 1% rule.
Location & tenants
- Location reads 48/100 on livability (#306 in NM) — a working-class tenant base; expect higher turnover. Strengths: cost of living A+, housing A+; Watch: schools F, crime F, amenities F.
- Los Lunas Public Schools (suburban): math 20% / reading 34% proficiency, ranked #34 of 95 in NM (top 36%) — low school quality limits family demand, transient renter base, plan for 1-2y turnover; 63% free/reduced lunch — lower-income household profile, screen leases tightly.
- Market conditions: Rents rising fast (+33.2%/yr); 562 active listings in the ZIP; 2 comparable units currently listed for rent nearby; 303 units permitted in Valencia County in 2024 (0 in 5+ unit buildings).
- At $2,296/mo this rent would consume 45% of the median local household income ($61k/yr) (locally 602% of renters already pay >50% of income on rent) — very limited rent-growth headroom before tenants either downsize or default.
Forward outlook
- Local home prices are declining (-3.0%/yr); year-one equity from $2k of loan paydown is wiped out by about $7k of value loss. Plan a longer hold.
- Valencia County population projected at -14% by 2050 — secular population decline; favor cash flow + early exit over multi-decade hold.
- At projected returns (-3.0% appreciation + 8.0% rent growth), your $67k cash investment doubles in ~9 years — after that, you're playing with house money.
Negotiation context
- Only 3 days on market — expect competitive offers; lowballing is unlikely to land.
Risks & watch-outs
- Climate carrying-cost: moderate wildfire risk; extreme-heat days projected 7→18/yr by 2055 (HVAC capex compounding) — expect insurance premiums to compound above CPI over the hold.
Questions for the listing agent
- What does the HOA fee cover, when was the last increase, and are there any pending special assessments or reserve-fund shortfalls?
- Is there a deadline driving the sale (1031 exchange, divorce, estate, relocation)? That informs how much negotiation room exists.
- Schools are F-rated, which usually means shorter tenancies and higher turnover. Who's the typical renter profile here, and what's been the actual vacancy rate?
- Crime grade is F in this area — have there been break-ins, vandalism, or insurance claims at this property in the last 3 years? What carrier currently insures it and at what premium?
- What's the average days-on-market for RENTAL listings here right now (not sales)? A rising rental-DOM trend means longer vacancies and softer asking-rent achievability than the comps imply.
- What's the recent tenant-quality profile in this submarket — average credit score on applications, eviction rate, late-payment / NSF rate, and stable-employment percentage? A property-management company in the area should have these aggregated.
- How much new for-sale + rental construction is in the pipeline within 1–3 miles? Heavy new supply typically softens prices + rents 12–24 months out; constrained supply supports both.
Investment metrics
- 1% rule
- 0.96% ✗
- Cap rate
- 7.94%
- Cash-on-cash
- 5.88%
- DSCR
- 1.26
- GRM
- 8.7
CMA / ARV
- ARV (median comp)
- $270,096
- List price
- $239,999
- Delta
- -11.14%
- Verdict
- UNDERPRICED
- Comps
- 20 within 1.0 mi
Show comp detail 9 sales within ~0.75 mi
| Address | Dist | Beds/Ba | Sqft | Sold | Price | $/sf | Match |
|---|---|---|---|---|---|---|---|
| 4 Owens Dr | 0.00mi | 3/2.0 | 1,166 (0%) | 0mo | $239,999 | $206 | 100 |
| 9 Owens Dr | 0.05mi | 3/2.0 | 1,253 (+8%) | 8mo | $275,000 | $219 | 79 |
| 6 El Tigre Dr | 0.42mi | 3/2.0 | 1,178 (+1%) | 4mo | $286,500 | $243 | 76 |
| 19 Owens Dr | 0.13mi | 3/2.0 | 1,299 (+11%) | 2mo | $269,900 | $208 | 74 |
| 42 Milton Loop | 0.50mi | 3/2.0 | 1,182 (+1%) | 4mo | $265,000 | $224 | 72 |
| 3 Hammond Ct | 0.22mi | 3/2.0 | 1,152 (-1%) | 20mo | $245,000 | $213 | 71 |
| 11 El Tigre Dr | 0.39mi | 3/2.0 | 1,097 (-6%) | 5mo | $239,900 | $219 | 68 |
| 49 Milton Loop | 0.55mi | 3/2.0 | 1,081 (-7%) | 3mo | $239,900 | $222 | 60 |
| 17 Hermanos Loop | 0.48mi | 2/2.0 (-1) | 1,274 (+9%) | 12mo | $255,000 | $200 | 47 |
Match score weights: distance 35% · size 25% · config 20% · recency 20%. Top-matched comps best support the ARV.
Projected returns pro-forma
-3.0% appreciation · 8.0% rent growth · sell at horizon
- IRR
- -2.2%
- Equity multiple
- 0.91×
- Total profit
- $-5,853
- Equity at exit
- $35,785
- IRR
- 12.0%
- Equity multiple
- 2.14×
- Total profit
- $76,852
- Equity at exit
- $20,751
Cash invested: $67,200 (down + closing). Projections, not guarantees.
Landlord ↔ Tenant lean methodology
- Overall (STATE)
- 55 Moderately Landlord-Leaning
- State New Mexico
- 55 Moderately Landlord-Leaning · D+3
- County
- — inherits STATE
- City
- — inherits STATE
ZIP-level market 87031
- Home prices YoY
- -29.8%
- Rents YoY
- 33.2%
- Active inventory
- 562
- Price-to-rent
- 8.7×
Monthly cashflow live
- Estimated rent
- $2,296 medium interval (Pro) →
- Mortgage (P&I)
- −$1,259
- Tax from tax record
- −$110 /mo · $1,323/yr
- Insurance
- −$100
- HOA
- −$16
- Vacancy / Maint / Mgmt
- −$482
- Net cashflow
- $329
Break-even live
UW: 25.0% down · 7.5% · 30yr · 1.5% tax · 5.0% vac · 8.0% maint · 8.0% mgmt
Financing live
Cash to close
- Down payment
- $60,000
- Closing costs
- $7,200
- Reserves months
- —
- Total cash needed
- —
Loan-product check · same deal, 3 products live
Conventional
25% down · 7.5% · 30yr
- Down + closing
- —
- Monthly P&I
- —
- Monthly cashflow
- —
- DSCR
- —
- Eligible?
- —
Personal DTI + credit; lowest rate.
DSCR
20% down · 8.5% · 30yr
- Down + closing
- —
- Monthly P&I
- —
- Monthly cashflow
- —
- DSCR
- —
- Eligible?
- —
No personal income docs; deal must DSCR.
Hard money
10% down · 12.0% · 12mo
- Down + closing
- —
- Monthly P&I
- —
- Monthly cashflow
- —
- DSCR
- —
- Eligible?
- —
Short-term bridge; refi at stabilization.
Rent comps 2 comps
| Address | Beds | Baths | Sqft | Rent | $/sqft | DOM | Units | Dist |
|---|---|---|---|---|---|---|---|---|
| 37 La Ladera Rd Los Lunas, NM | 3.0 | 1.0 | 1360 | $2,000 | $1.47 | 43d | 1 | 0.83mi |
| 14 Calle Guaymas Los Lunas, NM | 3.0 | 2.0 | 1337 | $1,975 | $1.48 | 23d | 1 | 0.88mi |
HOA detail
- Monthly dues
- $16 · $192/yr
Listing history 2 events
-
2026-05-09status Pending 329-char remark
-
2026-05-06$239,999 Active 329-char remark
ⓘ Source: listings_history table (triggers on properties + properties_extension) + one-shot
backfill from property_details.listing_events for pre-trigger history.
Tax reassessment forecast NM · Resets to sale price
- Current annual tax
- $1,323 · $110/mo
- Projected year-2 tax
- $1,920 · $160/mo
- Expected delta
- +$597/yr (+$50/mo · 45.1%)
ⓘ Screening estimate from a state-policy table — verify with the county assessor before closing.
Climate risk First Street
- Flood 1/10 Low FEMA zone X (unshaded) · 0% chance over 30 yrs
- Wildfire 5/10 Major
- Heat 5/10 Major 7 d/yr ≥96°F today · 18 d/yr by 30 yrs out
- Wind 1/10 Low
- Air quality 2/10 Low 1 unhealthy d/yr today · 1 by 30 yrs out
Nearby sold comps map
Loading sold comps map…
Walkable amenities ~0.75 mi
Loading nearby amenities…
Taxation est. · year 1
- Rental income
- $27,557
- − Mortgage interest
- −$13,444
- − Property taxes
- −$1,323
- − Insurance
- −$1,200
- − Repairs & maintenance
- −$2,205
- − Management
- −$2,205
- − HOA
- −$192
- − Depreciation
- −$6,982
- Taxable income
- $7
- Est. tax owed @ 24.0%
- −$2
- After-tax cash flow
- $3,950/yr
For passive investors: Depreciation is non-cash, so a rental often shows a tax loss while cash-flowing — sheltering income. Rental losses are passive: they offset passive income freely, and up to $25,000/yr can offset ordinary (W-2) income if you actively participate and your MAGI is under $100k (phasing out to $0 by $150k); unused losses carry forward. On sale, claimed depreciation is recaptured at up to 25%, and gains may owe capital-gains tax (a 1031 exchange can defer both). Figures are a year-1 estimate at your 24.0% rate — not tax advice; consult a CPA.
Schools (NCES district)
- District
- Los Lunas Public Schools
- NCES district ID
- 3501680
- Math proficiency
- 20% —
- Reading proficiency
- 34% —
- Median HH income
- $44,438
- Composite
- 26.11/100
- National rank
- #12724
- State rank
- #34 of 95 in NM
Livability — Meadow Lake
- Score
- 48/100
- State rank
- #306
- US rank
- #26141
Category grades
Schools grade is shown separately in the Schools card above.
Census & demographics
- County
- Valencia County · 68,779 people
- Metro
- Albuquerque, NM
- Population (ZIP)
- 47,514
- Household income
- $60,902
- Rent vs Own
- Severe rent burden
- 602.0
Population outlook (Valencia County) Hauer SSP2
- Today (2025)
- 73,788 people
- By 2030
- 72,101 · -2.3%
- By 2040
- 67,930 · -7.9%
- By 2050
- 63,191 · -14.4%
- By 2075
- 53,644 · -27.3%
- By 2100
- 40,882 · -44.6%
Race, ethnicity, and origin ACS 2023
- Neighborhood character
- Majority Hispanic (63%)
- Race & ethnicity
- Hispanic / Latino 63% White 30% Two or more races 29% Native American 4% Black 1%
- Hispanic origin (detail)
- Mexican 38%
- Common ancestry
- Serbian 1% Russian 1% Slovak 1%
- Foreign-born
- 8% · Canada
- Languages at home
- 71% English-only · Spanish 27%
Political lean MEDSL · Valencia
- 2024 margin
- R (+16.4) · D 40.9% · R 57.3% · Other 1.8%
- 2008→2024 swing
- -24.1pp toward R · 2008: 7.7pp · 2024: -16.4pp
- All cycles
- 2024: R+16.4 2020: R+9.6 2016: R+8.7 2012: D+2.5 2008: D+7.7
Not yet ingested
- Civics
- —
Market trends
- HPI YoY
- ▼ -85.17%
- Current HPI
- 201.0508
- Rent YoY
- ▲ 33.16%
- Metro
- Albuquerque, NM
- State GDP YoY
- —
- F500 in state
- 0
Price history
3 events — show timeline
- 2026-06-11 Sold (MLS) — Southwest MLS
- 2026-05-09 Pending — Southwest MLS
- 2026-05-06 Listed $239,999 Southwest MLS
Property tax history
+1.0%/yrLatest (2025): $1,323 · +27.4% YoY. Source: county tax records.
Cash-flow waterfall
monthlySold comps — $/sqft
last 12 mo · ≤1 miLoading sold comps…