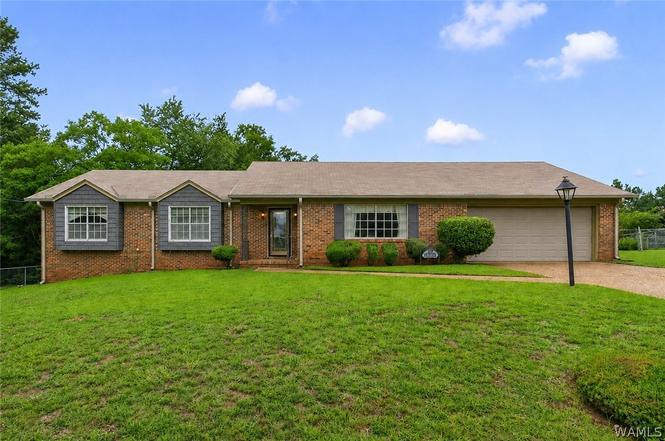
1604 Wakefield Dr · Tuscaloosa, AL
Flood risk 1/10 · Minimal
- FEMA flood zone
- X (unshaded)
- Chance of flooding over 30 yrs
- 0.0%
- Est. flood insurance / yr
- $507 – $1,088
Fire risk 3/10 · Minor
- Est. fire insurance / yr
- $916 – $1,700
Heat risk 7/10 · Major
- Hot days now (above 109°F)
- 7 days/yr
- Hot days in 30 yrs
- 21 days/yr
Wind risk 6/10 · Moderate
- Chance of severe wind over 30 yrs
- 59.0%
Air-quality risk 1/10 · Minimal
- Unhealthy air days now
- 0 days/yr
- Unhealthy air days in 30 yrs
- 0 days/yr
Risk factors via First Street. Map © Google.
Why this score? — see what drove the C- grade
The composite is a weighted blend of 9 inputs, each scored 0–100. Each bar is that input's sub-score; the figure is the points it added to the 100-point composite (weight × sub-score).
- Cash flow +19.5/30.0
- ARV discount +12.5/15.0
- DSCR +6.2/10.0
- 1% rule +4.0/10.0
- Rent growth +3.9/5.0
- Livability +3.9/5.0
- Schools +2.5/10.0
- Condition / age +2.5/5.0
- Appreciation +0.0/10.0
$229,900
🖨 Deal sheet 📄 Offer letter ✓ Due diligence
Listing remarks
Situated on a quiet cul-de-sac, 1604 Wakefield Drive offers the convenience of one-level living with 3 bedrooms, 2 bathrooms, and 1,914 sq ft. The all-brick exterior, two-car garage, and spacious backyard provide a fantastic opportunity for the next owner. Recent improvements include the roof being replaced in 2024 and the electrical breaker box replaced in 2026. Ready for you to bring your updates and personal touches, this home offers plenty of potential at an attractive value. Convenient to interstate access, UA, Mercedes, Downtown Tuscaloosa, and grocery stores! Call today to schedule a showing!
Key facts
- Interstate access
- Spacious backyard
- One-level living
Tags
Property features AI
Exterior
- Parking: Attached concrete driveway and garage; 2-car garage
- Utilities: Sewer connected
- Home design: Single-family residence; One story
- Construction: Brick construction; Composition/shingle roof
- Exterior features: Rain gutters; Chain link fencing; Shed(s)
Interior
- Bathrooms: 2 full bathrooms
- Heating & cooling: Central heating; Central air conditioning
- Interior features: Wood-burning fireplace in the living room; Water heater
- Laundry & utility: Main-level laundry room
Neighborhood map
What this means for you Summary
Snapshot
- This is a 3-bed/1.0-bath single-family listed at $230k.
Deal economics
- At list price, monthly cash flow is $262 ($3k/yr) — positive.
- The deal already cash-flows at list — no discount required.
- To meet the 1% rule (rent ≥ 1% of price), the offer needs to be $206k (10.3% below list).
- Recommended offer: $206k (10.3% below list) — sets the bar for 1% rule.
- Cap rate 7.7% vs local median 3.4% in Tuscaloosa — top-decile yield for the area; either an underpriced asset or a hidden risk that comps aren't pricing in. Stress-test before assuming the spread holds.
Location & tenants
- Location reads 77/100 on livability (#9 in AL, #2,909 nationally) — a middle-class / working-renter tenant base. Strengths: amenities A+, health & safety A+, cost of living A; Watch: crime F, employment D-.
- Tuscaloosa City (urban): math 19% / reading 40% proficiency, ranked #74 of 129 in AL (top 57%) — low school quality limits family demand, transient renter base, plan for 1-2y turnover.
- Zoned schools: Southview Elementary School (math 3% / reading 26%, grade F, #528 of 627 statewide, top 84%, 713 students, 71% FRL); Eastwood Middle School (math 3% / reading 31%, grade F, #201 of 257 statewide, top 79%, 758 students, 78% FRL); Paul W Bryant High School (math 3% / reading 7%, grade F, #276 of 305 statewide, top 95%, 1,042 students, 48% FRL).
- Zoned-school proficiency averages 12% at this address vs 30% district-wide (-17 pts) — the specific schools serving this property underperform the Tuscaloosa City average; the district grade overstates school quality for this exact location.
- Market conditions: Rents rising fast (+5.4%/yr); 457 active listings in the ZIP; 9 comparable units currently listed for rent nearby; rentals lingering (median 44d on market — plan ~5-8 weeks vacancy on turnover, expect pricing pressure); 67% of comp listings sitting > 30 days — soft ceiling on asking rent; 622 units permitted in Tuscaloosa County in 2024 (69 in 5+ unit buildings).
- This rent runs 40% of the median local income ($62k/yr) — at the standard rent-burdened threshold; future hikes will face affordability resistance.
Forward outlook
- Local home prices are declining (-3.0%/yr); year-one equity from $2k of loan paydown is wiped out by about $7k of value loss. Plan a longer hold.
- Tuscaloosa County population projected at +26% by 2050 — long-run rental-demand tailwind backs the buy-and-hold thesis.
Negotiation context
- Only 1 days on market — expect competitive offers; lowballing is unlikely to land.
Risks & watch-outs
- Climate carrying-cost: major wind risk, 59% chance of damaging wind over 30y; extreme-heat days projected 7→21/yr by 2055 (HVAC capex compounding) — expect insurance premiums to compound above CPI over the hold.
Questions for the listing agent
- Built in 1970 — when were the roof, HVAC, electrical panel, plumbing, and water heater last replaced?
- Is there a deadline driving the sale (1031 exchange, divorce, estate, relocation)? That informs how much negotiation room exists.
- Crime grade is F in this area — have there been break-ins, vandalism, or insurance claims at this property in the last 3 years? What carrier currently insures it and at what premium?
- What's the average days-on-market for RENTAL listings here right now (not sales)? A rising rental-DOM trend means longer vacancies and softer asking-rent achievability than the comps imply.
- What's the recent tenant-quality profile in this submarket — average credit score on applications, eviction rate, late-payment / NSF rate, and stable-employment percentage? A property-management company in the area should have these aggregated.
- How much new for-sale + rental construction is in the pipeline within 1–3 miles? Heavy new supply typically softens prices + rents 12–24 months out; constrained supply supports both.
Investment metrics
- 1% rule
- 0.90% ✗
- Cap rate
- 7.66%
- Cash-on-cash
- 4.88%
- DSCR
- 1.22
- GRM
- 9.3
CMA / ARV
- ARV (on-the-fly)
- $258,390
- Comps found
- 5
Show comp detail 5 sales within ~0.75 mi
| Address | Dist | Beds/Ba | Sqft | Sold | Price | $/sf | Match |
|---|---|---|---|---|---|---|---|
| 1505 Montrose Dr | 0.10mi | 3/2.0 | 1,752 (-8%) | 6mo | $237,500 | $136 | 72 |
| 5729 Kew Ln | 0.17mi | 4/2.0 (+1) | 2,097 (+10%) | 1mo | $225,000 | $107 | 66 |
| 6400 Plantation Ct | 0.71mi | 3/2.0 | 1,857 (-3%) | 10mo | $250,000 | $135 | 50 |
| 1319 Gingerwood Ln | 0.72mi | 3/2.0 | 1,720 (-10%) | 18mo | $279,900 | $163 | 30 |
| 6409 10th Ct | 0.66mi | 3/2.0 | 1,672 (-13%) | 23mo | $214,000 | $128 | 25 |
Match score weights: distance 35% · size 25% · config 20% · recency 20%. Top-matched comps best support the ARV.
Projected returns pro-forma
-3.0% appreciation · 5.42% rent growth · sell at horizon
- IRR
- -6.4%
- Equity multiple
- 0.76×
- Total profit
- $-15,538
- Equity at exit
- $34,279
- IRR
- 5.7%
- Equity multiple
- 1.46×
- Total profit
- $29,705
- Equity at exit
- $19,878
Cash invested: $64,372 (down + closing). Projections, not guarantees.
Landlord ↔ Tenant lean methodology
- Overall (STATE)
- 90 Strongly Landlord-Friendly
- State Alabama
- 90 Strongly Landlord-Friendly · R+15
- County
- — inherits STATE
- City
- — inherits STATE
ZIP-level market 35405
- Home prices YoY
- -26.9%
- Rents YoY
- 5.4%
- Active inventory
- 457
- Price-to-rent
- 9.3×
Monthly cashflow live
- Estimated rent
- $2,063 high interval (Pro) →
- Mortgage (P&I)
- −$1,206
- Tax from tax record
- −$67 /mo · $801/yr
- Insurance
- −$96
- HOA
- −$0
- Vacancy / Maint / Mgmt
- −$433
- Net cashflow
- $262
Break-even live
UW: 25.0% down · 7.5% · 30yr · 1.5% tax · 5.0% vac · 8.0% maint · 8.0% mgmt
Financing live
Cash to close
- Down payment
- $57,475
- Closing costs
- $6,897
- Reserves months
- —
- Total cash needed
- —
Loan-product check · same deal, 3 products live
Conventional
25% down · 7.5% · 30yr
- Down + closing
- —
- Monthly P&I
- —
- Monthly cashflow
- —
- DSCR
- —
- Eligible?
- —
Personal DTI + credit; lowest rate.
DSCR
20% down · 8.5% · 30yr
- Down + closing
- —
- Monthly P&I
- —
- Monthly cashflow
- —
- DSCR
- —
- Eligible?
- —
No personal income docs; deal must DSCR.
Hard money
10% down · 12.0% · 12mo
- Down + closing
- —
- Monthly P&I
- —
- Monthly cashflow
- —
- DSCR
- —
- Eligible?
- —
Short-term bridge; refi at stabilization.
Rent comps 9 comps
| Address | Beds | Baths | Sqft | Rent | $/sqft | DOM | Units | Dist |
|---|---|---|---|---|---|---|---|---|
| 1092 Stonebrook Ln Tuscaloosa, AL | 3.0 | 2.5 | 1745 | $2,450 | $1.40 | 43d | 1 | 1.00mi |
| 984 Stonebrook Ln Tuscaloosa, AL | 3.0 | 2.5 | 1745 | $2,450 | $1.40 | 43d | 1 | 1.03mi |
| 820 Stonebrook Ln Tuscaloosa, AL | 3.0 | 2.5 | 1745 | $2,450 | $1.40 | 43d | 1 | 1.06mi |
| 1009 Stonebrook Ln Tuscaloosa, AL | 3.0 | 2.5 | 1745 | $2,450 | $1.40 | 43d | 1 | 1.06mi |
| 815 Stonebrook Cir Tuscaloosa, AL | 3.0 | 2.5 | 1745 | $2,450 | $1.40 | 43d | 1 | 1.11mi |
| 801 Stonebrook Cir Tuscaloosa, AL | 2.0–3.0 | 2.0–2.5 | 1397 | $2,500 | $1.79 | 20d | 11 | 1.11mi |
| 3809 Millcreek Ln Tuscaloosa, AL | 3.0 | 1.5 | 1289 | $1,395 | $1.08 | 43d | 1 | 1.13mi |
| 8002 Shadesbrook Dr Tuscaloosa, AL | 3.0 | 2.0 | 1620 | $1,510 | $0.93 | 20d | 1 | 1.34mi |
| 8005 Shadesbrook Dr Tuscaloosa, AL | 4.0 | 2.0 | 1620 | $1,995 | $1.23 | 13d | 1 | 1.34mi |
Listing history 2 events
-
2026-06-17remarks 606-char remark
-
2026-06-17$229,900 Active 1 DOM
ⓘ Source: listings_history table (triggers on properties + properties_extension) + one-shot
backfill from property_details.listing_events for pre-trigger history.
Tax reassessment forecast AL · Resets to sale price
- Current annual tax
- $801 · $67/mo
- Projected year-2 tax
- $943 · $79/mo
- Expected delta
- +$141/yr (+$12/mo · 17.6%)
ⓘ Screening estimate from a state-policy table — verify with the county assessor before closing.
Climate risk First Street
- Flood 1/10 Low FEMA zone X (unshaded) · 0% chance over 30 yrs
- Wildfire 3/10 Moderate
- Heat 7/10 Severe 7 d/yr ≥109°F today · 21 d/yr by 30 yrs out
- Wind 6/10 Major 59% chance of damaging wind over 30 yrs
- Air quality 1/10 Low 0 unhealthy d/yr today · 0 by 30 yrs out
Nearby sold comps map
Loading sold comps map…
Walkable amenities ~0.75 mi
Loading nearby amenities…
Taxation est. · year 1
- Rental income
- $24,760
- − Mortgage interest
- −$12,878
- − Property taxes
- −$801
- − Insurance
- −$1,150
- − Repairs & maintenance
- −$1,981
- − Management
- −$1,981
- − Depreciation
- −$6,688
- Taxable loss
- −$719
- Est. tax savings @ 24.0%
- +$173
- After-tax cash flow
- $3,314/yr
For passive investors: Depreciation is non-cash, so a rental often shows a tax loss while cash-flowing — sheltering income. Rental losses are passive: they offset passive income freely, and up to $25,000/yr can offset ordinary (W-2) income if you actively participate and your MAGI is under $100k (phasing out to $0 by $150k); unused losses carry forward. On sale, claimed depreciation is recaptured at up to 25%, and gains may owe capital-gains tax (a 1031 exchange can defer both). Figures are a year-1 estimate at your 24.0% rate — not tax advice; consult a CPA.
Schools (NCES district)
- District
- Tuscaloosa City
- NCES district ID
- 0103360
- Math proficiency
- 19% ▼ -24.00%
- Reading proficiency
- 40% ▼ -1.00%
- Median HH income
- $37,474
- Composite
- 24.51/100
- National rank
- #7647
- State rank
- #74 of 129 in AL
Livability — Tuscaloosa
- Score
- 77/100
- State rank
- #9
- US rank
- #2909
Category grades
Schools grade is shown separately in the Schools card above.
Census & demographics
- Census place
- Tuscaloosa, AL
- County
- Tuscaloosa County · 206,491 people
- City population
- 134,228
- Metro
- Tuscaloosa, AL
- Population (ZIP)
- 49,420
- Household income
- $62,301
- Rent vs Own
- Severe rent burden
- 1963.0
Population outlook (Tuscaloosa County) Hauer SSP2
- Today (2025)
- 228,293 people
- By 2030
- 240,551 · +5.4%
- By 2040
- 263,856 · +15.6%
- By 2050
- 286,491 · +25.5%
- By 2075
- 335,783 · +47.1%
- By 2100
- 370,520 · +62.3%
Race, ethnicity, and origin ACS 2023
- Neighborhood character
- Diverse neighborhood (Simpson 0.56)
- Race & ethnicity
- Black 56% White 35% Hispanic / Latino 5% Two or more races 3% Asian 2%
- Hispanic origin (detail)
- Mexican 2%
- Common ancestry
- Italian 1% Lithuanian 1% Slovak 1%
- Foreign-born
- 5% · Canada, China
- Languages at home
- 94% English-only · Spanish 4% Other Indo-European 1% Chinese 1%
Political lean MEDSL · Tuscaloosa
- 2024 margin
- Strong R (+20.4) · D 39.4% · R 59.8%
- 2008→2024 swing
- -4.4pp toward R · 2008: -16.0pp · 2024: -20.4pp
- All cycles
- 2024: R+20.4 2020: R+14.8 2016: R+19.5 2012: R+17.4 2008: R+16.0
Not yet ingested
- Civics
- —
Market trends
- HPI YoY
- ▼ -71.25%
- Current HPI
- 193.1929
- Rent YoY
- ▲ 5.42%
- Metro
- Tuscaloosa, AL
- State GDP YoY
- ▲ 2.94%
- F500 in state
- 4
Industry mix (Fortune 500 HQ in AL)
| Industry | F500 HQs | Revenue |
|---|---|---|
| Financial Services | 1 | $8B |
|
||
| Healthcare | 1 | $5B |
|
||
Price history
1 event — show timeline
- 2026-06-17 Listed $229,900 WAMLS
Property tax history
-7.4%/yrLatest (2025): $801 · +6.9% YoY. Source: county tax records.
Cash-flow waterfall
monthlySold comps — $/sqft
last 12 mo · ≤1 miLoading sold comps…