133 Lakeshore Ct · Lake Medina Shores, TX
Flood risk 1/10 · Minimal
- FEMA flood zone
- X (unshaded)
- Chance of flooding over 30 yrs
- 0.0%
- Est. flood insurance / yr
- $507 – $1,088
Fire risk 4/10 · Minor
- Est. fire insurance / yr
- $1,222 – $2,270
Heat risk 7/10 · Major
- Hot days now (above 107°F)
- 7 days/yr
- Hot days in 30 yrs
- 20 days/yr
Wind risk 6/10 · Moderate
- Chance of severe wind over 30 yrs
- 57.0%
Air-quality risk 1/10 · Minimal
- Unhealthy air days now
- 0 days/yr
- Unhealthy air days in 30 yrs
- 0 days/yr
Risk factors via First Street. Map © Google.
Why this score? — see what drove the C+ grade
The composite is a weighted blend of 9 inputs, each scored 0–100. Each bar is that input's sub-score; the figure is the points it added to the 100-point composite (weight × sub-score).
- Cash flow +25.2/30.0
- ARV discount +14.5/15.0
- DSCR +8.3/10.0
- 1% rule +5.4/10.0
- Schools +3.1/10.0
- Livability +2.8/5.0
- Rent growth +2.5/5.0
- Condition / age +2.5/5.0
- Appreciation +0.0/10.0
$120,000
🖨 Deal sheet 📄 Offer letter ✓ Due diligence
Listing remarks MLS
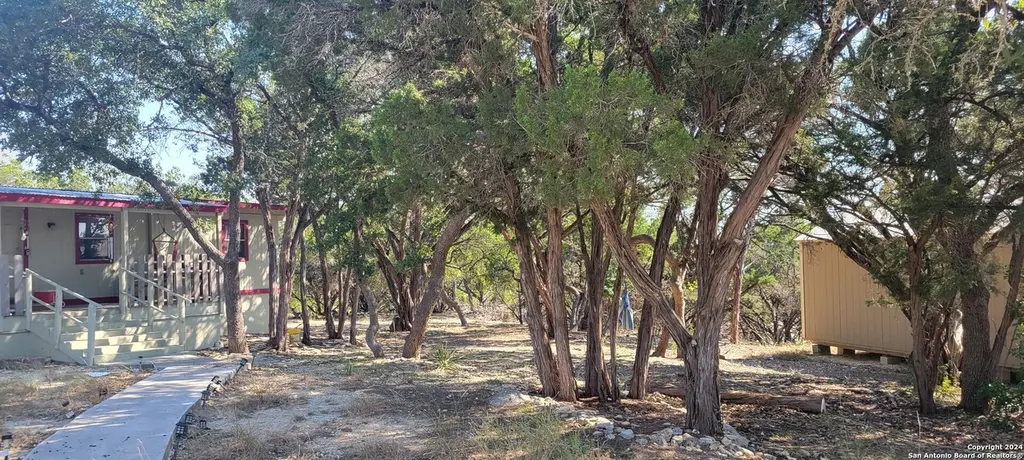
Charming Hill Country Retreat - Perfect Starter Home or Weekend Getaway! Looking to enjoy life in the Hill Country? This super cute manufactured home might be just what you're looking for! Whether you're a first-time buyer or searching for the ideal weekend escape, this property offers a cozy and inviting atmosphere surrounded by nature. Inside, you'll find a split-bedroom layout that provides extra privacy, along with unique touches like wood barn doors and wood-framed windows that add rustic charm. The walls feature wind coating for added character and comfort. Washer and dryer can be included with the right offer. Please note: the back porch may need to be removed or rebuilt. With mature trees all around, the home feels peaceful and private-perfect for relaxing and recharging. Come see it for yourself and fall in love with the potential! Motivated seller - bring your offers!
Key facts
- 9,016 sq ft lot
- Community pool
- Built 1973
Neighborhood map
What this means for you Summary
Snapshot
- This is a 3-bed/2.0-bath manufactured listed at $120k.
Deal economics
- At list price, monthly cash flow is $270 ($3k/yr) — positive.
- The deal already cash-flows at list — no discount required.
- Meets the 1% rule at list price ($1k rent vs $120k).
- Recommended offer: $106k (12.0% below list) — sets the bar for market timing.
- Cap rate 9.0% vs local median 4.8% in Lake Medina Shores — top-decile yield for the area; either an underpriced asset or a hidden risk that comps aren't pricing in. Stress-test before assuming the spread holds.
Location & tenants
- Location reads 56/100 on livability (#1,318 in TX) — a working-class tenant base; expect higher turnover. Strengths: cost of living A+, housing A+, crime A-; Watch: employment D+, schools F, amenities F.
- Bandera ISD (rural): math 30% / reading 41% proficiency, ranked #500 of 826 in TX (top 60%) — families likely to look elsewhere, expect single-tenant / working-renter base with shorter leases.
- Market conditions: 531 active listings in the ZIP; 7 comparable units currently listed for rent nearby; rentals lingering (median 44d on market — plan ~5-8 weeks vacancy on turnover, expect pricing pressure); 57% of comp listings sitting > 30 days — soft ceiling on asking rent; 6 units permitted in Bandera County in 2024 (0 in 5+ unit buildings).
Forward outlook
- Local home prices are declining (-3.0%/yr); year-one equity from $830 of loan paydown is wiped out by about $4k of value loss. Plan a longer hold.
Negotiation context
- It's been on market 611 days — a 12% lower offer ($106k) is reasonable based on typical stale-listing flexibility.
- 11 sale attempts since 14y ago with the ask held roughly flat each time — persistent listings suggest the price (not the market) is what's stuck; bring a comps-based counter.
Risks & watch-outs
- Climate carrying-cost: major wind risk, 57% chance of damaging wind over 30y; extreme-heat days projected 7→20/yr by 2055 (HVAC capex compounding) — expect insurance premiums to compound above CPI over the hold.
Questions for the listing agent
- It's been on market 611 days. Have you received any prior offers? Is the seller open to a 12% concession, seller financing, or rate buy-down credit?
- Built in 1973 — when were the roof, HVAC, electrical panel, plumbing, and water heater last replaced?
- What does the HOA fee cover, when was the last increase, and are there any pending special assessments or reserve-fund shortfalls?
- Why hasn't it sold? Are there any deal-killer items the seller is aware of (foundation, flood, title, zoning, code violations)?
- Is there a deadline driving the sale (1031 exchange, divorce, estate, relocation)? That informs how much negotiation room exists.
- Schools are F-rated, which usually means shorter tenancies and higher turnover. Who's the typical renter profile here, and what's been the actual vacancy rate?
- What's the average days-on-market for RENTAL listings here right now (not sales)? A rising rental-DOM trend means longer vacancies and softer asking-rent achievability than the comps imply.
- What's the recent tenant-quality profile in this submarket — average credit score on applications, eviction rate, late-payment / NSF rate, and stable-employment percentage? A property-management company in the area should have these aggregated.
- How much new for-sale + rental construction is in the pipeline within 1–3 miles? Heavy new supply typically softens prices + rents 12–24 months out; constrained supply supports both.
Investment metrics
- 1% rule
- 1.04% ✓
- Cap rate
- 8.99%
- Cash-on-cash
- 9.63%
- DSCR
- 1.43
- GRM
- 8.0
CMA / ARV
- ARV (median comp)
- $142,241
- List price
- $120,000
- Delta
- -15.64%
- Verdict
- UNDERPRICED
- Comps
- 20 within 1.0 mi
Show comp detail 1 sale within ~0.75 mi
| Address | Dist | Beds/Ba | Sqft | Sold | Price | $/sf | Match |
|---|---|---|---|---|---|---|---|
| 721 Tejas Trl | 0.75mi | 3/2.0 | 1,088 (+4%) | 2mo | $150,000 | $138 | 57 |
Match score weights: distance 35% · size 25% · config 20% · recency 20%. Top-matched comps best support the ARV.
Projected returns pro-forma
-3.0% appreciation · 3.0% rent growth · sell at horizon
- IRR
- -1.8%
- Equity multiple
- 0.93×
- Total profit
- $-2,317
- Equity at exit
- $17,892
- IRR
- 7.8%
- Equity multiple
- 1.59×
- Total profit
- $19,902
- Equity at exit
- $10,375
Cash invested: $33,600 (down + closing). Projections, not guarantees.
Landlord ↔ Tenant lean methodology
- Overall (STATE)
- 87 Strongly Landlord-Friendly
- State Texas
- 87 Strongly Landlord-Friendly · R+5
- County
- — inherits STATE
- City
- — inherits STATE
ZIP-level market 78003
- Home prices YoY
- -14.3%
- Active inventory
- 531
- Price-to-rent
- 8.0×
Monthly cashflow live
- Estimated rent
- $1,251 high interval (Pro) →
- Mortgage (P&I)
- −$629
- Tax from tax record
- −$33 /mo · $398/yr
- Insurance
- −$50
- HOA
- −$6
- Vacancy / Maint / Mgmt
- −$263
- Net cashflow
- $270
Break-even live
UW: 25.0% down · 7.5% · 30yr · 1.5% tax · 5.0% vac · 8.0% maint · 8.0% mgmt
Financing live
Cash to close
- Down payment
- $30,000
- Closing costs
- $3,600
- Reserves months
- —
- Total cash needed
- —
Loan-product check · same deal, 3 products live
Conventional
25% down · 7.5% · 30yr
- Down + closing
- —
- Monthly P&I
- —
- Monthly cashflow
- —
- DSCR
- —
- Eligible?
- —
Personal DTI + credit; lowest rate.
DSCR
20% down · 8.5% · 30yr
- Down + closing
- —
- Monthly P&I
- —
- Monthly cashflow
- —
- DSCR
- —
- Eligible?
- —
No personal income docs; deal must DSCR.
Hard money
10% down · 12.0% · 12mo
- Down + closing
- —
- Monthly P&I
- —
- Monthly cashflow
- —
- DSCR
- —
- Eligible?
- —
Short-term bridge; refi at stabilization.
Rent comps 7 comps
| Address | Beds | Baths | Sqft | Rent | $/sqft | DOM | Units | Dist |
|---|---|---|---|---|---|---|---|---|
| 149 Vint Bonner Dr Unit 149V Bandera, TX | 3.0 | 2.0 | 1250 | $1,150 | $0.92 | 24d | 1 | 0.20mi |
| 535 Oak Lawn Dr Unit 4 Bandera, TX | 2.0 | 1.0 | 800 | $1,175 | $1.47 | 24d | 1 | 0.36mi |
| 551 Oak Lawn Dr Unit 2 Bandera, TX | 3.0 | 2.0 | 1200 | $1,250 | $1.04 | 43d | 1 | 0.37mi |
| 241 Brushy Creek Trl Bandera, TX | 3.0 | 2.0 | 1200 | $1,495 | $1.25 | 7d | 1 | 0.69mi |
| 1110 Grandview Cir Bandera, TX | 2.0 | 2.0 | 1125 | $1,750 | $1.56 | 43d | 1 | 0.99mi |
| 161 Water St Unit A Pipe Creek, TX | 3.0 | 2.0 | 1120 | $1,200 | $1.07 | 43d | 1 | 1.33mi |
| 161 Water St Unit B Pipe Creek, TX | 2.0 | 1.0 | 900 | $1,000 | $1.11 | 43d | 1 | 1.33mi |
HOA detail
- Monthly dues
- $6 · $72/yr
Listing history 47 events
-
2026-06-18days on market $120,000 Active 611 DOM
-
2026-06-17days on market $120,000 Active 610 DOM
-
2026-06-16days on market $120,000 Active 609 DOM
-
2026-06-15days on market $120,000 Active 608 DOM
-
2026-06-13days on market $120,000 Active 606 DOM
-
2026-06-09days on market $120,000 Active 602 DOM
-
2026-06-07days on market $120,000 Active 600 DOM
-
2026-06-04days on market $120,000 Active 597 DOM
-
2026-06-03days on market $120,000 Active 596 DOM
-
2026-06-02days on market $120,000 Active 595 DOM
-
2026-06-01days on market $120,000 Active 594 DOM
-
2026-05-31days on market $120,000 Active 593 DOM
-
2024-10-15$120,000 New 895-char remark
Show marketing remark (895 chars)
Charming Hill Country Retreat - Perfect Starter Home or Weekend Getaway! Looking to enjoy life in the Hill Country? This super cute manufactured home might be just what you're looking for! Whether you're a first-time buyer or searching for the ideal weekend escape, this property offers a cozy and inviting atmosphere surrounded by nature. Inside, you'll find a split-bedroom layout that provides extra privacy, along with unique touches like wood barn doors and wood-framed windows that add rustic charm. The walls feature wind coating for added character and comfort. Washer and dryer can be included with the right offer. Please note: the back porch may need to be removed or rebuilt. With mature trees all around, the home feels peaceful and private-perfect for relaxing and recharging. Come see it for yourself and fall in love with the potential! Motivated seller - bring your offers!
-
2024-06-28historical
-
2023-06-22$120,000 New
-
2023-05-16historical
-
2022-10-13price $123,500
-
2022-09-09price $126,543
-
2022-09-09price $14,997
-
2022-05-12price $126,543
-
2021-09-18price $112,000
-
2021-08-05price $100,000
-
2021-07-09price $110,000
-
2021-05-15$115,000 New
-
2021-04-26historical
-
2021-03-16$115,000 New
-
2019-09-04soldstatus
-
2019-08-29soldstatus Sold
-
2019-08-29soldstatus
-
2019-08-15status Pending
-
2019-08-01historical Active Option
-
2019-07-11status Back on Market
-
2019-07-11$79,900
-
2019-07-10$79,900 New
-
2019-07-10historical
-
2018-03-29soldstatus Sold
-
2018-03-29soldstatus
-
2018-03-22status Pending
-
2018-03-13price $25,000
-
2018-01-08$29,000 New
-
2018-01-02$25,000
-
2013-09-09historical
-
2013-07-22price $9,999 Price Change
-
2013-07-18status Back on Market
-
2013-04-10historical
-
2012-02-15$15,900
-
1993-03-01soldstatus
ⓘ Source: listings_history table (triggers on properties + properties_extension) + one-shot
backfill from property_details.listing_events for pre-trigger history.
Tax reassessment forecast TX · Resets to sale price
- Current annual tax
- $398 · $33/mo
- Projected year-2 tax
- $2,196 · $183/mo
- Expected delta
- +$1,798/yr (+$150/mo · 451.1%)
ⓘ Screening estimate from a state-policy table — verify with the county assessor before closing.
Climate risk First Street
- Flood 1/10 Low FEMA zone X (unshaded) · 0% chance over 30 yrs
- Wildfire 4/10 Moderate
- Heat 7/10 Severe 7 d/yr ≥107°F today · 20 d/yr by 30 yrs out
- Wind 6/10 Major 57% chance of damaging wind over 30 yrs
- Air quality 1/10 Low 0 unhealthy d/yr today · 0 by 30 yrs out
Nearby sold comps map
Loading sold comps map…
Walkable amenities ~0.75 mi
Loading nearby amenities…
Taxation est. · year 1
- Rental income
- $15,011
- − Mortgage interest
- −$6,722
- − Property taxes
- −$398
- − Insurance
- −$600
- − Repairs & maintenance
- −$1,201
- − Management
- −$1,201
- − HOA
- −$72
- − Depreciation
- −$3,491
- Taxable income
- $1,326
- Est. tax owed @ 24.0%
- −$318
- After-tax cash flow
- $2,918/yr
For passive investors: Depreciation is non-cash, so a rental often shows a tax loss while cash-flowing — sheltering income. Rental losses are passive: they offset passive income freely, and up to $25,000/yr can offset ordinary (W-2) income if you actively participate and your MAGI is under $100k (phasing out to $0 by $150k); unused losses carry forward. On sale, claimed depreciation is recaptured at up to 25%, and gains may owe capital-gains tax (a 1031 exchange can defer both). Figures are a year-1 estimate at your 24.0% rate — not tax advice; consult a CPA.
Schools (NCES district)
- District
- Bandera ISD
- NCES district ID
- 4809360
- Math proficiency
- 30% ▼ -7.00%
- Reading proficiency
- 41% ▼ -3.00%
- Median HH income
- $48,771
- Composite
- 30.61/100
- National rank
- #6194
- State rank
- #500 of 826 in TX
Livability — Lake Medina Shores
- Score
- 56/100
- State rank
- #1318
- US rank
- #22715
Category grades
Schools grade is shown separately in the Schools card above.
Census & demographics
- Census place
- Lake Medina Shores, TX
- Population (ZIP)
- 9,594
Population outlook (Bandera County) Hauer SSP2
- Today (2025)
- 22,614 people
- By 2030
- 23,102 · +2.2%
- By 2040
- 23,489 · +3.9%
- By 2050
- 23,264 · +2.9%
- By 2075
- 23,607 · +4.4%
- By 2100
- 22,265 · -1.5%
Race, ethnicity, and origin ACS 2023
- Neighborhood character
- Predominantly White (74%)
- Race & ethnicity
- White 74% Hispanic / Latino 21% Two or more races 15% Native American 1%
- Hispanic origin (detail)
- Mexican 17%
- Common ancestry
- Lithuanian 3% Serbian 3% Romanian 2%
- Foreign-born
- 4% · Canada, Jamaica
- Languages at home
- 85% English-only · Spanish 14% German/W. Germanic 1%
Political lean MEDSL · Bandera
- 2024 margin
- Solid R (+61.9) · D 18.6% · R 80.5%
- 2008→2024 swing
- -11.5pp toward R · 2008: -50.4pp · 2024: -61.9pp
- All cycles
- 2024: R+61.9 2020: R+59.4 2016: R+63.0 2012: R+59.0 2008: R+50.4
Not yet ingested
- Civics
- —
Market trends
- HPI YoY
- ▼ -35.80%
- Current HPI
- 215.0687
- Rent YoY
- —
- Metro
- —
- State GDP YoY
- ▲ 3.95%
- F500 in state
- 110
Industry mix (Fortune 500 HQ in TX)
| Industry | F500 HQs | Revenue |
|---|---|---|
| Energy | 16 | $1,198B |
|
||
| Technology | 5 | $198B |
|
||
| Engineering / Construction | 4 | $72B |
|
||
| Energy Services | 3 | $60B |
|
||
| Utilities | 3 | $41B |
|
||
| Healthcare | 2 | $330B |
|
||
Price history
+654.7% since first listed35 events — show timeline
- 2024-10-15 Listed $120,000 LERA
- 2024-06-28 Listing Removed — LERA
- 2023-06-22 Listed $120,000 LERA
- 2023-05-16 Listing Removed — LERA
- 2022-10-13 Price Changed $123,500 LERA
- 2022-09-09 Price Changed $126,543 LERA
- 2022-09-09 Price Changed $14,997 LERA
- 2022-05-12 Price Changed $126,543 LERA
- 2021-09-18 Price Changed $112,000 LERA
- 2021-08-05 Price Changed $100,000 LERA
- 2021-07-09 Price Changed $110,000 LERA
- 2021-05-15 Listed $115,000 LERA
- 2021-04-26 Listing Removed — LERA
- 2021-03-16 Listed $115,000 LERA
- 2019-09-04 Sold (Public Records) — Public Records
- 2019-08-29 Sold (MLS) — LERA
- 2019-08-29 Sold (MLS) — KVMLS
- 2019-08-15 Pending — LERA
- 2019-08-01 Contingent — LERA
- 2019-07-11 Relisted — LERA
- 2019-07-11 Listed $79,900 KVMLS
- 2019-07-10 Listing Removed — LERA
- 2019-07-10 Listed $79,900 LERA
- 2018-03-29 Sold (MLS) — LERA
- 2018-03-29 Sold (MLS) — KVMLS
- 2018-03-22 Pending — LERA
- 2018-03-13 Price Changed $25,000 LERA
- 2018-01-08 Listed $29,000 LERA
- 2018-01-02 Listed $25,000 KVMLS
- 2013-09-09 Listing Removed — LERA
- 2013-07-22 Price Changed $9,999 LERA
- 2013-07-18 Relisted — LERA
- 2013-04-10 Listing Removed — LERA
- 2012-02-15 Listed $15,900 LERA
- 1993-03-01 Sold (Public Records) — Public Records
Property tax history
+1.7%/yrLatest (2025): $398 · +11.1% YoY. Source: county tax records.
Cash-flow waterfall
monthlySold comps — $/sqft
last 12 mo · ≤1 miLoading sold comps…