 Triplex
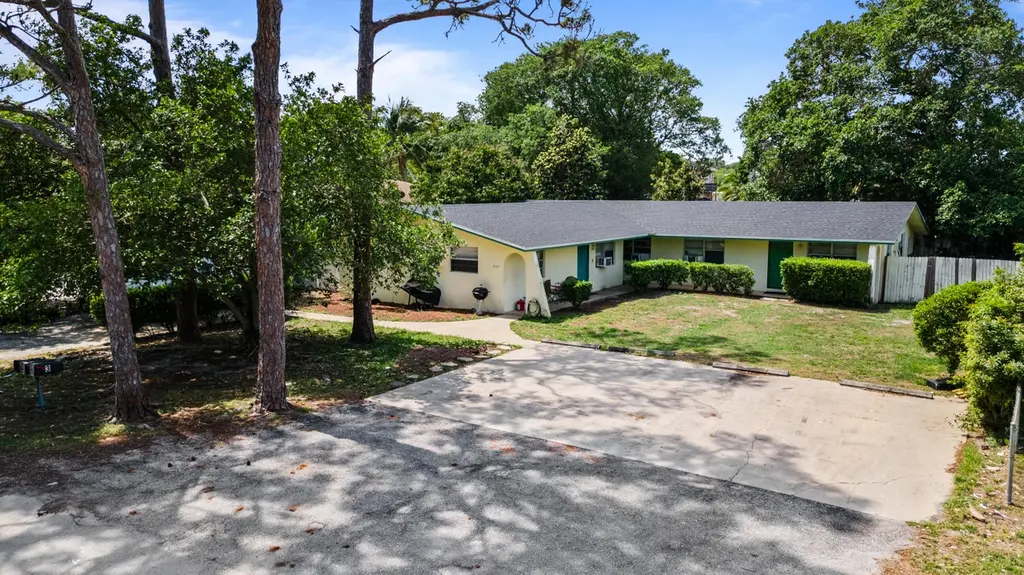
4453 Stevens Rd · Palm Springs, FL
Flood risk 1/10 · Minimal
- FEMA flood zone
- X (unshaded)
- Chance of flooding over 30 yrs
- 0.0%
- Est. flood insurance / yr
- $507 – $1,088
Fire risk 1/10 · Minimal
- Est. fire insurance / yr
- $947 – $1,759
Heat risk 10/10 · Severe
- Hot days now (above 105°F)
- 7 days/yr
- Hot days in 30 yrs
- 27 days/yr
Wind risk 10/10 · Severe
- Chance of severe wind over 30 yrs
- 99.0%
Air-quality risk 2/10 · Minimal
- Unhealthy air days now
- 0 days/yr
- Unhealthy air days in 30 yrs
- 2 days/yr
Risk factors via First Street. Map © Google.
Why this score? — see what drove the D grade
The composite is a weighted blend of 9 inputs, each scored 0–100. Each bar is that input's sub-score; the figure is the points it added to the 100-point composite (weight × sub-score).
- Cash flow +14.1/30.0
- ARV discount +7.5/15.0
- DSCR +4.3/10.0
- Schools +4.3/10.0
- 1% rule +3.9/10.0
- Livability +3.7/5.0
- Condition / age +2.5/5.0
- Rent growth +1.9/5.0
- Appreciation +0.0/10.0
$690,000
🖨 Deal sheet (PDF) 📄 Offer letter ✓ Due diligence
Multi-family units
County records classify this as Multi-Family (2-4 Unit). Listing-text estimate: 3 units. confirmed
Listing remarks MLS
This is a short sale. It has been approved for 150K.Ready to close, good investment, all units rented,there is parking for 8 cars and fully fenced.
Key facts
- Three separate units
- No hoa
- New roof
Tags
Property features AI
Finance
- Other: Lot size approximately 0.35 acre; Publicly maintained road access; Not waterfront
- Financial info: Four total units; Tenants pay cable TV, electricity, and water; Pets allowed with no restrictions; Three units in the community; No land lease
Exterior
- Utilities: Well water; Septic tank sewer; Cable available; Electricity available; Water available; Three separate electric meters; Three separate water meters
- Home design: Triplex; One story; Resale property; Located on a city street west of US-1
- Construction: CBS construction; Composition roof; Building area about 3,104 total (public records); Living area about 2,576
- Exterior features: Open patio; Patio
Interior
- Flooring: Ceramic tile
- Heating & cooling: Window/wall heating; Wall/window cooling units
- Interior features: Ceramic tile flooring
Neighborhood map
What this means for you Summary
Snapshot
- This is a 3 × 2-bed/1-bath units multifamily listed at $690k.
Deal economics
- At list price, monthly cash flow is $106 ($1k/yr) — positive. Per door: $35/mo.
- The deal already cash-flows at list — no discount required.
- To meet the 1% rule (rent ≥ 1% of price), the offer needs to be $613k (11.1% below list).
- Recommended offer: $613k (11.1% below list) — sets the bar for 1% rule.
Location & tenants
- Location reads 73/100 on livability (#297 in FL) — a middle-class / working-renter tenant base. Strengths: cost of living A+, housing A+, health & safety A; Watch: employment D+, amenities F, commute F.
- Palm Beach (suburban): math 46% / reading 53% proficiency, ranked #34 of 73 in FL (top 47%) — families likely to look elsewhere, expect single-tenant / working-renter base with shorter leases.
- Zoned schools: Palm Springs Elementary School (math 27% / reading 32%, grade F, #1,896 of 2,144 statewide, top 90%, 1,010 students, 79% FRL); Lake Worth Community Middle (math 17% / reading 23%, grade F, #558 of 571 statewide, top 98%, 1,249 students, 75% FRL); Lake Worth High School (math 16% / reading 27%, grade F, #546 of 667 statewide, top 82%, 2,683 students, 71% FRL) — zoned schools average 75% FRL vs 52% district-wide (23 pts higher); higher-poverty schools than district average — tighter screening recommended.
- Zoned-school proficiency averages 24% at this address vs 50% district-wide (-26 pts) — the specific schools serving this property underperform the Palm Beach average; the district grade overstates school quality for this exact location.
- Market conditions: Rents soft (-2.5%/yr); 276 active listings in the ZIP; 5 comparable units currently listed for rent nearby; rentals at typical pace (median 26d on market — plan ~3-4 weeks tenant-placement turnaround); 3,974 units permitted in Palm Beach County in 2024 (1,012 in 5+ unit buildings).
- At $6,133/mo this rent would consume 119% of the median local household income ($62k/yr) (locally 2663% of renters already pay >50% of income on rent) — very limited rent-growth headroom before tenants either downsize or default.
Forward outlook
- Local home prices are declining (-3.0%/yr); year-one equity from $5k of loan paydown is wiped out by about $21k of value loss. Plan a longer hold.
- Palm Beach County population projected at +30% by 2050 — long-run rental-demand tailwind backs the buy-and-hold thesis.
Negotiation context
- It's been on market 26 days — a 2% lower offer ($680k) is reasonable based on typical stale-listing flexibility.
- 8 sale attempts since 24y ago with the ask held roughly flat each time — persistent listings suggest the price (not the market) is what's stuck; bring a comps-based counter.
- Current owner paid $100k; list at $690k implies a 590% gain — meaningful room to come down on a strong offer.
Risks & watch-outs
- Climate carrying-cost: severe wind risk, 99% chance of damaging wind over 30y; extreme-heat days projected 7→27/yr by 2055 (HVAC capex compounding) — expect insurance premiums to compound above CPI over the hold.
Questions for the listing agent
- Can we see the unit-by-unit rent roll, current vacancy, and any below-market leases? What's the average tenancy length?
- What capital expenditures (roof, boiler, parking lot, exteriors) have been made in the last 5 years, and what's planned in the next 2?
- Built in 1977 — when were the roof, HVAC, electrical panel, plumbing, and water heater last replaced?
- Is there a deadline driving the sale (1031 exchange, divorce, estate, relocation)? That informs how much negotiation room exists.
- Schools are D-rated, which usually means shorter tenancies and higher turnover. Who's the typical renter profile here, and what's been the actual vacancy rate?
- The area grade is low — what's the realistic commute time and amenity access for the typical tenant pool here? Any planned neighborhood developments (good or bad) we should know about?
- What's the average days-on-market for RENTAL listings here right now (not sales)? A rising rental-DOM trend means longer vacancies and softer asking-rent achievability than the comps imply.
- What's the recent tenant-quality profile in this submarket — average credit score on applications, eviction rate, late-payment / NSF rate, and stable-employment percentage? A property-management company in the area should have these aggregated.
- How much new apartment / multifamily construction is in the pipeline within 1–3 miles? Heavy new supply (>2% of stock underway) typically softens rents 12–24 months out; light construction supports rent growth.
Investment metrics
- 1% rule
- 0.89% ✗
- Cap rate
- 6.48%
- Cash-on-cash
- 0.66%
- DSCR
- 1.03
- GRM
- 9.4
CMA / ARV
No comps found within radius.
Projected returns pro-forma
-3.0% appreciation · 0.0% rent growth · sell at horizon
- IRR
- -18.6%
- Equity multiple
- 0.36×
- Total profit
- $-122,968
- Equity at exit
- $102,881
- IRR
- -18.6%
- Equity multiple
- 0.13×
- Total profit
- $-167,557
- Equity at exit
- $59,659
Cash invested: $193,200 (down + closing). Projections, not guarantees.
Landlord ↔ Tenant lean methodology
- Overall (STATE)
- 87 Strongly Landlord-Friendly
- State Florida
- 87 Strongly Landlord-Friendly · R+3
- County
- — inherits STATE
- City
- — inherits STATE
ZIP-level market 33461
- Rents YoY
- -2.5%
- Active inventory
- 276
- Price-to-rent
- 28.1×
Monthly cashflow live
- Estimated rent
- $6,133 high interval (Pro) →
- Mortgage (P&I)
- −$3,618
- Tax from tax record
- −$833 /mo · $10,000/yr
- Insurance
- −$288
- HOA
- −$0
- Vacancy / Maint / Mgmt
- −$1,288
- Net cashflow
- $106
Break-even live
Sensitivity live
| Price | -10% $496 | -5% $301 | +0% $106 | +5% $-89 | +10% $-285 |
|---|---|---|---|---|---|
| Rent | -10% $-379 | -5% $-136 | +0% $106 | +5% $348 | +10% $590 |
| Rate | -1.0pp $453 | -0.5pp $281 | base $106 | +0.5pp $-73 | +1.0pp $-255 |
3-unit breakdown (identical units grouped — click to expand)
| Units | Beds | Baths | Est. rent |
|---|---|---|---|
| 3× units | 2 | 1 | $6,132 |
| #1 | 2 | 1 | $2,044 |
| #2 | 2 | 1 | $2,044 |
| #3 | 2 | 1 | $2,044 |
| Total (3 units) | $6,133 | ||
UW: 25.0% down · 7.5% · 30yr · 1.5% tax · 5.0% vac · 8.0% maint · 8.0% mgmt
Financing live
Cash to close
- Down payment
- $172,500
- Closing costs
- $20,700
- Reserves months
- —
- Total cash needed
- —
Loan-product check · same deal, 3 products live
Conventional
25% down · 7.5% · 30yr
- Down + closing
- —
- Monthly P&I
- —
- Monthly cashflow
- —
- DSCR
- —
- Eligible?
- —
Personal DTI + credit; lowest rate.
DSCR
20% down · 8.5% · 30yr
- Down + closing
- —
- Monthly P&I
- —
- Monthly cashflow
- —
- DSCR
- —
- Eligible?
- —
No personal income docs; deal must DSCR.
Hard money
10% down · 12.0% · 12mo
- Down + closing
- —
- Monthly P&I
- —
- Monthly cashflow
- —
- DSCR
- —
- Eligible?
- —
Short-term bridge; refi at stabilization.
Rent comps 5 comps
| Address | Beds | Baths | Sqft | Rent | $/sqft | DOM | Units | Dist |
|---|---|---|---|---|---|---|---|---|
| 4425 Steven Rd Lake Worth, FL | 5.0 | 3.0 | 2304 | $2,900 | $1.26 | 26d | 1 | 0.06mi |
| 4820 Vermont Ave Lake Worth, FL | 5.0 | 3.0 | 1948 | $5,500 | $2.82 | 1d | 1 | 0.25mi |
| 417 N Country Club Dr Lake Worth, FL | 4.0 | 3.5 | 2868 | $7,250 | $2.53 | 26d | 1 | 0.95mi |
| 5029 Starblaze Dr Greenacres, FL | 4.0 | 2.5 | 2077 | $3,500 | $1.69 | 24d | 1 | 1.39mi |
| 5049 Starblaze Dr Greenacres, FL | 4.0 | 2.5 | 2077 | $3,100 | $1.49 | 26d | 1 | 1.46mi |
Listing history 40 events
-
2026-06-21days on market $690,000 Active 26 DOM
-
2026-06-18days on market $690,000 Active 23 DOM
-
2026-06-17days on market $690,000 Active 22 DOM
-
2026-06-16days on market $690,000 Active 21 DOM
-
2026-06-15days on market $690,000 Active 20 DOM
-
2026-06-13days on market $690,000 Active 18 DOM
-
2026-06-09days on market $690,000 Active 14 DOM
-
2026-06-08days on market $690,000 Active 13 DOM
-
2026-06-07days on market $690,000 Active 12 DOM
-
2026-06-04days on market $690,000 Active 9 DOM
-
2026-06-03days on market $690,000 Active 8 DOM
-
2026-06-02days on market $690,000 Active 7 DOM
-
2026-06-01days on market $690,000 Active 6 DOM
-
2026-05-31days on market $690,000 Active 5 DOM
-
2026-05-26$690,000 Active
-
2011-09-27soldstatus $100,000
-
2011-09-22soldstatus $100,000 147-char remark
Show marketing remark (147 chars)
This is a short sale. It has been approved for 150K.Ready to close, good investment, all units rented,there is parking for 8 cars and fully fenced.
-
2011-08-24historical 147-char remark
Show marketing remark (147 chars)
This is a short sale. It has been approved for 150K.Ready to close, good investment, all units rented,there is parking for 8 cars and fully fenced.
-
2010-06-14$120,000 147-char remark
Show marketing remark (147 chars)
This is a short sale. It has been approved for 150K.Ready to close, good investment, all units rented,there is parking for 8 cars and fully fenced.
-
2010-06-12historical
-
2009-04-30$183,000
-
2009-03-11historical
-
2008-12-01historical
-
2008-03-11$260,000
-
2007-11-30$349,000
-
2005-01-24soldstatus $335,000
-
2005-01-11soldstatus $335,000
-
2004-12-06historical
-
2004-10-10$345,000
-
2003-12-02soldstatus $265,000
-
2003-11-20soldstatus $265,000
-
2003-10-01historical
-
2003-08-07$269,999
-
2003-02-25soldstatus $179,900
-
2003-02-14soldstatus $179,900
-
2002-12-13historical
-
2002-01-15$179,900
-
1987-12-01soldstatus $129,000
-
1987-01-01soldstatus $129,000
-
1986-12-01soldstatus $129,000
ⓘ Source: listings_history table (triggers on properties + properties_extension) + one-shot
backfill from property_details.listing_events for pre-trigger history.
Tax reassessment forecast FL · Resets to sale price
- Current annual tax
- $10,000 · $833/mo
- Projected year-2 tax
- $10,000 · $833/mo
- Expected delta
- $0/yr ($0/mo · 0.0%)
ⓘ Screening estimate from a state-policy table — verify with the county assessor before closing.
Climate risk First Street
- Flood 1/10 Low FEMA zone X (unshaded) · 0% chance over 30 yrs
- Wildfire 1/10 Low
- Heat 10/10 Extreme 7 d/yr ≥105°F today · 27 d/yr by 30 yrs out
- Wind 10/10 Extreme 99% chance of damaging wind over 30 yrs
- Air quality 2/10 Low 0 unhealthy d/yr today · 2 by 30 yrs out
Nearby sold comps map
Loading sold comps map…
Walkable amenities ~0.75 mi
Loading nearby amenities…
Taxation est. · year 1
- Rental income
- $73,596
- − Mortgage interest
- −$38,651
- − Property taxes
- −$10,000
- − Insurance
- −$3,450
- − Repairs & maintenance
- −$5,888
- − Management
- −$5,888
- − Depreciation
- −$20,073
- Taxable loss
- −$10,353
- Est. tax savings @ 24.0%
- +$2,485
- After-tax cash flow
- $3,754/yr
For passive investors: Depreciation is non-cash, so a rental often shows a tax loss while cash-flowing — sheltering income. Rental losses are passive: they offset passive income freely, and up to $25,000/yr can offset ordinary (W-2) income if you actively participate and your MAGI is under $100k (phasing out to $0 by $150k); unused losses carry forward. On sale, claimed depreciation is recaptured at up to 25%, and gains may owe capital-gains tax (a 1031 exchange can defer both). Figures are a year-1 estimate at your 24.0% rate — not tax advice; consult a CPA.
Schools (NCES district)
- District
- Palm Beach
- NCES district ID
- 1201500
- Math proficiency
- 46% ▼ -16.00%
- Reading proficiency
- 53% ▼ -4.00%
- Median HH income
- $53,943
- Composite
- 42.72/100
- National rank
- #3160
- State rank
- #34 of 73 in FL
Livability — Palm Springs
- Score
- 73/100
- State rank
- #297
- US rank
- #5045
Category grades
Schools grade is shown separately in the Schools card above.
Census & demographics
- County
- Palm Beach County · 1,438,312 people
- City population
- 49,443
- Metro
- Miami-Fort Lauderdale-Pompano Beach, FL
- Population (ZIP)
- 49,443
- Household income
- $61,963
- Rent vs Own
- Severe rent burden
- 2663.0
Population outlook (Palm Beach County) Hauer SSP2
- Today (2025)
- 1,637,487 people
- By 2030
- 1,743,255 · +6.5%
- By 2040
- 1,948,712 · +19.0%
- By 2050
- 2,132,979 · +30.3%
- By 2075
- 2,530,027 · +54.5%
- By 2100
- 2,706,979 · +65.3%
Race, ethnicity, and origin ACS 2023
- Neighborhood character
- Diverse neighborhood (Simpson 0.59)
- Race & ethnicity
- Hispanic / Latino 59% Two or more races 26% White 20% Black 17% Asian 2%
- Hispanic origin (detail)
- Mexican 11% Puerto Rican 6% Cuban 16% Dominican 2%
- Common ancestry
- Hispanic 9% Romanian 1% Lithuanian 1%
- Foreign-born
- 52% · Canada, Jamaica
- Languages at home
- 31% English-only · Spanish 54% French/Haitian/Cajun 10% Other Indo-European 2%
Political lean MEDSL · Palm Beach
- 2024 margin
- Toss-up / Even · D 50.0% · R 49.2%
- 2008→2024 swing
- -22.1pp toward R · 2008: 22.9pp · 2024: 0.8pp
- All cycles
- 2024: D+0.8 2020: D+12.8 2016: D+15.3 2012: D+17.0 2008: D+22.9
Not yet ingested
- Civics
- —
Market trends
- HPI YoY
- ▼ -269.03%
- Current HPI
- 493.0041
- Rent YoY
- ▼ -2.47%
- Metro
- Miami-Fort Lauderdale-Pompano Beach, FL
- State GDP YoY
- ▲ 3.28%
- F500 in state
- 36
Industry mix (Fortune 500 HQ in FL)
| Industry | F500 HQs | Revenue |
|---|---|---|
| Industrial Technology | 2 | $29B |
|
||
| Insurance | 2 | $17B |
|
||
| Retail | 1 | $60B |
|
||
| Technology Distribution | 1 | $58B |
|
||
| Homebuilding | 1 | $35B |
|
||
| Technology Manufacturing | 1 | $35B |
|
||
Price history
+434.9% since first listed26 events — show timeline
- 2026-05-26 Listed $690,000 Beaches MLS
- 2011-09-27 Sold (Public Records) $100,000 Public Records
- 2011-09-22 Sold (MLS) $100,000 Beaches MLS
- 2011-08-24 Listing Removed — Beaches MLS
- 2010-06-14 Listed $120,000 Beaches MLS
- 2010-06-12 Listing Removed — Beaches MLS
- 2009-04-30 Listed $183,000 Beaches MLS
- 2009-03-11 Listing Removed — Beaches MLS
- 2008-12-01 Listing Removed — Beaches MLS
- 2008-03-11 Listed $260,000 Beaches MLS
- 2007-11-30 Listed $349,000 Beaches MLS
- 2005-01-24 Sold (Public Records) $335,000 Public Records
- 2005-01-11 Sold (MLS) $335,000 Beaches MLS
- 2004-12-06 Listing Removed — Beaches MLS
- 2004-10-10 Listed $345,000 Beaches MLS
- 2003-12-02 Sold (Public Records) $265,000 Public Records
- 2003-11-20 Sold (MLS) $265,000 Beaches MLS
- 2003-10-01 Listing Removed — Beaches MLS
- 2003-08-07 Listed $269,999 Beaches MLS
- 2003-02-25 Sold (Public Records) $179,900 Public Records
- 2003-02-14 Sold (MLS) $179,900 Beaches MLS
- 2002-12-13 Listing Removed — Beaches MLS
- 2002-01-15 Listed $179,900 Beaches MLS
- 1987-12-01 Sold (Public Records) $129,000 Public Records
- 1987-01-01 Sold (Public Records) $129,000 Public Records
- 1986-12-01 Sold (Public Records) $129,000 Public Records
Property tax history
+9.0%/yrLatest (2025): $10,000 · +11.5% YoY. Source: county tax records.
Cash-flow waterfall
monthlySold comps — $/sqft
last 12 mo · ≤1 miLoading sold comps…