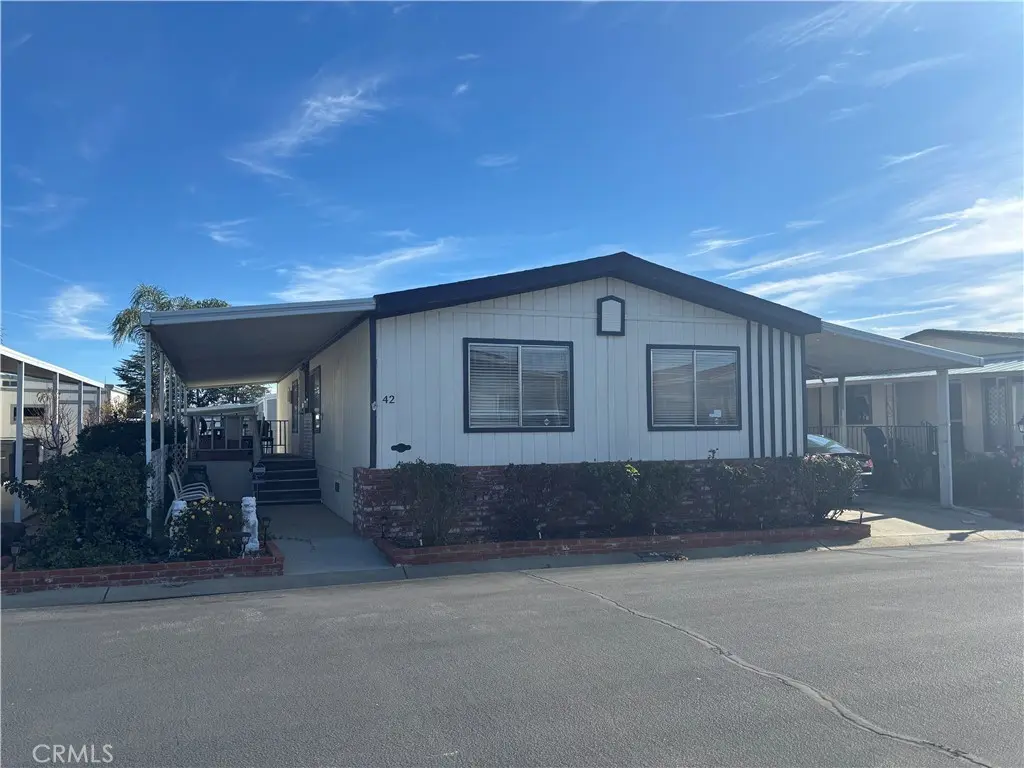
5700 W Wilson #42 · Banning, CA
Flood risk 1/10 · Minimal
- FEMA flood zone
- X (unshaded)
- Chance of flooding over 30 yrs
- 0.0%
- Est. flood insurance / yr
- $507 – $1,088
Fire risk 10/10 · Severe
- Est. fire insurance / yr
- $659 – $1,223
Heat risk 6/10 · Moderate
- Hot days now (above 101°F)
- 6 days/yr
- Hot days in 30 yrs
- 16 days/yr
Wind risk 1/10 · Minimal
- Chance of severe wind over 30 yrs
- —
Air-quality risk 8/10 · Major
- Unhealthy air days now
- 18 days/yr
- Unhealthy air days in 30 yrs
- 23 days/yr
Risk factors via First Street. Map © Google.
Why this score? — see what drove the B grade
The composite is a weighted blend of 9 inputs, each scored 0–100. Each bar is that input's sub-score; the figure is the points it added to the 100-point composite (weight × sub-score).
- Cash flow +30.0/30.0
- 1% rule +10.0/10.0
- DSCR +10.0/10.0
- ARV discount +9.2/15.0
- Schools +4.0/10.0
- Rent growth +3.4/5.0
- Condition / age +2.5/5.0
- Livability +2.4/5.0
- Appreciation +0.0/10.0
$115,000
🖨 Deal sheet 📄 Offer letter ✓ Due diligence
Listing remarks MLS
This Home is Located in the Linda Vista community which is an All Ages Mobile park, Home offers 3 Bedroom and 2 baths, the floor plan it's a split plan where the Primary bedroom is on one end and the other two at the other end, > The community has many things to offer to residents like swimming pool, hot tub, sauna, dog park, club house, Pickleball courts, Shuffleboard, firepit and picnic area, the Club house offer events for different age groups. Access to freeways and services are just a short distance away. Home is located near club house.
Key facts
- Gated community
- Dog park
- Clubhouse
Tags
Neighborhood map
What this means for you Summary
Snapshot
- This is a 2-bed/2.0-bath manufactured listed at $115k.
Deal economics
- At list price, monthly cash flow is $898 ($11k/yr) — positive.
- The deal already cash-flows at list — no discount required.
- Meets the 1% rule at list price ($2k rent vs $115k).
- Recommended offer: $113k (1.5% below list) — sets the bar for market timing.
- Cap rate 15.7% vs local median 3.0% in Banning — top-decile yield for the area; either an underpriced asset or a hidden risk that comps aren't pricing in. Stress-test before assuming the spread holds.
Location & tenants
- Location reads 48/100 on livability (#1,192 in CA) — a working-class tenant base; expect higher turnover. Strengths: housing B+; Watch: crime C-, schools F, amenities F.
- Beaumont Unified (suburban): math 32% / reading 60% proficiency, ranked #168 of 517 in CA (top 32%) — families likely to look elsewhere, expect single-tenant / working-renter base with shorter leases.
- Market conditions: Rents rising (+3.6%/yr); 312 active listings in the ZIP; 9 comparable units currently listed for rent nearby; rentals at typical pace (median 15d on market — plan ~3-4 weeks tenant-placement turnaround); 9,195 units permitted in Riverside County in 2024 (1,512 in 5+ unit buildings).
- This rent runs 38% of the median local income ($63k/yr) — at the standard rent-burdened threshold; future hikes will face affordability resistance.
Forward outlook
- Local home prices are declining (-3.0%/yr); year-one equity from $795 of loan paydown is wiped out by about $3k of value loss. Plan a longer hold.
- Riverside County population projected at +22% by 2050 — long-run rental-demand tailwind backs the buy-and-hold thesis.
- At projected returns (-3.0% appreciation + 3.6% rent growth), your $32k cash investment doubles in ~4 years — after that, you're playing with house money.
Negotiation context
- It's been on market 20 days — a 2% lower offer ($113k) is reasonable based on typical stale-listing flexibility.
- 11 sale attempts since 21y ago with the ask held roughly flat each time — persistent listings suggest the price (not the market) is what's stuck; bring a comps-based counter.
- Current owner paid $10k; list at $115k implies a 995% gain — meaningful room to come down on a strong offer.
Risks & watch-outs
- Climate carrying-cost: severe wildfire risk; extreme-heat days projected 6→16/yr by 2055 (HVAC capex compounding) — expect insurance premiums to compound above CPI over the hold.
Questions for the listing agent
- Is there a deadline driving the sale (1031 exchange, divorce, estate, relocation)? That informs how much negotiation room exists.
- Schools are F-rated, which usually means shorter tenancies and higher turnover. Who's the typical renter profile here, and what's been the actual vacancy rate?
- What's the average days-on-market for RENTAL listings here right now (not sales)? A rising rental-DOM trend means longer vacancies and softer asking-rent achievability than the comps imply.
- What's the recent tenant-quality profile in this submarket — average credit score on applications, eviction rate, late-payment / NSF rate, and stable-employment percentage? A property-management company in the area should have these aggregated.
- How much new for-sale + rental construction is in the pipeline within 1–3 miles? Heavy new supply typically softens prices + rents 12–24 months out; constrained supply supports both.
Investment metrics
- 1% rule
- 1.73% ✓
- Cap rate
- 15.66%
- Cash-on-cash
- 33.46%
- DSCR
- 2.49
- GRM
- 4.8
CMA / ARV
- ARV (median comp)
- $119,512
- List price
- $115,000
- Delta
- -3.77%
- Verdict
- FAIR
- Comps
- 20 within 1.0 mi
Show comp detail 12 sales within ~0.75 mi
| Address | Dist | Beds/Ba | Sqft | Sold | Price | $/sf | Match |
|---|---|---|---|---|---|---|---|
| 5700 W Wilson St #128 | 0.00mi | 2/2.0 | 1,248 (0%) | 12mo | $132,500 | $106 | 90 |
| 5700 W Wilson St #117 | 0.00mi | 2/2.0 | 1,248 (0%) | 13mo | $129,000 | $103 | 89 |
| 5700 W WILSON St #64 | 0.00mi | 2/2.0 | 1,248 (0%) | 21mo | $135,000 | $108 | 82 |
| 5700 W WILSON St #1 | 0.11mi | 2/2.0 | 1,344 (+8%) | 0mo | $130,000 | $97 | 82 |
| 5700 W Wilson St #19 | 0.10mi | 3/2.0 (+1) | 1,248 (0%) | 12mo | $131,500 | $105 | 81 |
| 5700 W WILSON St #65 | 0.10mi | 2/2.0 | 1,248 (0%) | 22mo | $115,000 | $92 | 77 |
| 5700 W Wilson St #99 | 0.00mi | 3/2.0 (+1) | 1,344 (+8%) | 8mo | $125,000 | $93 | 76 |
| 5700 W Wilson St #29 | 0.00mi | 3/2.0 (+1) | 1,152 (-8%) | 11mo | $124,000 | $108 | 73 |
| 5700 W Wilson St #57 | 0.00mi | 2/2.0 | 1,344 (+8%) | 18mo | $110,000 | $82 | 72 |
| 5700 W Wilson St #90 | 0.00mi | 2/2.0 | 1,344 (+8%) | 19mo | $130,000 | $97 | 72 |
| 5700 W Wilson St #37 | 0.00mi | 2/2.0 | 1,344 (+8%) | 20mo | $65,000 | $48 | 70 |
| 5700 W WILSON St #119 | 0.07mi | 2/2.0 | 1,344 (+8%) | 19mo | $138,500 | $103 | 68 |
Match score weights: distance 35% · size 25% · config 20% · recency 20%. Top-matched comps best support the ARV.
Projected returns pro-forma
-3.0% appreciation · 3.58% rent growth · sell at horizon
- IRR
- 29.3%
- Equity multiple
- 2.23×
- Total profit
- $39,667
- Equity at exit
- $17,147
- IRR
- 36.9%
- Equity multiple
- 4.50×
- Total profit
- $112,832
- Equity at exit
- $9,943
Cash invested: $32,200 (down + closing). Projections, not guarantees.
Landlord ↔ Tenant lean methodology
- Overall (STATE)
- 18 Strongly Tenant-Friendly
- State California
- 18 Strongly Tenant-Friendly · D+13
- County
- — inherits STATE
- City
- — inherits STATE
ZIP-level market 92220
- Rents YoY
- 3.6%
- Active inventory
- 312
- Price-to-rent
- 4.8×
Monthly cashflow live
- Estimated rent
- $1,988 high interval (Pro) →
- Mortgage (P&I)
- −$603
- Tax from tax record
- −$22 /mo · $261/yr
- Insurance
- −$48
- HOA
- −$0
- Vacancy / Maint / Mgmt
- −$417
- Net cashflow
- $898
Break-even live
UW: 25.0% down · 7.5% · 30yr · 1.5% tax · 5.0% vac · 8.0% maint · 8.0% mgmt
Financing live
Cash to close
- Down payment
- $28,750
- Closing costs
- $3,450
- Reserves months
- —
- Total cash needed
- —
Loan-product check · same deal, 3 products live
Conventional
25% down · 7.5% · 30yr
- Down + closing
- —
- Monthly P&I
- —
- Monthly cashflow
- —
- DSCR
- —
- Eligible?
- —
Personal DTI + credit; lowest rate.
DSCR
20% down · 8.5% · 30yr
- Down + closing
- —
- Monthly P&I
- —
- Monthly cashflow
- —
- DSCR
- —
- Eligible?
- —
No personal income docs; deal must DSCR.
Hard money
10% down · 12.0% · 12mo
- Down + closing
- —
- Monthly P&I
- —
- Monthly cashflow
- —
- DSCR
- —
- Eligible?
- —
Short-term bridge; refi at stabilization.
Rent comps 9 comps
| Address | Beds | Baths | Sqft | Rent | $/sqft | DOM | Units | Dist |
|---|---|---|---|---|---|---|---|---|
| 5464 Evelyn Dr Banning, CA | 2.0 | 1.0 | 851 | $1,900 | $2.23 | 43d | 1 | 0.21mi |
| 5464 Evelyn Dr Banning, CA | 2.0 | 1.0 | 851 | $1,900 | $2.23 | 14d | 1 | 0.21mi |
| 228 Janan Ct Banning, CA | 2.0 | 1.0 | 1100 | $2,100 | $1.91 | 1d | 1 | 0.25mi |
| 5001 W Wilson St Unit 103 Banning, CA | 1.0 | 1.0 | 751 | $1,600 | $2.13 | 1d | 1 | 0.50mi |
| 5001 W Wilson St Unit 227 Banning, CA | 2.0 | 1.0 | 833 | $1,700 | $2.04 | 1d | 1 | 0.50mi |
| 5891 Riviera Ave Banning, CA | 2.0 | 3.0 | 1456 | $2,350 | $1.61 | 43d | 1 | 0.71mi |
| 3911 W Ramsey St Unit 204 Banning, CA | 2.0 | 1.0 | 800 | $1,650 | $2.06 | 5d | 1 | 1.21mi |
| 3880 W Jacinto View Rd Unit A Banning, CA | 2.0 | 2.0 | 780 | $1,395 | $1.79 | 23d | 1 | 1.23mi |
| 1378 Snead St Banning, CA | 2.0 | 2.0 | 1150 | $2,200 | $1.91 | 14d | 1 | 1.24mi |
Listing history 48 events
-
2026-06-18days on market $115,000 Active 20 DOM
-
2026-06-17days on market $115,000 Active 19 DOM
-
2026-06-16days on market $115,000 Active 18 DOM
-
2026-06-15pricedays on market $115,000 Active 17 DOM
-
2026-06-13days on market $125,000 Active 15 DOM
-
2026-06-13days on market $125,000 Active 14 DOM
-
2026-06-09days on market $125,000 Active 11 DOM
-
2026-06-08days on market $125,000 Active 10 DOM
-
2026-06-07days on market $125,000 Active 9 DOM
-
2026-06-04days on market $125,000 Active 6 DOM
-
2026-06-03days on market $125,000 Active 5 DOM
-
2026-06-02days on market $125,000 Active 4 DOM
-
2026-06-01days on market $125,000 Active 3 DOM
-
2026-05-31days on market $125,000 Active 2 DOM
-
2026-04-14price $115,000 551-char remark
Show marketing remark (551 chars)
This Home is Located in the Linda Vista community which is an All Ages Mobile park, Home offers 3 Bedroom and 2 baths, the floor plan it's a split plan where the Primary bedroom is on one end and the other two at the other end, > The community has many things to offer to residents like swimming pool, hot tub, sauna, dog park, club house, Pickleball courts, Shuffleboard, firepit and picnic area, the Club house offer events for different age groups. Access to freeways and services are just a short distance away. Home is located near club house.
-
2026-01-12$120,000 Active 551-char remark
Show marketing remark (551 chars)
This Home is Located in the Linda Vista community which is an All Ages Mobile park, Home offers 3 Bedroom and 2 baths, the floor plan it's a split plan where the Primary bedroom is on one end and the other two at the other end, > The community has many things to offer to residents like swimming pool, hot tub, sauna, dog park, club house, Pickleball courts, Shuffleboard, firepit and picnic area, the Club house offer events for different age groups. Access to freeways and services are just a short distance away. Home is located near club house.
-
2026-01-11historical
-
2025-12-20price $124,999
-
2025-12-05price $127,499
-
2025-12-03price $124,999
-
2025-11-07$129,999 Active
-
2025-10-30historical
-
2025-10-02price $128,989
-
2025-09-03price $128,999
-
2025-08-25$129,999 Active
-
2025-08-20historical
-
2025-07-22price $130,000
-
2025-06-24$135,000 Active
-
2025-06-23historical
-
2025-04-29price $134,000
-
2025-01-02$139,000 Active
-
2019-12-31historical
-
2019-05-01price $39,900
-
2019-01-14$45,900 Active
-
2018-11-01historical
-
2018-10-15status Active
-
2018-10-02historical Hold Do Not Show
-
2018-08-28price $35,900
-
2018-05-01$36,900 Active
-
2016-06-09historical
-
2015-12-08$55,000 Active
-
2010-11-30soldstatus $10,500 Closed
-
2010-10-30status Pending
-
2010-08-09price $10,900
-
2010-07-12price $14,900
-
2010-03-24$24,000 Active
-
2005-10-20historical
-
2005-01-31$55,000
ⓘ Source: listings_history table (triggers on properties + properties_extension) + one-shot
backfill from property_details.listing_events for pre-trigger history.
Tax reassessment forecast CA · Resets to sale price
- Current annual tax
- $261 · $22/mo
- Projected year-2 tax
- $874 · $73/mo
- Expected delta
- +$613/yr (+$51/mo · 234.7%)
ⓘ Screening estimate from a state-policy table — verify with the county assessor before closing.
Climate risk First Street
- Flood 1/10 Low FEMA zone X (unshaded) · 0% chance over 30 yrs
- Wildfire 10/10 Extreme
- Heat 6/10 Major 6 d/yr ≥101°F today · 16 d/yr by 30 yrs out
- Wind 1/10 Low
- Air quality 8/10 Severe 18 unhealthy d/yr today · 23 by 30 yrs out
Nearby sold comps map
Loading sold comps map…
Walkable amenities ~0.75 mi
Loading nearby amenities…
Taxation est. · year 1
- Rental income
- $23,856
- − Mortgage interest
- −$6,442
- − Property taxes
- −$261
- − Insurance
- −$575
- − Repairs & maintenance
- −$1,908
- − Management
- −$1,908
- − Depreciation
- −$3,345
- Taxable income
- $9,416
- Est. tax owed @ 24.0%
- −$2,260
- After-tax cash flow
- $8,514/yr
For passive investors: Depreciation is non-cash, so a rental often shows a tax loss while cash-flowing — sheltering income. Rental losses are passive: they offset passive income freely, and up to $25,000/yr can offset ordinary (W-2) income if you actively participate and your MAGI is under $100k (phasing out to $0 by $150k); unused losses carry forward. On sale, claimed depreciation is recaptured at up to 25%, and gains may owe capital-gains tax (a 1031 exchange can defer both). Figures are a year-1 estimate at your 24.0% rate — not tax advice; consult a CPA.
Schools (NCES district)
- District
- Beaumont Unified
- NCES district ID
- 0604290
- Math proficiency
- 32% ▼ -4.00%
- Reading proficiency
- 60% ▲ 11.00%
- Median HH income
- $60,635
- Composite
- 40.37/100
- National rank
- #3736
- State rank
- #168 of 517 in CA
Livability — Banning
- Score
- 48/100
- State rank
- #1192
- US rank
- #26047
Category grades
Schools grade is shown separately in the Schools card above.
Census & demographics
- Census place
- Banning, CA
- County
- Riverside County · 2,287,001 people
- City population
- 33,755
- Metro
- Riverside-San Bernardino-Ontario, CA
- Population (ZIP)
- 33,755
- Household income
- $62,599
- Rent vs Own
- Severe rent burden
- 1146.0
Population outlook (Riverside County) Hauer SSP2
- Today (2025)
- 2,664,475 people
- By 2030
- 2,802,692 · +5.2%
- By 2040
- 3,050,904 · +14.5%
- By 2050
- 3,256,783 · +22.2%
- By 2075
- 3,655,058 · +37.2%
- By 2100
- 3,766,594 · +41.4%
Race, ethnicity, and origin ACS 2023
- Neighborhood character
- Diverse neighborhood (Simpson 0.64)
- Race & ethnicity
- Hispanic / Latino 48% White 35% Two or more races 21% Black 6% Asian 5% Native American 4%
- Hispanic origin (detail)
- Mexican 44%
- Common ancestry
- Italian 1% Romanian 1% Portuguese 1%
- Foreign-born
- 17% · Canada, South Korea, China
- Languages at home
- 65% English-only · Spanish 29% Tagalog/Filipino 1% Other Indo-European 1%
Political lean MEDSL · Riverside
- 2024 margin
- Toss-up / Even · D 48.0% · R 49.3% · Other 2.6%
- 2008→2024 swing
- -3.6pp toward R · 2008: 2.3pp · 2024: -1.3pp
- All cycles
- 2024: R+1.3 2020: D+8.0 2016: D+4.3 2012: R+0.4 2008: D+2.3
Not yet ingested
- Civics
- —
Market trends
- HPI YoY
- ▼ -343.32%
- Current HPI
- 342.4268
- Rent YoY
- ▲ 3.58%
- Metro
- Riverside-San Bernardino-Ontario, CA
- State GDP YoY
- ▲ 3.21%
- F500 in state
- 116
Industry mix (Fortune 500 HQ in CA)
| Industry | F500 HQs | Revenue |
|---|---|---|
| Technology | 27 | $1,492B |
|
||
| Financial Services | 3 | $174B |
|
||
| Retail | 3 | $44B |
|
||
| Insurance | 3 | $26B |
|
||
| Media / Entertainment | 2 | $115B |
|
||
| Pharmaceuticals / Biotech | 2 | $62B |
|
||
Price history
+109.1% since first listed34 events — show timeline
- 2026-04-14 Price Changed $115,000 CRMLS
- 2026-01-12 Listed $120,000 CRMLS
- 2026-01-11 Listing Removed — CRMLS
- 2025-12-20 Price Changed $124,999 CRMLS
- 2025-12-05 Price Changed $127,499 CRMLS
- 2025-12-03 Price Changed $124,999 CRMLS
- 2025-11-07 Listed $129,999 CRMLS
- 2025-10-30 Listing Removed — CRMLS
- 2025-10-02 Price Changed $128,989 CRMLS
- 2025-09-03 Price Changed $128,999 CRMLS
- 2025-08-25 Listed $129,999 CRMLS
- 2025-08-20 Listing Removed — CRMLS
- 2025-07-22 Price Changed $130,000 CRMLS
- 2025-06-24 Listed $135,000 CRMLS
- 2025-06-23 Listing Removed — CRMLS
- 2025-04-29 Price Changed $134,000 CRMLS
- 2025-01-02 Listed $139,000 CRMLS
- 2019-12-31 Listing Removed — CRMLS
- 2019-05-01 Price Changed $39,900 CRMLS
- 2019-01-14 Listed $45,900 CRMLS
- 2018-11-01 Listing Removed — CRMLS
- 2018-10-15 Relisted — CRMLS
- 2018-10-02 Delisted — CRMLS
- 2018-08-28 Price Changed $35,900 CRMLS
- 2018-05-01 Listed $36,900 CRMLS
- 2016-06-09 Listing Removed — GPSMLS
- 2015-12-08 Listed $55,000 GPSMLS
- 2010-11-30 Sold (MLS) $10,500 CRMLS
- 2010-10-30 Pending — CRMLS
- 2010-08-09 Price Changed $10,900 CRMLS
- 2010-07-12 Price Changed $14,900 CRMLS
- 2010-03-24 Listed $24,000 CRMLS
- 2005-10-20 Listing Removed — CRMLS
- 2005-01-31 Listed $55,000 CRMLS
Property tax history
-1.4%/yrLatest (2025): $261 · +2.1% YoY. Source: county tax records.
Cash-flow waterfall
monthlySold comps — $/sqft
last 12 mo · ≤1 miLoading sold comps…