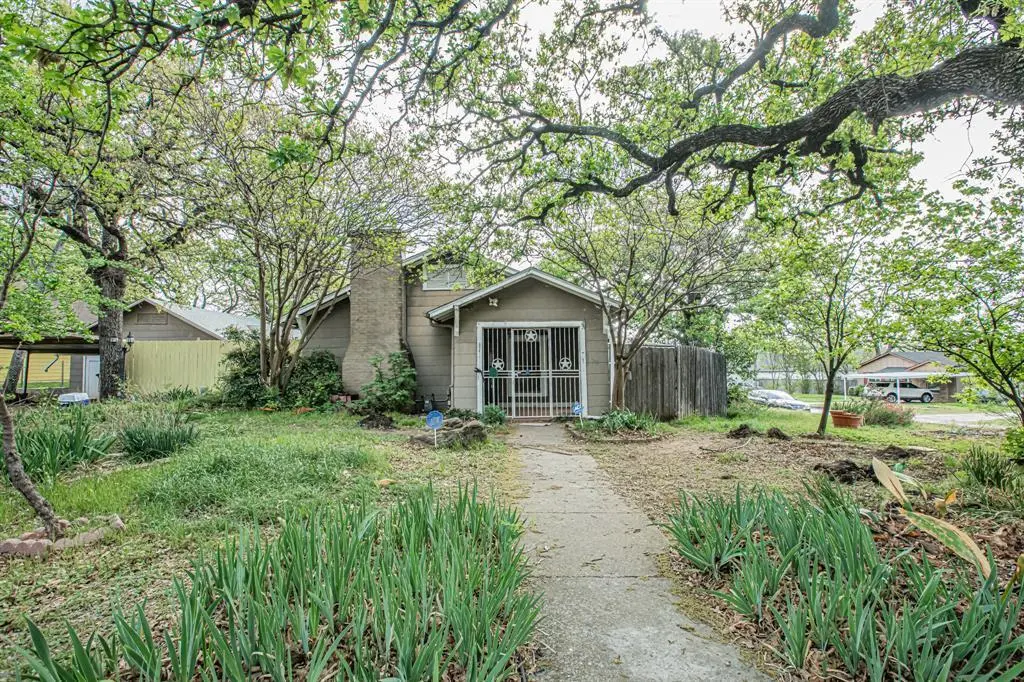
2625 Canton Dr · Fort Worth, TX
Flood risk 1/10 · Minimal
- FEMA flood zone
- X (unshaded)
- Chance of flooding over 30 yrs
- 0.0%
- Est. flood insurance / yr
- $507 – $1,088
Fire risk 1/10 · Minimal
- Est. fire insurance / yr
- $1,222 – $2,270
Heat risk 7/10 · Major
- Hot days now (above 110°F)
- 7 days/yr
- Hot days in 30 yrs
- 23 days/yr
Wind risk 5/10 · Moderate
- Chance of severe wind over 30 yrs
- 26.0%
Air-quality risk 3/10 · Minor
- Unhealthy air days now
- 2 days/yr
- Unhealthy air days in 30 yrs
- 4 days/yr
Risk factors via First Street. Map © Google.
Why this score? — see what drove the B- grade
The composite is a weighted blend of 9 inputs, each scored 0–100. Each bar is that input's sub-score; the figure is the points it added to the 100-point composite (weight × sub-score).
- Cash flow +30.0/30.0
- 1% rule +10.0/10.0
- DSCR +10.0/10.0
- ARV discount +7.5/15.0
- Livability +4.0/5.0
- Condition / age +2.5/5.0
- Rent growth +2.4/5.0
- Schools +2.0/10.0
- Appreciation +0.0/10.0
$99,817
🖨 Deal sheet 📄 Offer letter ✓ Due diligence
Listing remarks MLS
This is a clean, direct cash sale — no wholesalers, no seller financing, and no creative offers of any kind, no exceptions. Submit your highest and best; all offers must be on the TREC 1-4 Residential Contract — presented to the seller. Funds will be verified prior to signing. A $10,000 non-refundable deposit is due at execution. Buyer is responsible for a new survey — note that the east property line runs one foot west of the barn and should be fenced accordingly. Photos were taken March 29, 2026 and reflect current condition. If the buyer's name changes at any point during the pendingperiod, the contract is cancelled.
Key facts
- 0.24 acre lot
- 2 parking spots
- Built 1935
Neighborhood map
What this means for you Summary
Snapshot
- This is a 3-bed/1.0-bath single-family listed at $100k.
Deal economics
- At list price, monthly cash flow is $595 ($7k/yr) — positive.
- The deal already cash-flows at list — no discount required.
- Meets the 1% rule at list price ($2k rent vs $100k).
- Recommended offer: $97k (3.0% below list) — sets the bar for market timing.
- Cap rate 13.4% vs local median 3.9% in Fort Worth — top-decile yield for the area; either an underpriced asset or a hidden risk that comps aren't pricing in. Stress-test before assuming the spread holds.
Location & tenants
- Location reads 80/100 on livability (#49 in TX, #1,954 nationally) — a professional / high-income tenant draw. Strengths: amenities A+, cost of living A+, housing A+; Watch: schools D+, crime F.
- Fort Worth ISD (urban): math 18% / reading 28% proficiency, ranked #742 of 826 in TX (top 90%) — low school quality limits family demand, transient renter base, plan for 1-2y turnover; 73% free/reduced lunch — lower-income household profile, screen leases tightly.
- Market conditions: Rents soft (-0.4%/yr); 169 active listings in the ZIP; 28 comparable units currently listed for rent nearby; rentals at typical pace (median 15d on market — plan ~3-4 weeks tenant-placement turnaround); 18,938 units permitted in Tarrant County in 2024 (8,336 in 5+ unit buildings).
- This rent runs 38% of the median local income ($58k/yr) — at the standard rent-burdened threshold; future hikes will face affordability resistance.
Forward outlook
- Local home prices are declining (-3.0%/yr); year-one equity from $690 of loan paydown is wiped out by about $3k of value loss. Plan a longer hold.
- Tarrant County population projected at +41% by 2050 — long-run rental-demand tailwind backs the buy-and-hold thesis.
- At projected returns (-3.0% appreciation + 0.0% rent growth), your $28k cash investment doubles in ~6 years — after that, you're playing with house money.
Negotiation context
- It's been on market 39 days — a 3% lower offer ($97k) is reasonable based on typical stale-listing flexibility.
Risks & watch-outs
- Watch-outs: property tax is 3.4% of price; built in 1935 — expect roof / HVAC / electrical / plumbing capex.
- Climate carrying-cost: moderate wind risk, 26% chance of damaging wind over 30y; extreme-heat days projected 7→23/yr by 2055 (HVAC capex compounding) — expect insurance premiums to compound above CPI over the hold.
Questions for the listing agent
- It's been on market 39 days. Have you received any prior offers? Is the seller open to a 3% concession, seller financing, or rate buy-down credit?
- Built in 1935 — when were the roof, HVAC, electrical panel, plumbing, and water heater last replaced?
- Property tax is high relative to price — has the assessment been appealed recently, and will the sale trigger a re-assessment?
- Is there a deadline driving the sale (1031 exchange, divorce, estate, relocation)? That informs how much negotiation room exists.
- Schools are D-rated, which usually means shorter tenancies and higher turnover. Who's the typical renter profile here, and what's been the actual vacancy rate?
- Crime grade is F in this area — have there been break-ins, vandalism, or insurance claims at this property in the last 3 years? What carrier currently insures it and at what premium?
- What's the average days-on-market for RENTAL listings here right now (not sales)? A rising rental-DOM trend means longer vacancies and softer asking-rent achievability than the comps imply.
- What's the recent tenant-quality profile in this submarket — average credit score on applications, eviction rate, late-payment / NSF rate, and stable-employment percentage? A property-management company in the area should have these aggregated.
- How much new for-sale + rental construction is in the pipeline within 1–3 miles? Heavy new supply typically softens prices + rents 12–24 months out; constrained supply supports both.
Investment metrics
- 1% rule
- 1.82% ✓
- Cap rate
- 13.44%
- Cash-on-cash
- 25.54%
- DSCR
- 2.14
- GRM
- 4.6
CMA / ARV
- ARV (median comp)
- $245,297
- List price
- $99,817
- Delta
- -59.31%
- Verdict
- UNDERPRICED
- Comps
- 20 within 1.0 mi
Show comp detail 12 sales within ~0.75 mi
| Address | Dist | Beds/Ba | Sqft | Sold | Price | $/sf | Match |
|---|---|---|---|---|---|---|---|
| 2625 Canton Dr | 0.00mi | 4/2.0 (+1) | 1,855 (0%) | 0mo | $99,817 | $54 | 91 |
| 2621 Canton Dr | 0.01mi | 3/2.0 | 1,658 (-11%) | 2mo | $300,000 | $181 | 76 |
| 2700 Pollard St | 0.11mi | 3/2.0 | 1,635 (-12%) | 2mo | $279,500 | $171 | 69 |
| 2628 Cravens Rd | 0.17mi | 3/2.0 | 1,622 (-13%) | 2mo | $245,000 | $151 | 66 |
| 2404 Handley Dr | 0.74mi | 3/2.0 | 1,864 (+0%) | 7mo | $294,500 | $158 | 55 |
| 5545 S Hampshire Blvd | 0.55mi | 4/2.5 (+1) | 1,810 (-2%) | 10mo | $339,900 | $188 | 51 |
| 1916 Canterbury Cir | 0.63mi | 3/2.0 | 1,676 (-10%) | 2mo | $299,900 | $179 | 49 |
| 5824 Yolanda Dr | 0.68mi | 3/2.0 | 2,027 (+9%) | 3mo | $315,599 | $156 | 46 |
| 1925 Canterbury Cir | 0.61mi | 3/2.0 | 2,078 (+12%) | 2mo | $249,000 | $120 | 46 |
| 5917 Yosemite Dr | 0.57mi | 3/2.0 | 1,624 (-12%) | 4mo | $275,000 | $169 | 46 |
| 5416 Purington Ave | 0.52mi | 4/2.0 (+1) | 1,700 (-8%) | 10mo | $237,900 | $140 | 44 |
| 5816 Yolanda Dr | 0.68mi | 2/2.0 (-1) | 1,703 (-8%) | 2mo | $260,000 | $153 | 44 |
Match score weights: distance 35% · size 25% · config 20% · recency 20%. Top-matched comps best support the ARV.
Projected returns pro-forma
-3.0% appreciation · 0.0% rent growth · sell at horizon
- IRR
- 15.3%
- Equity multiple
- 1.59×
- Total profit
- $16,493
- Equity at exit
- $14,883
- IRR
- 21.4%
- Equity multiple
- 2.54×
- Total profit
- $43,009
- Equity at exit
- $8,630
Cash invested: $27,949 (down + closing). Projections, not guarantees.
Landlord ↔ Tenant lean methodology
- Overall (STATE)
- 87 Strongly Landlord-Friendly
- State Texas
- 87 Strongly Landlord-Friendly · R+5
- County
- — inherits STATE
- City
- — inherits STATE
ZIP-level market 76112
- Home prices YoY
- -32.0%
- Rents YoY
- -0.4%
- Active inventory
- 169
- Price-to-rent
- 4.6×
Monthly cashflow live
- Estimated rent
- $1,822 high interval (Pro) →
- Mortgage (P&I)
- −$523
- Tax from tax record
- −$279 /mo · $3,351/yr
- Insurance
- −$42
- HOA
- −$0
- Vacancy / Maint / Mgmt
- −$383
- Net cashflow
- $595
Break-even live
UW: 25.0% down · 7.5% · 30yr · 1.5% tax · 5.0% vac · 8.0% maint · 8.0% mgmt
Financing live
Cash to close
- Down payment
- $24,954
- Closing costs
- $2,995
- Reserves months
- —
- Total cash needed
- —
Loan-product check · same deal, 3 products live
Conventional
25% down · 7.5% · 30yr
- Down + closing
- —
- Monthly P&I
- —
- Monthly cashflow
- —
- DSCR
- —
- Eligible?
- —
Personal DTI + credit; lowest rate.
DSCR
20% down · 8.5% · 30yr
- Down + closing
- —
- Monthly P&I
- —
- Monthly cashflow
- —
- DSCR
- —
- Eligible?
- —
No personal income docs; deal must DSCR.
Hard money
10% down · 12.0% · 12mo
- Down + closing
- —
- Monthly P&I
- —
- Monthly cashflow
- —
- DSCR
- —
- Eligible?
- —
Short-term bridge; refi at stabilization.
Rent comps 28 comps
| Address | Beds | Baths | Sqft | Rent | $/sqft | DOM | Units | Dist |
|---|---|---|---|---|---|---|---|---|
| 6008 Shelton St Fort Worth, TX | 3.0 | 2.0 | 1780 | $1,500 | $0.84 | 24d | 1 | 0.40mi |
| 2332 Grandview Dr Fort Worth, TX | 4.0 | 2.0 | 1994 | $2,000 | $1.00 | 22d | 1 | 0.50mi |
| 5317 Purington Ave Fort Worth, TX | 2.0 | 1.0 | 1363 | $1,525 | $1.12 | 24d | 1 | 0.61mi |
| 5311 Purington Ave Fort Worth, TX | 2.0 | 1.0 | 2196 | $1,525 | $0.69 | 24d | 1 | 0.63mi |
| 2100 E Loop 820 Fort Worth, TX | 2.0–3.0 | 1.0–2.0 | 1070 | $1,690 | $1.58 | 1d | 36 | 0.67mi |
| 2120 Handley Dr Fort Worth, TX | 1.0–3.0 | 1.0–2.0 | 931 | $1,875 | $2.01 | 2d | 11 | 0.76mi |
| 2121 Handley Dr Fort Worth, TX | 2.0–3.0 | 1.0–2.0 | 1085 | $1,395 | $1.29 | 1d | 3 | 0.91mi |
| 6800 Beaty St Fort Worth, TX | 3.0 | 2.0 | 1465 | $1,925 | $1.31 | 6d | 1 | 0.93mi |
| 1736 Ransom Ter Fort Worth, TX | 3.0 | 2.0 | 1322 | $1,850 | $1.40 | 15d | 1 | 0.97mi |
| 3121 Lumber St Fort Worth, TX | 3.0 | 2.5 | 1254 | $2,000 | $1.59 | 4d | 1 | 0.99mi |
| 1604 Weiler Blvd Fort Worth, TX | 3.0 | 2.0 | 1941 | $2,150 | $1.11 | 43d | 1 | 1.01mi |
| 1604 Weiler Blvd Fort Worth, TX | 3.0 | 2.0 | 1941 | $2,150 | $1.11 | 24d | 1 | 1.01mi |
| 1604 Weiler Blvd Fort Worth, TX | 3.0 | 2.0 | 1941 | $2,150 | $1.11 | 15d | 1 | 1.01mi |
| 2120 Nottingham Blvd Fort Worth, TX | 3.0 | 2.0 | 1623 | $2,100 | $1.29 | 4d | 1 | 1.05mi |
| 5006 Norma St Fort Worth, TX | 2.0 | 2.0 | 1964 | $1,300 | $0.66 | 15d | 1 | 1.05mi |
| 1007 Tierney Rd Unit 1007 Fort Worth, TX | 2.0 | 1.0 | 1600 | $1,250 | $0.78 | 43d | 1 | 1.11mi |
| 1508 Grantland Cir Fort Worth, TX | 3.0 | 2.0 | 1600 | $2,250 | $1.41 | 15d | 1 | 1.11mi |
| 5930 Chimney Wood Cir Fort Worth, TX | 3.0 | 2.5 | 1800 | $3,500 | $1.94 | 2d | 1 | 1.14mi |
| 4900 Morris Ave Fort Worth, TX | 3.0 | 2.0 | 1248 | $1,695 | $1.36 | 6d | 1 | 1.15mi |
| 6237 Warrington Pl Fort Worth, TX | 3.0 | 2.0 | 1629 | $1,929 | $1.18 | 6d | 1 | 1.21mi |
| 1905 Milam St Fort Worth, TX | 4.0 | 2.0 | 1590 | $1,999 | $1.26 | 24d | 1 | 1.23mi |
| 2312 Cass St Fort Worth, TX | 4.0 | 2.5 | 1600 | $1,850 | $1.16 | 14d | 1 | 1.27mi |
| 6050 Oakland Hills Dr Fort Worth, TX | 1.0–3.0 | 1.0–2.0 | 925 | $1,615 | $1.75 | 2d | 33 | 1.41mi |
| 5636 Lester Granger Dr Fort Worth, TX | 3.0 | 2.0 | 1300 | $1,495 | $1.15 | 24d | 1 | 1.46mi |
| 4820 Briarwood Ln Fort Worth, TX | 4.0 | 2.0 | 1955 | $2,395 | $1.23 | 11d | 1 | 1.48mi |
| 1608 Mims St Fort Worth, TX | 3.0 | 2.0 | 1560 | $1,900 | $1.22 | 12d | 1 | 1.49mi |
| 1608 Mims St Fort Worth, TX | 4.0 | 2.0 | 1560 | $1,900 | $1.22 | 43d | 1 | 1.49mi |
| 6805 Terbet Ct Fort Worth, TX | 3.0 | 2.0 | 1609 | $2,295 | $1.43 | 6d | 1 | 1.49mi |
Listing history 7 events
-
2026-05-08status Pending 645-char remark
Show marketing remark (645 chars)
This is a clean, direct cash sale — no wholesalers, no seller financing, and no creative offers of any kind, no exceptions. Submit your highest and best; all offers must be on the TREC 1-4 Residential Contract — presented to the seller. Funds will be verified prior to signing. A $10,000 non-refundable deposit is due at execution. Buyer is responsible for a new survey — note that the east property line runs one foot west of the barn and should be fenced accordingly. Photos were taken March 29, 2026 and reflect current condition. If the buyer's name changes at any point during the pendingperiod, the contract is cancelled.
-
2026-04-29price $99,817 645-char remark
Show marketing remark (645 chars)
This is a clean, direct cash sale — no wholesalers, no seller financing, and no creative offers of any kind, no exceptions. Submit your highest and best; all offers must be on the TREC 1-4 Residential Contract — presented to the seller. Funds will be verified prior to signing. A $10,000 non-refundable deposit is due at execution. Buyer is responsible for a new survey — note that the east property line runs one foot west of the barn and should be fenced accordingly. Photos were taken March 29, 2026 and reflect current condition. If the buyer's name changes at any point during the pendingperiod, the contract is cancelled.
-
2026-04-09price $129,817 645-char remark
Show marketing remark (645 chars)
This is a clean, direct cash sale — no wholesalers, no seller financing, and no creative offers of any kind, no exceptions. Submit your highest and best; all offers must be on the TREC 1-4 Residential Contract — presented to the seller. Funds will be verified prior to signing. A $10,000 non-refundable deposit is due at execution. Buyer is responsible for a new survey — note that the east property line runs one foot west of the barn and should be fenced accordingly. Photos were taken March 29, 2026 and reflect current condition. If the buyer's name changes at any point during the pendingperiod, the contract is cancelled.
-
2026-03-30$149,817 Active 645-char remark
Show marketing remark (645 chars)
This is a clean, direct cash sale — no wholesalers, no seller financing, and no creative offers of any kind, no exceptions. Submit your highest and best; all offers must be on the TREC 1-4 Residential Contract — presented to the seller. Funds will be verified prior to signing. A $10,000 non-refundable deposit is due at execution. Buyer is responsible for a new survey — note that the east property line runs one foot west of the barn and should be fenced accordingly. Photos were taken March 29, 2026 and reflect current condition. If the buyer's name changes at any point during the pendingperiod, the contract is cancelled.
-
2025-09-26soldstatus
-
2016-07-22soldstatus
-
1988-01-20soldstatus
ⓘ Source: listings_history table (triggers on properties + properties_extension) + one-shot
backfill from property_details.listing_events for pre-trigger history.
Tax reassessment forecast TX · Resets to sale price
- Current annual tax
- $3,351 · $279/mo
- Projected year-2 tax
- $3,351 · $279/mo
- Expected delta
- $0/yr ($0/mo · 0.0%)
ⓘ Screening estimate from a state-policy table — verify with the county assessor before closing.
Climate risk First Street
- Flood 1/10 Low FEMA zone X (unshaded) · 0% chance over 30 yrs
- Wildfire 1/10 Low
- Heat 7/10 Severe 7 d/yr ≥110°F today · 23 d/yr by 30 yrs out
- Wind 5/10 Major 26% chance of damaging wind over 30 yrs
- Air quality 3/10 Moderate 2 unhealthy d/yr today · 4 by 30 yrs out
Nearby sold comps map
Loading sold comps map…
Walkable amenities ~0.75 mi
Loading nearby amenities…
Taxation est. · year 1
- Rental income
- $21,859
- − Mortgage interest
- −$5,591
- − Property taxes
- −$3,351
- − Insurance
- −$499
- − Repairs & maintenance
- −$1,749
- − Management
- −$1,749
- − Depreciation
- −$2,904
- Taxable income
- $6,017
- Est. tax owed @ 24.0%
- −$1,444
- After-tax cash flow
- $5,694/yr
For passive investors: Depreciation is non-cash, so a rental often shows a tax loss while cash-flowing — sheltering income. Rental losses are passive: they offset passive income freely, and up to $25,000/yr can offset ordinary (W-2) income if you actively participate and your MAGI is under $100k (phasing out to $0 by $150k); unused losses carry forward. On sale, claimed depreciation is recaptured at up to 25%, and gains may owe capital-gains tax (a 1031 exchange can defer both). Figures are a year-1 estimate at your 24.0% rate — not tax advice; consult a CPA.
Schools (NCES district)
- District
- Fort Worth ISD
- NCES district ID
- 4819700
- Math proficiency
- 18% ▼ -16.00%
- Reading proficiency
- 28% ▼ -6.00%
- Median HH income
- $42,109
- Composite
- 19.61/100
- National rank
- #8753
- State rank
- #742 of 826 in TX
Livability — Fort Worth
- Score
- 80/100
- State rank
- #49
- US rank
- #1954
Category grades
Schools grade is shown separately in the Schools card above.
Census & demographics
- Census place
- Fort Worth, TX
- County
- Tarrant County · 2,033,669 people
- City population
- 911,619
- Metro
- Dallas-Fort Worth-Arlington, TX
- Population (ZIP)
- 44,514
- Household income
- $57,724
- Rent vs Own
- Severe rent burden
- 3056.0
Population outlook (Tarrant County) Hauer SSP2
- Today (2025)
- 2,380,417 people
- By 2030
- 2,578,900 · +8.3%
- By 2040
- 2,974,995 · +25.0%
- By 2050
- 3,350,489 · +40.8%
- By 2075
- 4,216,909 · +77.2%
- By 2100
- 4,741,527 · +99.2%
Race, ethnicity, and origin ACS 2023
- Neighborhood character
- Diverse neighborhood (Simpson 0.69)
- Race & ethnicity
- Black 38% Hispanic / Latino 34% White 21% Two or more races 19% Asian 3%
- Hispanic origin (detail)
- Mexican 28% Puerto Rican 1%
- Common ancestry
- Lithuanian 1% Slovak 1% Swiss 1%
- Foreign-born
- 15% · Canada, Vietnam
- Languages at home
- 67% English-only · Spanish 29% Other Indo-European 1% Vietnamese 1%
Political lean MEDSL · Tarrant
- 2024 margin
- Lean R (+5.1) · D 46.7% · R 51.9% · Other 1.4%
- 2008→2024 swing
- +6.6pp toward D · 2008: -11.7pp · 2024: -5.1pp
- All cycles
- 2024: R+5.1 2020: D+0.2 2016: R+8.7 2012: R+15.7 2008: R+11.7
Not yet ingested
- Civics
- —
Market trends
- HPI YoY
- ▼ -158.49%
- Current HPI
- 336.6297
- Rent YoY
- ▼ -0.43%
- Metro
- Dallas-Fort Worth-Arlington, TX
- State GDP YoY
- ▲ 3.95%
- F500 in state
- 110
Industry mix (Fortune 500 HQ in TX)
| Industry | F500 HQs | Revenue |
|---|---|---|
| Energy | 16 | $1,198B |
|
||
| Technology | 5 | $198B |
|
||
| Engineering / Construction | 4 | $72B |
|
||
| Energy Services | 3 | $60B |
|
||
| Utilities | 3 | $41B |
|
||
| Healthcare | 2 | $330B |
|
||
Price history
-33.4% since first listed7 events — show timeline
- 2026-05-08 Pending — NTREIS
- 2026-04-29 Price Changed $99,817 NTREIS
- 2026-04-09 Price Changed $129,817 NTREIS
- 2026-03-30 Listed $149,817 NTREIS
- 2025-09-26 Sold (Public Records) — Public Records
- 2016-07-22 Sold (Public Records) — Public Records
- 1988-01-20 Sold (Public Records) — Public Records
Property tax history
+4.8%/yrLatest (2025): $3,351 · +7.3% YoY. Source: county tax records.
Cash-flow waterfall
monthlySold comps — $/sqft
last 12 mo · ≤1 miLoading sold comps…