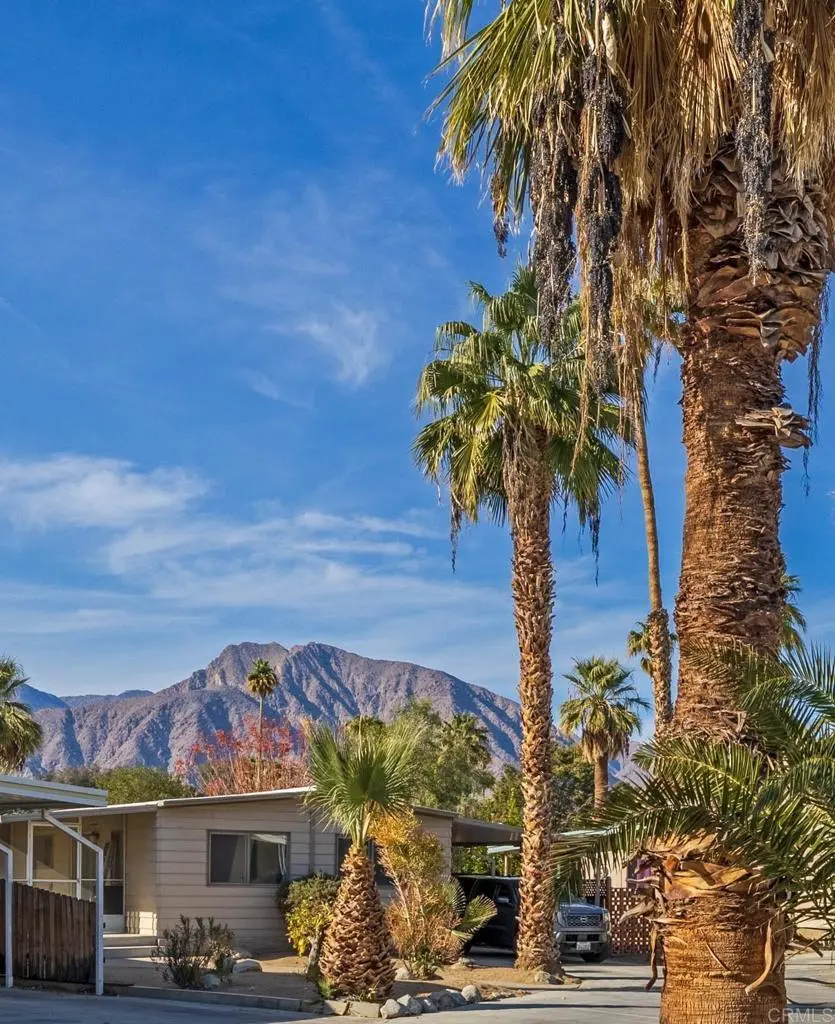
1010 Palm Canyon Dr #94 · Borrego Springs, CA
Flood risk No data
- FEMA flood zone
- —
- Chance of flooding over 30 yrs
- —
- Est. flood insurance / yr
- —
Fire risk No data
- Est. fire insurance / yr
- —
Heat risk No data
- Hot days now (above threshold)
- —
- Hot days in 30 yrs
- —
Wind risk No data
- Chance of severe wind over 30 yrs
- —
Air-quality risk No data
- Unhealthy air days now
- —
- Unhealthy air days in 30 yrs
- —
Risk factors via First Street. Map © Google.
Why this score? — see what drove the B- grade
The composite is a weighted blend of 9 inputs, each scored 0–100. Each bar is that input's sub-score; the figure is the points it added to the 100-point composite (weight × sub-score).
- Cash flow +30.0/30.0
- 1% rule +10.0/10.0
- DSCR +10.0/10.0
- ARV discount +7.5/15.0
- Livability +2.9/5.0
- Schools +2.6/10.0
- Rent growth +2.5/5.0
- Condition / age +2.5/5.0
- Appreciation +0.0/10.0
$72,000
🖨 Deal sheet 📄 Offer letter ✓ Due diligence
Listing remarks MLS
This little gem has been upgraded throughout nicely furnished Freshly painted, new flooring, Good sized Screened porch. Steps to the golf course, close to the Clubhouse. Very active 55+ community with a full calendar Pickleball, Tennis, Bocceball, shuffle board, hiking and walking groups, Card and game groups, 24 hr open heated pool and spa Great dog park two golf courses and a whole lot more Comes with a 1 year home warranty Space rent $925. $5,000 furniture allowance and No rent for the first 3 months.
Key facts
- Dog park
- Clubhouse
- Spa
Tags
Neighborhood map
What this means for you Summary
Snapshot
- This is a 2-bed/2.0-bath manufactured listed at $72k.
Deal economics
- At list price, monthly cash flow is $1k ($15k/yr) — positive.
- The deal already cash-flows at list — no discount required.
- Meets the 1% rule at list price ($2k rent vs $72k).
- Recommended offer: $63k (12.0% below list) — sets the bar for market timing.
- Cap rate 26.9% vs local median 6.0% in Borrego Springs — top-decile yield for the area; either an underpriced asset or a hidden risk that comps aren't pricing in. Stress-test before assuming the spread holds.
Location & tenants
- Location reads 58/100 on livability (#712 in CA) — a working-class tenant base; expect higher turnover. Strengths: crime A+, employment A+, housing A+; Watch: schools F, amenities F, commute F.
- Borrego Springs Unified (rural): math 20% / reading 35% proficiency, ranked #1,120 of 1,400 in CA (top 80%) — low school quality limits family demand, transient renter base, plan for 1-2y turnover; 72% free/reduced lunch — lower-income household profile, screen leases tightly.
- Market conditions: 174 active listings in the ZIP; 11,759 units permitted in San Diego County in 2024 (7,244 in 5+ unit buildings).
Forward outlook
- Local home prices are declining (-3.0%/yr); year-one equity from $498 of loan paydown is wiped out by about $2k of value loss. Plan a longer hold.
- San Diego County population projected at +20% by 2050 — long-run rental-demand tailwind backs the buy-and-hold thesis.
- At projected returns (-3.0% appreciation + 3.0% rent growth), your $20k cash investment doubles in ~2 years — after that, you're playing with house money.
Negotiation context
- It's been on market 218 days — a 12% lower offer ($63k) is reasonable based on typical stale-listing flexibility.
- 3 sale attempts since 20y ago with the ask held roughly flat each time — persistent listings suggest the price (not the market) is what's stuck; bring a comps-based counter.
Questions for the listing agent
- It's been on market 218 days. Have you received any prior offers? Is the seller open to a 12% concession, seller financing, or rate buy-down credit?
- Built in 1973 — when were the roof, HVAC, electrical panel, plumbing, and water heater last replaced?
- Why hasn't it sold? Are there any deal-killer items the seller is aware of (foundation, flood, title, zoning, code violations)?
- Is there a deadline driving the sale (1031 exchange, divorce, estate, relocation)? That informs how much negotiation room exists.
- Schools are F-rated, which usually means shorter tenancies and higher turnover. Who's the typical renter profile here, and what's been the actual vacancy rate?
- What's the average days-on-market for RENTAL listings here right now (not sales)? A rising rental-DOM trend means longer vacancies and softer asking-rent achievability than the comps imply.
- What's the recent tenant-quality profile in this submarket — average credit score on applications, eviction rate, late-payment / NSF rate, and stable-employment percentage? A property-management company in the area should have these aggregated.
- How much new for-sale + rental construction is in the pipeline within 1–3 miles? Heavy new supply typically softens prices + rents 12–24 months out; constrained supply supports both.
Investment metrics
- 1% rule
- 3.05% ✓
- Cap rate
- 26.91%
- Cash-on-cash
- 73.65%
- DSCR
- 4.28
- GRM
- 2.7
CMA / ARV
- ARV (median comp)
- $20,250
- List price
- $72,000
- Delta
- 255.56%
- Verdict
- OVERPRICED
- Comps
- 11 within 1.0 mi
Projected returns pro-forma
-3.0% appreciation · 3.0% rent growth · sell at horizon
- IRR
- 73.4%
- Equity multiple
- 4.33×
- Total profit
- $67,169
- Equity at exit
- $10,735
- IRR
- 77.3%
- Equity multiple
- 8.94×
- Total profit
- $160,096
- Equity at exit
- $6,225
Cash invested: $20,160 (down + closing). Projections, not guarantees.
Landlord ↔ Tenant lean methodology
- Overall (STATE)
- 18 Strongly Tenant-Friendly
- State California
- 18 Strongly Tenant-Friendly · D+13
- County
- — inherits STATE
- City
- — inherits STATE
ZIP-level market 92004
- Home prices YoY
- -18.4%
- Active inventory
- 174
- Price-to-rent
- 2.7×
Monthly cashflow live
- Estimated rent
- $2,196 medium interval (Pro) →
- Mortgage (P&I)
- −$378
- Tax est. 1.5%
- −$90 /mo · $1,080/yr
- Insurance
- −$30
- HOA
- −$0
- Vacancy / Maint / Mgmt
- −$461
- Net cashflow
- $1,237
Break-even live
UW: 25.0% down · 7.5% · 30yr · 1.5% tax · 5.0% vac · 8.0% maint · 8.0% mgmt
Financing live
Cash to close
- Down payment
- $18,000
- Closing costs
- $2,160
- Reserves months
- —
- Total cash needed
- —
Loan-product check · same deal, 3 products live
Conventional
25% down · 7.5% · 30yr
- Down + closing
- —
- Monthly P&I
- —
- Monthly cashflow
- —
- DSCR
- —
- Eligible?
- —
Personal DTI + credit; lowest rate.
DSCR
20% down · 8.5% · 30yr
- Down + closing
- —
- Monthly P&I
- —
- Monthly cashflow
- —
- DSCR
- —
- Eligible?
- —
No personal income docs; deal must DSCR.
Hard money
10% down · 12.0% · 12mo
- Down + closing
- —
- Monthly P&I
- —
- Monthly cashflow
- —
- DSCR
- —
- Eligible?
- —
Short-term bridge; refi at stabilization.
Listing history 21 events
-
2026-06-19days on market $72,000 Active 218 DOM
-
2026-06-18days on market $72,000 Active 217 DOM
-
2026-06-17days on market $72,000 Active 216 DOM
-
2026-06-16days on market $72,000 Active 215 DOM
-
2026-06-15days on market $72,000 Active 214 DOM
-
2026-06-14days on market $72,000 Active 212 DOM
-
2026-06-12days on market $72,000 Active 211 DOM
-
2026-06-09days on market $72,000 Active 208 DOM
-
2026-06-08days on market $72,000 Active 207 DOM
-
2026-06-07days on market $72,000 Active 206 DOM
-
2026-06-07days on market $72,000 Active 205 DOM
-
2026-06-04days on market $72,000 Active 202 DOM
-
2026-06-02days on market $72,000 Active 201 DOM
-
2026-06-01days on market $72,000 Active 200 DOM
-
2026-05-31days on market $72,000 Active 199 DOM
-
2026-05-31days on market $72,000 Active 198 DOM
-
2025-11-13$72,000 Active 514-char remark
Show marketing remark (514 chars)
This little gem has been upgraded throughout nicely furnished Freshly painted, new flooring, Good sized Screened porch. Steps to the golf course, close to the Clubhouse. Very active 55+ community with a full calendar Pickleball, Tennis, Bocceball, shuffle board, hiking and walking groups, Card and game groups, 24 hr open heated pool and spa Great dog park two golf courses and a whole lot more Comes with a 1 year home warranty Space rent $925. $5,000 furniture allowance and No rent for the first 3 months.
-
2025-10-01historical
-
2025-02-26$79,000 Active
-
2007-05-31historical
-
2006-11-15$17,900
ⓘ Source: listings_history table (triggers on properties + properties_extension) + one-shot
backfill from property_details.listing_events for pre-trigger history.
Nearby sold comps map
Loading sold comps map…
Walkable amenities ~0.75 mi
Loading nearby amenities…
Taxation est. · year 1
- Rental income
- $26,352
- − Mortgage interest
- −$4,033
- − Property taxes
- −$1,080
- − Insurance
- −$360
- − Repairs & maintenance
- −$2,108
- − Management
- −$2,108
- − Depreciation
- −$2,095
- Taxable income
- $14,568
- Est. tax owed @ 24.0%
- −$3,496
- After-tax cash flow
- $11,351/yr
For passive investors: Depreciation is non-cash, so a rental often shows a tax loss while cash-flowing — sheltering income. Rental losses are passive: they offset passive income freely, and up to $25,000/yr can offset ordinary (W-2) income if you actively participate and your MAGI is under $100k (phasing out to $0 by $150k); unused losses carry forward. On sale, claimed depreciation is recaptured at up to 25%, and gains may owe capital-gains tax (a 1031 exchange can defer both). Figures are a year-1 estimate at your 24.0% rate — not tax advice; consult a CPA.
Schools (NCES district)
- District
- Borrego Springs Unified
- NCES district ID
- 0605700
- Math proficiency
- 20% ▼ -6.00%
- Reading proficiency
- 35% ▼ -6.00%
- Median HH income
- $42,330
- Composite
- 26.31/100
- National rank
- #12684
- State rank
- #1120 of 1400 in CA
Livability — Borrego Springs
- Score
- 58/100
- State rank
- #712
- US rank
- #21334
Category grades
Schools grade is shown separately in the Schools card above.
Census & demographics
- Census place
- Borrego Springs, CA
- Population (ZIP)
- 3,030
Population outlook (San Diego County) Hauer SSP2
- Today (2025)
- 3,678,185 people
- By 2030
- 3,856,546 · +4.8%
- By 2040
- 4,171,407 · +13.4%
- By 2050
- 4,421,607 · +20.2%
- By 2075
- 4,831,599 · +31.4%
- By 2100
- 4,832,502 · +31.4%
Race, ethnicity, and origin ACS 2023
- Neighborhood character
- Predominantly White (66%)
- Race & ethnicity
- White 66% Hispanic / Latino 33% Two or more races 24%
- Hispanic origin (detail)
- Mexican 29%
- Common ancestry
- Lithuanian 10% Slovak 5% Scotch-Irish 1%
- Foreign-born
- 27% · Canada
- Languages at home
- 70% English-only · Spanish 30%
Political lean MEDSL · San Diego
- 2024 margin
- D (+16.8) · D 56.9% · R 40.1% · Other 2.9%
- 2008→2024 swing
- +6.6pp toward D · 2008: 10.2pp · 2024: 16.8pp
- All cycles
- 2024: D+16.8 2020: D+22.8 2016: D+17.8 2012: D+5.1 2008: D+10.2
Not yet ingested
- Civics
- —
Market trends
- HPI YoY
- ▼ -50.39%
- Current HPI
- 222.8196
- Rent YoY
- —
- Metro
- —
- State GDP YoY
- ▲ 3.21%
- F500 in state
- 116
Industry mix (Fortune 500 HQ in CA)
| Industry | F500 HQs | Revenue |
|---|---|---|
| Technology | 27 | $1,492B |
|
||
| Financial Services | 3 | $174B |
|
||
| Retail | 3 | $44B |
|
||
| Insurance | 3 | $26B |
|
||
| Media / Entertainment | 2 | $115B |
|
||
| Pharmaceuticals / Biotech | 2 | $62B |
|
||
Price history
+302.2% since first listed5 events — show timeline
- 2025-11-13 Listed $72,000 CRMLS
- 2025-10-01 Listing Removed — CRMLS
- 2025-02-26 Listed $79,000 CRMLS
- 2007-05-31 Listing Removed — SDMLS
- 2006-11-15 Listed $17,900 SDMLS
Cash-flow waterfall
monthlySold comps — $/sqft
last 12 mo · ≤1 miLoading sold comps…