3091 E Sunrise Lakes Dr #101 · Sunrise, FL
Flood risk No data
- FEMA flood zone
- —
- Chance of flooding over 30 yrs
- —
- Est. flood insurance / yr
- —
Fire risk No data
- Est. fire insurance / yr
- —
Heat risk No data
- Hot days now (above threshold)
- —
- Hot days in 30 yrs
- —
Wind risk No data
- Chance of severe wind over 30 yrs
- —
Air-quality risk No data
- Unhealthy air days now
- —
- Unhealthy air days in 30 yrs
- —
Risk factors via First Street. Map © Google.
Why this score? — see what drove the B grade
The composite is a weighted blend of 9 inputs, each scored 0–100. Each bar is that input's sub-score; the figure is the points it added to the 100-point composite (weight × sub-score).
- Cash flow +30.0/30.0
- 1% rule +10.0/10.0
- DSCR +10.0/10.0
- ARV discount +7.5/15.0
- Livability +4.2/5.0
- Schools +4.1/10.0
- Rent growth +2.7/5.0
- Condition / age +2.5/5.0
- Appreciation +0.0/10.0
$85,000
🖨 Deal sheet 📄 Offer letter ✓ Due diligence
Listing remarks
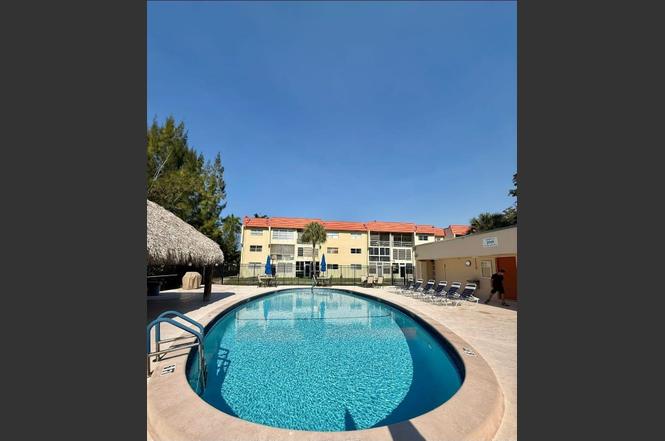
Well-maintained corner unit on the main floor in the desirable Sunrise Lakes 55+ community. This residence is in good condition and has been well cared for, offering a functional layout with abundant natural light throughout. Move-in ready and a great opportunity to customize to your taste. Enjoy peaceful living with access to community amenities including clubhouse, pool, and recreational facilities. Conveniently located near shopping, dining, and major roadways. Perfect for seasonal or full-time residence.
Key facts
- Clubhouse
- Community amenities
- Corner unit
Tags
Property features AI
Finance
- Other: Senior community
- HOA & community: Has homeowners association; Monthly HOA fee; Association amenities: Clubhouse, Pool, Trash Chute; HOA covers grounds and structure maintenance, sewer, trash, water, common areas, recreation facility, and pool service
Exterior
- Security: Other security features
- Utilities: Water service included in HOA; Sewer service included in HOA; Power available
- Home design: Condominium; Resale condition; 3 total stories; Entry level: 1
- Construction: CBS construction
- Exterior features: First floor entry; Waterfront property (no specific waterfront features listed)
Interior
- Kitchen: Includes refrigerator
- Bedrooms: 2 bedrooms (main level)
- Flooring: Tile
- Bathrooms: 2 full bathrooms (main level)
- Heating & cooling: Central heating; Central air conditioning
- Interior features: Refrigerator; Tile flooring
Neighborhood map
What this means for you Summary
Snapshot
- This is a 2-bed/2.0-bath condo listed at $85k.
Deal economics
- At list price, monthly cash flow is $569 ($7k/yr) — positive.
- The deal already cash-flows at list — no discount required.
- Meets the 1% rule at list price ($2k rent vs $85k).
- Recommended offer: $77k (9.0% below list) — sets the bar for market timing.
- Cap rate 14.3% vs local median 4.9% in Sunrise — top-decile yield for the area; either an underpriced asset or a hidden risk that comps aren't pricing in. Stress-test before assuming the spread holds.
Location & tenants
- Location reads 83/100 on livability (#56 in FL, #986 nationally) — a professional / high-income tenant draw. Strengths: commute A+, housing A+, health & safety A+; Watch: employment C-, amenities F.
- Broward (suburban): math 42% / reading 53% proficiency, ranked #46 of 73 in FL (top 63%) — families likely to look elsewhere, expect single-tenant / working-renter base with shorter leases.
- Market conditions: Rents flat; 559 active listings in the ZIP; 40 comparable units currently listed for rent nearby; rentals at typical pace (median 24d on market — plan ~3-4 weeks tenant-placement turnaround); 2,111 units permitted in Broward County in 2024 (1,265 in 5+ unit buildings).
- This rent runs 36% of the median local income ($72k/yr) — at the standard rent-burdened threshold; future hikes will face affordability resistance.
Forward outlook
- Local home prices are declining (-3.0%/yr); year-one equity from $588 of loan paydown is wiped out by about $3k of value loss. Plan a longer hold.
- Broward County population projected at +34% by 2050 — long-run rental-demand tailwind backs the buy-and-hold thesis.
- At projected returns (-3.0% appreciation + 0.6% rent growth), your $24k cash investment doubles in ~5 years — after that, you're playing with house money.
Negotiation context
- It's been on market 98 days — a 9% lower offer ($77k) is reasonable based on typical stale-listing flexibility.
- Current owner paid $26k; list at $85k implies a 229% gain — meaningful room to come down on a strong offer.
Risks & watch-outs
- Watch-outs: HOA is 29% of rent.
Questions for the listing agent
- It's been on market 98 days. Have you received any prior offers? Is the seller open to a 9% concession, seller financing, or rate buy-down credit?
- Built in 1973 — when were the roof, HVAC, electrical panel, plumbing, and water heater last replaced?
- What does the HOA fee cover, when was the last increase, and are there any pending special assessments or reserve-fund shortfalls?
- Any open or pending special assessments — roof, HVAC, plumbing, elevator, façade? What's the per-unit balance and payoff schedule, and is the seller paying it off at close or rolling it to the buyer?
- Why hasn't it sold? Are there any deal-killer items the seller is aware of (foundation, flood, title, zoning, code violations)?
- Is there a deadline driving the sale (1031 exchange, divorce, estate, relocation)? That informs how much negotiation room exists.
- What's the average days-on-market for RENTAL listings here right now (not sales)? A rising rental-DOM trend means longer vacancies and softer asking-rent achievability than the comps imply.
- What's the recent tenant-quality profile in this submarket — average credit score on applications, eviction rate, late-payment / NSF rate, and stable-employment percentage? A property-management company in the area should have these aggregated.
- How much new apartment / multifamily construction is in the pipeline within 1–3 miles? Heavy new supply (>2% of stock underway) typically softens rents 12–24 months out; light construction supports rent growth.
Investment metrics
- 1% rule
- 2.54% ✓
- Cap rate
- 14.33%
- Cash-on-cash
- 28.69%
- DSCR
- 2.28
- GRM
- 3.3
CMA / ARV
No comps found within radius.
Projected returns pro-forma
-3.0% appreciation · 0.6% rent growth · sell at horizon
- IRR
- 19.2%
- Equity multiple
- 1.75×
- Total profit
- $17,750
- Equity at exit
- $12,674
- IRR
- 25.0%
- Equity multiple
- 2.84×
- Total profit
- $43,715
- Equity at exit
- $7,349
Cash invested: $23,800 (down + closing). Projections, not guarantees.
Landlord ↔ Tenant lean methodology
- Overall (STATE)
- 87 Strongly Landlord-Friendly
- State Florida
- 87 Strongly Landlord-Friendly · R+3
- County
- — inherits STATE
- City
- — inherits STATE
ZIP-level market 33322
- Home prices YoY
- -33.3%
- Rents YoY
- 0.6%
- Active inventory
- 559
- Price-to-rent
- 3.3×
Monthly cashflow live
- Estimated rent
- $2,160 high interval (Pro) →
- Mortgage (P&I)
- −$446
- Tax from tax record
- −$26 /mo · $310/yr
- Insurance
- −$35
- HOA
- −$630
- Vacancy / Maint / Mgmt
- −$454
- Net cashflow
- $569
Break-even live
UW: 25.0% down · 7.5% · 30yr · 1.5% tax · 5.0% vac · 8.0% maint · 8.0% mgmt
Financing live
Cash to close
- Down payment
- $21,250
- Closing costs
- $2,550
- Reserves months
- —
- Total cash needed
- —
Loan-product check · same deal, 3 products live
Conventional
25% down · 7.5% · 30yr
- Down + closing
- —
- Monthly P&I
- —
- Monthly cashflow
- —
- DSCR
- —
- Eligible?
- —
Personal DTI + credit; lowest rate.
DSCR
20% down · 8.5% · 30yr
- Down + closing
- —
- Monthly P&I
- —
- Monthly cashflow
- —
- DSCR
- —
- Eligible?
- —
No personal income docs; deal must DSCR.
Hard money
10% down · 12.0% · 12mo
- Down + closing
- —
- Monthly P&I
- —
- Monthly cashflow
- —
- DSCR
- —
- Eligible?
- —
Short-term bridge; refi at stabilization.
Rent comps 40 comps
| Address | Beds | Baths | Sqft | Rent | $/sqft | DOM | Units | Dist |
|---|---|---|---|---|---|---|---|---|
| 3048 E Sunrise Lakes Dr #412 Sunrise, FL | 1.0 | 1.0 | 725 | $1,400 | $1.93 | 22d | 1 | 0.07mi |
| 3048 Sunrise Lakes Dr E Unit 411 Sunrise, FL | 1.0 | 1.0 | 725 | $1,650 | $2.28 | 20d | 1 | 0.07mi |
| 3048 Sunrise Lakes Dr E Unit 411 Sunrise, FL | 1.0 | 1.0 | 725 | $1,600 | $2.21 | 3d | 1 | 0.07mi |
| 7891 Sunrise Lakes Dr N Sunrise, FL | 2.0 | 2.0 | 850 | $2,500 | $2.94 | 24d | 1 | 0.08mi |
| 6885 NW 27th Ct Sunrise, FL | 2.0 | 1.0 | 923 | $2,090 | $2.26 | 12d | 1 | 0.53mi |
| 2534 NW 73rd Ave Sunrise, FL | 1.0 | 1.0 | 950 | $1,750 | $1.84 | 24d | 1 | 0.53mi |
| 8053 W Oakland Park Blvd Sunrise, FL | 1.0 | 1.0 | 846 | $2,779 | $3.28 | 24d | 1 | 0.58mi |
| 8053 W Oakland Park Blvd Unit 5-305 Sunrise, FL | 1.0 | 1.0 | 846 | $2,702 | $3.19 | 24d | 1 | 0.58mi |
| 8053 W Oakland Park Blvd Unit 1-201 Sunrise, FL | 2.0 | 2.0 | 1107 | $3,223 | $2.91 | 24d | 1 | 0.58mi |
| 8053 W Oakland Park Blvd Unit 5-101 Sunrise, FL | 1.0 | 1.0 | 986 | $3,354 | $3.40 | 24d | 1 | 0.58mi |
| 8053 W Oakland Park Blvd Unit 1-204 Sunrise, FL | 1.0 | 1.0 | 735 | $2,450 | $3.33 | 24d | 1 | 0.58mi |
| 8053 W Oakland Park Blvd Unit 6-301 Sunrise, FL | 2.0 | 2.0 | 1124 | $3,411 | $3.03 | 24d | 1 | 0.58mi |
| 8053 W Oakland Park Blvd Unit 6-307 Sunrise, FL | 1.0 | 1.0 | 727 | $2,618 | $3.60 | 24d | 1 | 0.58mi |
| 2921 NW 68th Ter #1 Sunrise, FL | 2.0 | 2.0 | 975 | $1,900 | $1.95 | 24d | 1 | 0.59mi |
| 2921 NW 68th Ter #1 Sunrise, FL | 2.0 | 2.0 | 975 | $1,900 | $1.95 | 7d | 1 | 0.59mi |
| 7461 NW 23rd St Sunrise, FL | 2.0 | 1.0 | 896 | $2,550 | $2.85 | 14d | 1 | 0.62mi |
| 8100 Sunrise Lakes Blvd Sunrise, FL | 1.0–2.0 | 1.0–2.0 | 745 | $2,200 | $2.95 | 11d | 2 | 0.62mi |
| 8110 Sunrise Lakes Blvd #307 Sunrise, FL | 1.0 | 1.0 | 640 | $1,500 | $2.34 | 17d | 1 | 0.63mi |
| 8110 Sunrise Lakes Blvd #307 Sunrise, FL | 1.0 | 1.0 | 640 | $1,500 | $2.34 | 2d | 1 | 0.63mi |
| 8083-8093 W Oakland Park Blvd Sunrise, FL | 1.0–3.0 | 1.0–2.0 | 1054 | $3,226 | $3.06 | 24d | 37 | 0.66mi |
| 8135 Sunrise Lakes Blvd Sunrise, FL | 1.0–2.0 | 1.0–2.0 | 745 | $1,550 | $2.08 | 24d | 2 | 0.67mi |
| 6701 W Oakland Park Blvd Fort Lauderdale, FL | 1.0–2.0 | 1.0–2.0 | 1000 | $2,389 | $2.39 | 2d | 9 | 0.68mi |
| 8135 Sunrise Lakes Blvd #302 Sunrise, FL | 2.0 | 2.0 | 850 | $1,550 | $1.82 | 11d | 1 | 0.68mi |
| 3900 NW 76th Ave #107 Sunrise, FL | 2.0 | 2.0 | 1030 | $1,750 | $1.70 | 24d | 1 | 0.69mi |
| 3671 Environ Blvd #470 Lauderhill, FL | 2.0 | 2.0 | 1100 | $1,875 | $1.70 | 24d | 1 | 0.70mi |
| 3771 Environ Blvd #348 Lauderhill, FL | 2.0 | 2.0 | 1060 | $1,750 | $1.65 | 20d | 1 | 0.72mi |
| 2330 NW 72nd Ave Sunrise, FL | 1.0–2.0 | 1.0 | 742 | $1,900 | $2.56 | 24d | 1 | 0.72mi |
| 3771 Environ Blvd Lauderhill, FL | 1.0–2.0 | 2.0 | 920 | $1,750 | $1.90 | 24d | 2 | 0.72mi |
| 3220 NW 84th Ave Sunrise, FL | 2.0 | 2.0 | 1115 | $2,150 | $1.93 | 24d | 1 | 0.73mi |
| 8225 Sunrise Lakes Blvd #303 Sunrise, FL | 2.0 | 2.0 | 850 | $1,600 | $1.88 | 3d | 1 | 0.74mi |
| 8220 Sunrise Lakes Blvd #309 Sunrise, FL | 2.0 | 2.0 | 850 | $1,650 | $1.94 | 24d | 1 | 0.74mi |
| 3232 NW 84th Ave Sunrise, FL | 2.0 | 2.0 | 1115 | $2,000 | $1.79 | 24d | 1 | 0.77mi |
| 3200 NW 84th Ave Sunrise, FL | 2.0 | 2.0 | 1115 | $2,100 | $1.88 | 24d | 1 | 0.78mi |
| 8310 NW 24th Pl Sunrise, FL | 2.0 | 1.0 | 900 | $2,400 | $2.67 | 18d | 1 | 0.78mi |
| 3244 NW 84th Ave Sunrise, FL | 2.0 | 2.0 | 1115 | $2,300 | $2.06 | 24d | 1 | 0.78mi |
| 8285 Sunrise Lakes Blvd #208 Sunrise, FL | 1.0 | 1.0 | 640 | $1,400 | $2.19 | 24d | 1 | 0.79mi |
| 8285 Sunrise Lakes Blvd #208 Sunrise, FL | 1.0 | 1.0 | 640 | $1,400 | $2.19 | 7d | 1 | 0.79mi |
| 7620 NW 21st St Sunrise, FL | 3.0 | 2.0 | 1082 | $2,750 | $2.54 | 15d | 1 | 0.79mi |
| 3801 Environ Blvd #219 Lauderhill, FL | 2.0 | 2.0 | 1100 | $1,700 | $1.55 | 10d | 1 | 0.80mi |
| 8300 Sunrise Lakes Blvd #212 Sunrise, FL | 2.0 | 2.0 | 850 | $1,900 | $2.24 | 3d | 1 | 0.81mi |
HOA detail condo
- Monthly dues
- $630 · $7,560/yr
- Likely covers
- pool
- Assessments
- None detected in remarks — confirm with the listing agent.
Listing history 16 events
-
2026-06-18days on market $85,000 Active 98 DOM
-
2026-06-17days on market $85,000 Active 97 DOM
-
2026-06-16days on market $85,000 Active 96 DOM
-
2026-06-15days on market $85,000 Active 95 DOM
-
2026-06-13days on market $85,000 Active 93 DOM
-
2026-06-09days on market $85,000 Active 89 DOM
-
2026-06-08days on market $85,000 Active 88 DOM
-
2026-06-07days on market $85,000 Active 87 DOM
-
2026-06-04days on market $85,000 Active 84 DOM
-
2026-06-03days on market $85,000 Active 83 DOM
-
2026-06-01days on market $85,000 Active 82 DOM
-
2026-05-31days on market $85,000 Active 81 DOM
-
2026-05-08price $90,000
-
2026-01-06$95,000 Active
-
1997-09-10soldstatus $25,800
-
1976-01-01soldstatus $22,500
ⓘ Source: listings_history table (triggers on properties + properties_extension) + one-shot
backfill from property_details.listing_events for pre-trigger history.
Tax reassessment forecast FL · Resets to sale price
- Current annual tax
- $310 · $26/mo
- Projected year-2 tax
- $706 · $59/mo
- Expected delta
- +$396/yr (+$33/mo · 127.9%)
ⓘ Screening estimate from a state-policy table — verify with the county assessor before closing.
Nearby sold comps map
Loading sold comps map…
Walkable amenities ~0.75 mi
Loading nearby amenities…
Taxation est. · year 1
- Rental income
- $25,915
- − Mortgage interest
- −$4,761
- − Property taxes
- −$310
- − Insurance
- −$425
- − Repairs & maintenance
- −$2,073
- − Management
- −$2,073
- − HOA
- −$7,560
- − Depreciation
- −$2,473
- Taxable income
- $6,240
- Est. tax owed @ 24.0%
- −$1,498
- After-tax cash flow
- $5,332/yr
For passive investors: Depreciation is non-cash, so a rental often shows a tax loss while cash-flowing — sheltering income. Rental losses are passive: they offset passive income freely, and up to $25,000/yr can offset ordinary (W-2) income if you actively participate and your MAGI is under $100k (phasing out to $0 by $150k); unused losses carry forward. On sale, claimed depreciation is recaptured at up to 25%, and gains may owe capital-gains tax (a 1031 exchange can defer both). Figures are a year-1 estimate at your 24.0% rate — not tax advice; consult a CPA.
Schools (NCES district)
- District
- Broward
- NCES district ID
- 1200180
- Math proficiency
- 42% ▼ -18.00%
- Reading proficiency
- 53% ▼ -5.00%
- Median HH income
- $52,139
- Composite
- 40.88/100
- National rank
- #3621
- State rank
- #46 of 73 in FL
Livability — Sunrise
- Score
- 83/100
- State rank
- #56
- US rank
- #986
Category grades
Schools grade is shown separately in the Schools card above.
Census & demographics
- Census place
- Sunrise, FL
- County
- Broward County · 1,963,430 people
- City population
- 77,492
- Metro
- Miami-Fort Lauderdale-Pompano Beach, FL
- Population (ZIP)
- 41,128
- Household income
- $71,755
- Rent vs Own
- Severe rent burden
- 931.0
Population outlook (Broward County) Hauer SSP2
- Today (2025)
- 2,207,033 people
- By 2030
- 2,360,704 · +7.0%
- By 2040
- 2,661,208 · +20.6%
- By 2050
- 2,946,698 · +33.5%
- By 2075
- 3,602,273 · +63.2%
- By 2100
- 3,970,984 · +79.9%
Race, ethnicity, and origin ACS 2023
- Neighborhood character
- Highly diverse neighborhood (Simpson 0.72)
- Race & ethnicity
- Hispanic / Latino 35% White 32% Black 24% Two or more races 22% Asian 4%
- Hispanic origin (detail)
- Puerto Rican 5% Cuban 6% Dominican 2% Salvadoran 1%
- Common ancestry
- Hispanic 5% Romanian 2% Scotch-Irish 2%
- Foreign-born
- 41% · Canada, Jamaica, South Korea
- Languages at home
- 58% English-only · Spanish 30% French/Haitian/Cajun 6% Other Indo-European 1%
Political lean MEDSL · Broward
- 2024 margin
- D (+17.0) · D 58.0% · R 41.0%
- 2008→2024 swing
- -17.8pp toward R · 2008: 34.7pp · 2024: 17.0pp
- All cycles
- 2024: D+17.0 2020: D+29.8 2016: D+35.0 2012: D+34.9 2008: D+34.7
Not yet ingested
- Civics
- —
Market trends
- HPI YoY
- ▼ -203.34%
- Current HPI
- 407.5452
- Rent YoY
- ▲ 0.60%
- Metro
- Miami-Fort Lauderdale-Pompano Beach, FL
- State GDP YoY
- ▲ 3.28%
- F500 in state
- 36
Industry mix (Fortune 500 HQ in FL)
| Industry | F500 HQs | Revenue |
|---|---|---|
| Industrial Technology | 2 | $29B |
|
||
| Insurance | 2 | $17B |
|
||
| Retail | 1 | $60B |
|
||
| Technology Distribution | 1 | $58B |
|
||
| Homebuilding | 1 | $35B |
|
||
| Technology Manufacturing | 1 | $35B |
|
||
Price history
+300.0% since first listed4 events — show timeline
- 2026-05-08 Price Changed $90,000 Beaches MLS
- 2026-01-06 Listed $95,000 Beaches MLS
- 1997-09-10 Sold (Public Records) $25,800 Public Records
- 1976-01-01 Sold (Public Records) $22,500 Public Records
Property tax history
+5.9%/yrLatest (2025): $310 · +10.7% YoY. Source: county tax records.
Cash-flow waterfall
monthlySold comps — $/sqft
last 12 mo · ≤1 miLoading sold comps…