818 Buskill Ave · Richlands, VA
Flood risk No data
- FEMA flood zone
- —
- Chance of flooding over 30 yrs
- —
- Est. flood insurance / yr
- —
Fire risk No data
- Est. fire insurance / yr
- —
Heat risk No data
- Hot days now (above threshold)
- —
- Hot days in 30 yrs
- —
Wind risk No data
- Chance of severe wind over 30 yrs
- —
Air-quality risk No data
- Unhealthy air days now
- —
- Unhealthy air days in 30 yrs
- —
Risk factors via First Street. Map © Google.
Why this score? — see what drove the D+ grade
The composite is a weighted blend of 9 inputs, each scored 0–100. Each bar is that input's sub-score; the figure is the points it added to the 100-point composite (weight × sub-score).
- Cash flow +20.3/30.0
- DSCR +6.4/10.0
- Schools +6.0/10.0
- 1% rule +4.2/10.0
- Appreciation +4.1/10.0
- Livability +3.3/5.0
- Rent growth +2.5/5.0
- Condition / age +2.5/5.0
- ARV discount +0.0/15.0
$99,000
🖨 Deal sheet (PDF) 📄 Offer letter ✓ Due diligence
Listing remarks
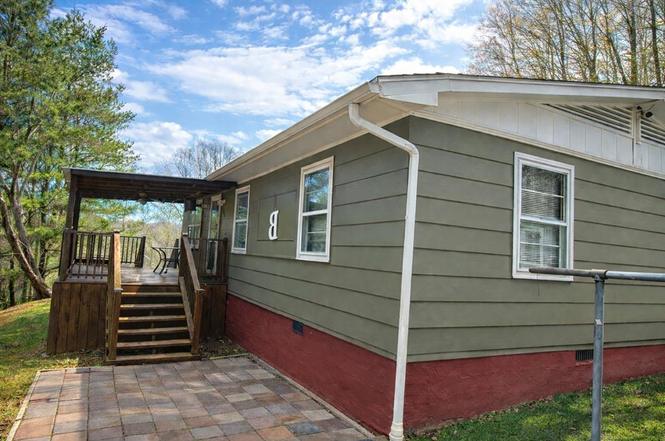
This inviting 3-bedroom, 1-bath modular home is situated on 0.84 acres, offering the convenience of in-town living while still providing plenty of privacy. The home features classic paneling walls, creating a solid foundation for updates and personal touches. Outside, the property includes two storage buildings, perfect for tools, equipment, or hobbies, along with an above-ground pool for relaxing and entertaining during warmer months. With ample outdoor space and endless interior potential, this property is an excellent starter home and a wonderful opportunity to put your own stamp on the interior.
Key facts
- Ample outdoor space
- Modular home
- Above-ground pool
Tags
Property features AI
Exterior
- Utilities: Public water; Public sewer
- Home design: Manufactured single-family home; One story
- Construction: Masonite exterior; Shingle roof
- Exterior features: Deck; Above-ground pool
Interior
- Flooring: Laminate; Vinyl; Wood
- Bathrooms: 1 full bathroom
- Heating & cooling: Heat pump heating
- Interior features: Laminate, vinyl, and wood flooring
Neighborhood map
What this means for you Summary
Snapshot
- This is a 3-bed/1.0-bath single-family listed at $99k.
Deal economics
- At list price, monthly cash flow is $126 ($2k/yr) — positive.
- The deal already cash-flows at list — no discount required.
- To meet the 1% rule (rent ≥ 1% of price), the offer needs to be $91k (8.3% below list).
- Recommended offer: $87k (12.0% below list) — sets the bar for market timing.
- Cap rate 7.8% vs local median 4.4% in Richlands — top-decile yield for the area; either an underpriced asset or a hidden risk that comps aren't pricing in. Stress-test before assuming the spread holds.
Location & tenants
- Location reads 66/100 on livability (#314 in VA) — a middle-class / working-renter tenant base. Strengths: cost of living A+, housing A-; Watch: crime C-, amenities F, commute F.
- Tazewell County Public School District (town): math 67% / reading 78% proficiency, ranked #21 of 131 in VA (top 16%) — strong family-tenant draw, lease renewals of 3-5y typical.
- Zoned schools: Richlands Elementary (math 69% / reading 79%, grade A, #248 of 1,108 statewide, top 23%, 547 students, 83% FRL); Richlands Middle (math 58% / reading 71%, grade A-, #123 of 342 statewide, top 37%, 495 students, 83% FRL); Richlands High (math 68% / reading 87%, grade A-, #83 of 319 statewide, top 28%, 636 students, 82% FRL) — zoned schools average 83% FRL vs 47% district-wide (36 pts higher); higher-poverty schools than district average — tighter screening recommended.
- Market conditions: 46 active listings in the ZIP; 4 units permitted in Tazewell County in 2024 (0 in 5+ unit buildings).
Forward outlook
- Local home prices are declining (-1.9%/yr); year-one equity from $684 of loan paydown is wiped out by about $2k of value loss. Plan a longer hold.
- Tazewell County population projected at -30% by 2050 — secular population decline; favor cash flow + early exit over multi-decade hold.
Negotiation context
- It's been on market 182 days — a 12% lower offer ($87k) is reasonable based on typical stale-listing flexibility.
Questions for the listing agent
- It's been on market 182 days. Have you received any prior offers? Is the seller open to a 12% concession, seller financing, or rate buy-down credit?
- Built in 1973 — when were the roof, HVAC, electrical panel, plumbing, and water heater last replaced?
- Why hasn't it sold? Are there any deal-killer items the seller is aware of (foundation, flood, title, zoning, code violations)?
- Is there a deadline driving the sale (1031 exchange, divorce, estate, relocation)? That informs how much negotiation room exists.
- Schools are B-rated — typically a magnet for longer-tenancy family renters. What's the average tenant stay here, and is there a school-zone premium baked into asking?
- The area grade is low — what's the realistic commute time and amenity access for the typical tenant pool here? Any planned neighborhood developments (good or bad) we should know about?
- What's the average days-on-market for RENTAL listings here right now (not sales)? A rising rental-DOM trend means longer vacancies and softer asking-rent achievability than the comps imply.
- What's the recent tenant-quality profile in this submarket — average credit score on applications, eviction rate, late-payment / NSF rate, and stable-employment percentage? A property-management company in the area should have these aggregated.
- How much new for-sale + rental construction is in the pipeline within 1–3 miles? Heavy new supply typically softens prices + rents 12–24 months out; constrained supply supports both.
Investment metrics
- 1% rule
- 0.92% ✗
- Cap rate
- 7.82%
- Cash-on-cash
- 5.45%
- DSCR
- 1.24
- GRM
- 9.1
CMA / ARV
- ARV (on-the-fly)
- $83,520
- Comps found
- 4
Show comp detail 4 sales within ~0.75 mi
| Address | Dist | Beds/Ba | Sqft | Sold | Price | $/sf | Match |
|---|---|---|---|---|---|---|---|
| 1304 Mcdowell St | 0.38mi | 3/1.0 | 1,000 (+4%) | 13mo | $52,500 | $53 | 65 |
| 1818 5th St | 0.30mi | 3/1.0 | 1,026 (+7%) | 12mo | $71,000 | $69 | 65 |
| 717 Front St | 0.61mi | 3/1.0 | 966 (+1%) | 10mo | $120,000 | $124 | 62 |
| 194 Gate Rd | 0.37mi | 2/1.0 (-1) | 900 (-6%) | 10mo | $78,000 | $87 | 59 |
Match score weights: distance 35% · size 25% · config 20% · recency 20%. Top-matched comps best support the ARV.
Projected returns pro-forma
-1.87% appreciation · 3.0% rent growth · sell at horizon
- IRR
- -2.9%
- Equity multiple
- 0.88×
- Total profit
- $-3,307
- Equity at exit
- $19,821
- IRR
- 4.9%
- Equity multiple
- 1.42×
- Total profit
- $11,544
- Equity at exit
- $17,508
Cash invested: $27,720 (down + closing). Projections, not guarantees.
Landlord ↔ Tenant lean methodology
- Overall (STATE)
- 55 Moderately Landlord-Leaning
- State Virginia
- 55 Moderately Landlord-Leaning · D+2
- County
- — inherits STATE
- City
- — inherits STATE
ZIP-level market 24641
- Home prices YoY
- -1.3%
- Active inventory
- 46
- Price-to-rent
- 9.1×
Monthly cashflow live
- Estimated rent
- $908 medium interval (Pro) →
- Mortgage (P&I)
- −$519
- Tax from tax record
- −$31 /mo · $369/yr
- Insurance
- −$41
- HOA
- −$0
- Vacancy / Maint / Mgmt
- −$191
- Net cashflow
- $126
Break-even live
Sensitivity live
| Price | -10% $182 | -5% $154 | +0% $126 | +5% $98 | +10% $70 |
|---|---|---|---|---|---|
| Rent | -10% $54 | -5% $90 | +0% $126 | +5% $162 | +10% $198 |
| Rate | -1.0pp $176 | -0.5pp $151 | base $126 | +0.5pp $100 | +1.0pp $74 |
UW: 25.0% down · 7.5% · 30yr · 1.5% tax · 5.0% vac · 8.0% maint · 8.0% mgmt
Financing live
Cash to close
- Down payment
- $24,750
- Closing costs
- $2,970
- Reserves months
- —
- Total cash needed
- —
Loan-product check · same deal, 3 products live
Conventional
25% down · 7.5% · 30yr
- Down + closing
- —
- Monthly P&I
- —
- Monthly cashflow
- —
- DSCR
- —
- Eligible?
- —
Personal DTI + credit; lowest rate.
DSCR
20% down · 8.5% · 30yr
- Down + closing
- —
- Monthly P&I
- —
- Monthly cashflow
- —
- DSCR
- —
- Eligible?
- —
No personal income docs; deal must DSCR.
Hard money
10% down · 12.0% · 12mo
- Down + closing
- —
- Monthly P&I
- —
- Monthly cashflow
- —
- DSCR
- —
- Eligible?
- —
Short-term bridge; refi at stabilization.
Listing history 20 events
-
2026-06-22days on market $99,000 Active 182 DOM
-
2026-06-21days on market $99,000 Active 181 DOM
-
2026-06-19days on market $99,000 Active 179 DOM
-
2026-06-18days on market $99,000 Active 178 DOM
-
2026-06-17days on market $99,000 Active 177 DOM
-
2026-06-16days on market $99,000 Active 176 DOM
-
2026-06-16status $99,000 Active 175 DOM
-
2026-06-15days on market $99,000 Active Under Contract 175 DOM
-
2026-06-14days on market $99,000 Active Under Contract 173 DOM
-
2026-06-12days on market $99,000 Active Under Contract 172 DOM
-
2026-06-09days on market $99,000 Active Under Contract 169 DOM
-
2026-06-08days on market $99,000 Active Under Contract 168 DOM
-
2026-06-07days on market $99,000 Active Under Contract 167 DOM
-
2026-06-03days on market $99,000 Active Under Contract 163 DOM
-
2026-06-02days on market $99,000 Active Under Contract 162 DOM
-
2026-06-01days on market $99,000 Active Under Contract 161 DOM
-
2026-05-31days on market $99,000 Active Under Contract 160 DOM
-
2026-05-30days on market $99,000 Active Under Contract 159 DOM
-
2025-12-30historical Active Under Contract
-
2025-12-22$99,000 Active
ⓘ Source: listings_history table (triggers on properties + properties_extension) + one-shot
backfill from property_details.listing_events for pre-trigger history.
Tax reassessment forecast VA · Resets to sale price
- Current annual tax
- $369 · $31/mo
- Projected year-2 tax
- $812 · $68/mo
- Expected delta
- +$443/yr (+$37/mo · 120.1%)
ⓘ Screening estimate from a state-policy table — verify with the county assessor before closing.
Nearby sold comps map
Loading sold comps map…
Walkable amenities ~0.75 mi
Loading nearby amenities…
Taxation est. · year 1
- Rental income
- $10,893
- − Mortgage interest
- −$5,546
- − Property taxes
- −$369
- − Insurance
- −$495
- − Repairs & maintenance
- −$871
- − Management
- −$871
- − Depreciation
- −$2,880
- Taxable loss
- −$139
- Est. tax savings @ 24.0%
- +$33
- After-tax cash flow
- $1,545/yr
For passive investors: Depreciation is non-cash, so a rental often shows a tax loss while cash-flowing — sheltering income. Rental losses are passive: they offset passive income freely, and up to $25,000/yr can offset ordinary (W-2) income if you actively participate and your MAGI is under $100k (phasing out to $0 by $150k); unused losses carry forward. On sale, claimed depreciation is recaptured at up to 25%, and gains may owe capital-gains tax (a 1031 exchange can defer both). Figures are a year-1 estimate at your 24.0% rate — not tax advice; consult a CPA.
Schools (NCES district)
- District
- Tazewell County Public School District
- NCES district ID
- 5103810
- Math proficiency
- 67% ▼ -23.00%
- Reading proficiency
- 78% ▼ -6.00%
- Median HH income
- $37,003
- Composite
- 60.16/100
- National rank
- #865
- State rank
- #21 of 131 in VA
Livability — Richlands
- Score
- 66/100
- State rank
- #314
- US rank
- #11229
Category grades
Schools grade is shown separately in the Schools card above.
Census & demographics
- Census place
- Richlands, VA
- Population (ZIP)
- 5,417
Population outlook (Tazewell County) Hauer SSP2
- Today (2025)
- 38,275 people
- By 2030
- 35,719 · -6.7%
- By 2040
- 30,875 · -19.3%
- By 2050
- 26,798 · -30.0%
- By 2075
- 19,286 · -49.6%
- By 2100
- 13,631 · -64.4%
Race, ethnicity, and origin ACS 2023
- Neighborhood character
- Predominantly White (98%)
- Race & ethnicity
- White 98% Asian 2%
- Common ancestry
- Serbian 1% Italian 1%
- Foreign-born
- 1%
- Languages at home
- 98% English-only · Other Indo-European 1%
Political lean MEDSL · Tazewell
- 2024 margin
- Solid R (+68.9) · D 15.3% · R 84.2%
- 2008→2024 swing
- -36.0pp toward R · 2008: -32.9pp · 2024: -68.9pp
- All cycles
- 2024: R+68.9 2020: R+67.2 2016: R+66.3 2012: R+57.5 2008: R+32.9
Not yet ingested
- Civics
- —
Market trends
- HPI YoY
- ▼ -1.87%
- Current HPI
- 141.9823
- Rent YoY
- —
- Metro
- —
- State GDP YoY
- ▲ 2.40%
- F500 in state
- 50
Industry mix (Fortune 500 HQ in VA)
| Industry | F500 HQs | Revenue |
|---|---|---|
| Aerospace / Defense | 4 | $236B |
|
||
| Technology / Defense | 3 | $32B |
|
||
| Financial Services | 2 | $176B |
|
||
| Utilities | 2 | $27B |
|
||
| Insurance | 2 | $25B |
|
||
| Technology | 2 | $15B |
|
||
Price history
2 events — show timeline
- 2025-12-30 Contingent — SWVAR
- 2025-12-22 Listed $99,000 SWVAR
Property tax history
+2.0%/yrLatest (2025): $369 · +0.0% YoY. Source: county tax records.
Cash-flow waterfall
monthlySold comps — $/sqft
last 12 mo · ≤1 miLoading sold comps…