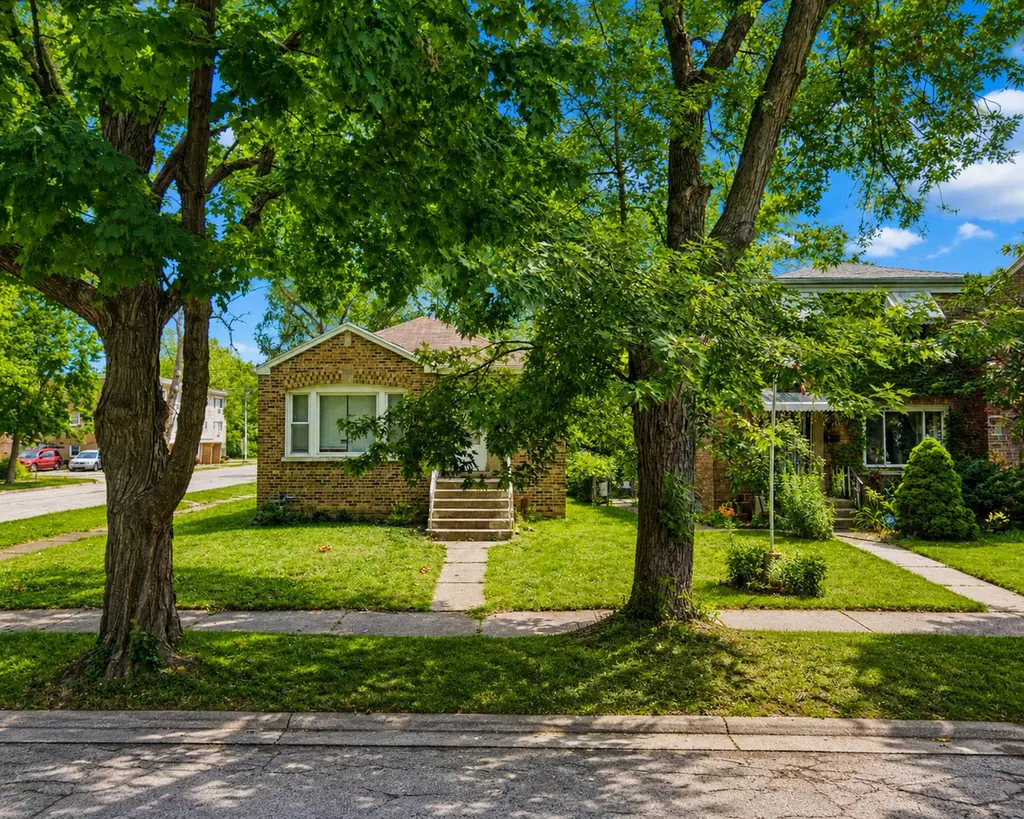
14301 S Edbrooke Ave · Riverdale, IL
Flood risk 1/10 · Minimal
- FEMA flood zone
- X (unshaded)
- Chance of flooding over 30 yrs
- 0.0%
- Est. flood insurance / yr
- $473 – $860
Fire risk 1/10 · Minimal
- Est. fire insurance / yr
- $804 – $1,492
Heat risk 3/10 · Minor
- Hot days now (above 101°F)
- 7 days/yr
- Hot days in 30 yrs
- 15 days/yr
Wind risk 2/10 · Minimal
- Chance of severe wind over 30 yrs
- —
Air-quality risk 4/10 · Minor
- Unhealthy air days now
- 4 days/yr
- Unhealthy air days in 30 yrs
- 5 days/yr
Risk factors via First Street. Map © Google.
Why this score? — see what drove the D- grade
The composite is a weighted blend of 9 inputs, each scored 0–100. Each bar is that input's sub-score; the figure is the points it added to the 100-point composite (weight × sub-score).
- Cash flow +14.1/30.0
- 1% rule +6.6/10.0
- Rent growth +4.5/5.0
- DSCR +4.3/10.0
- Livability +3.5/5.0
- Condition / age +2.5/5.0
- Schools +0.7/10.0
- ARV discount +0.0/15.0
- Appreciation +0.0/10.0
$161,000
🖨 Deal sheet 📄 Offer letter ✓ Due diligence
Listing remarks MLS
Brick home features living room, dining room, kitchen, 3 bedrooms and 1 bath. Full basement. Home is being sold "as Is". Buyer responsible for any all repairs. Property is occupied & occupants are not to be disturbed or contacted under any circumstances. Interior inspections are not available. $1000.00 to buyer at closing.
Key facts
- Parking
- Built 1950
- Listed 44 days
Property features AI
Finance
- Other: Property located in Ivanhoe subdivision, Riverdale (Thornton Township)
- HOA & community: No master association fee required; Community features include curbs, sidewalks, street lights and paved streets
Exterior
- Parking: One parking space; Dirt driveway
- Utilities: Water from Lake Michigan; Septic-mechanical and storm sewer; 100 amp electric service with circuit breakers
- Home design: Detached single-family raised ranch; Fee simple ownership; Built approximately 71–80 years ago; Built before 1978
- Construction: Brick construction; Asphalt roof; Concrete perimeter foundation
- Exterior features: Corner lot; Fenced yard; Curbs, sidewalks and street lights; Paved streets
Interior
- Kitchen: Kitchen on main level (8 x 13)
- Bedrooms: Three bedrooms total; Main level master bedroom (10 x 13); Main level bedroom (10 x 12); Main level bedroom (10 x 10)
- Flooring: Hardwood and laminate flooring; Carpet in living room, dining room and bedrooms; Other flooring in kitchen
- Bathrooms: One full bathroom; Basement contains bathroom facilities
- Heating & cooling: Natural gas forced air heating; Central air conditioning
- Interior features: Partially finished full basement; Gas dryer hookup; TV cable and satellite ready; CO detectors; Ceiling fans; Six total rooms
- Laundry & utility: Dedicated laundry room; Gas dryer hookup
Neighborhood map
What this means for you Summary
Snapshot
- This is a 3-bed/1.0-bath single-family listed at $161k.
Deal economics
- At list price, monthly cash flow is $25 ($298/yr) — positive.
- The deal already cash-flows at list — no discount required.
- Meets the 1% rule at list price ($2k rent vs $161k).
- Recommended offer: $156k (3.0% below list) — sets the bar for market timing.
- Cap rate 6.5% vs local median 9.5% in Riverdale — below-typical yield; the buyer is paying a premium for something (appreciation thesis, condition, location) that the cap rate doesn't capture.
Location & tenants
- Location reads 69/100 on livability (#434 in IL) — a middle-class / working-renter tenant base. Strengths: commute A+, cost of living A+, housing A-; Watch: health & safety C-, schools F, crime F.
- Thornton Twp Hsd 205 (suburban): math 7% / reading 8% proficiency, ranked #594 of 620 in IL (top 96%) — low school quality limits family demand, transient renter base, plan for 1-2y turnover.
- Market conditions: Rents rising fast (+7.8%/yr); 76 active listings in the ZIP; 14 comparable units currently listed for rent nearby; rentals at typical pace (median 25d on market — plan ~3-4 weeks tenant-placement turnaround); lower-income renter base — watch delinquency; 6,272 units permitted in Cook County in 2024 (4,658 in 5+ unit buildings).
- At $1,860/mo this rent would consume 60% of the median local household income ($37k/yr) (locally 1868% of renters already pay >50% of income on rent) — very limited rent-growth headroom before tenants either downsize or default.
Forward outlook
- Local home prices are declining (-3.0%/yr); year-one equity from $1k of loan paydown is wiped out by about $5k of value loss. Plan a longer hold.
Negotiation context
- It's been on market 44 days — a 3% lower offer ($156k) is reasonable based on typical stale-listing flexibility.
- 6 sale attempts since 12y ago with the ask held roughly flat each time — persistent listings suggest the price (not the market) is what's stuck; bring a comps-based counter.
- Current owner paid $8k; list at $161k implies a 1794% gain — meaningful room to come down on a strong offer.
Risks & watch-outs
- Watch-outs: property tax is 4.0% of price; built in 1950 — expect roof / HVAC / electrical / plumbing capex.
Questions for the listing agent
- It's been on market 44 days. Have you received any prior offers? Is the seller open to a 3% concession, seller financing, or rate buy-down credit?
- Built in 1950 — when were the roof, HVAC, electrical panel, plumbing, and water heater last replaced?
- Property tax is high relative to price — has the assessment been appealed recently, and will the sale trigger a re-assessment?
- Is there a deadline driving the sale (1031 exchange, divorce, estate, relocation)? That informs how much negotiation room exists.
- Schools are F-rated, which usually means shorter tenancies and higher turnover. Who's the typical renter profile here, and what's been the actual vacancy rate?
- Crime grade is F in this area — have there been break-ins, vandalism, or insurance claims at this property in the last 3 years? What carrier currently insures it and at what premium?
- The area grade is low — what's the realistic commute time and amenity access for the typical tenant pool here? Any planned neighborhood developments (good or bad) we should know about?
- What's the average days-on-market for RENTAL listings here right now (not sales)? A rising rental-DOM trend means longer vacancies and softer asking-rent achievability than the comps imply.
- What's the recent tenant-quality profile in this submarket — average credit score on applications, eviction rate, late-payment / NSF rate, and stable-employment percentage? A property-management company in the area should have these aggregated.
- How much new for-sale + rental construction is in the pipeline within 1–3 miles? Heavy new supply typically softens prices + rents 12–24 months out; constrained supply supports both.
Investment metrics
- 1% rule
- 1.16% ✓
- Cap rate
- 6.48%
- Cash-on-cash
- 0.66%
- DSCR
- 1.03
- GRM
- 7.2
CMA / ARV
- ARV (on-the-fly)
- $120,716
- Comps found
- 12
Show comp detail 12 sales within ~0.75 mi
| Address | Dist | Beds/Ba | Sqft | Sold | Price | $/sf | Match |
|---|---|---|---|---|---|---|---|
| 14234 S Michigan Ave | 0.10mi | 3/1.0 | 1,102 (-6%) | 3mo | $114,000 | $103 | 83 |
| 201 E 143rd St | 0.06mi | 4/2.0 (+1) | 1,129 (-4%) | 0mo | $95,000 | $84 | 82 |
| 14525 S Michigan Ave | 0.33mi | 3/1.0 | 1,200 (+2%) | 2mo | $190,000 | $158 | 79 |
| 14135 S La Salle St | 0.41mi | 3/1.5 | 1,210 (+3%) | 1mo | $60,000 | $50 | 73 |
| 228 E 141st St | 0.30mi | 4/2.0 (+1) | 1,200 (+2%) | 1mo | $235,000 | $196 | 72 |
| 14619 Martin Luther King Jr Dr | 0.70mi | 3/1.0 | 1,153 (-2%) | 2mo | $163,000 | $141 | 63 |
| 14231 S State St | 0.19mi | 2/1.0 (-1) | 1,000 (-15%) | 0mo | $145,000 | $145 | 61 |
| 506 E 144th St | 0.46mi | 3/1.0 | 1,020 (-13%) | 2mo | $48,500 | $48 | 56 |
| 14633 Wabash Ave | 0.47mi | 3/7.0 | 1,150 (-2%) | 1mo | $95,000 | $83 | 54 |
| 302 W 145th St | 0.65mi | 3/2.0 | 1,087 (-7%) | 0mo | $250,000 | $230 | 53 |
| 14828 Wabash Ave | 0.71mi | 3/1.0 | 1,296 (+11%) | 1mo | $112,000 | $86 | 49 |
| 13829 S State St | 0.60mi | 3/1.5 | 1,000 (-15%) | 2mo | $80,000 | $80 | 44 |
Match score weights: distance 35% · size 25% · config 20% · recency 20%. Top-matched comps best support the ARV.
Projected returns pro-forma
-3.0% appreciation · 7.82% rent growth · sell at horizon
- IRR
- -8.4%
- Equity multiple
- 0.67×
- Total profit
- $-14,817
- Equity at exit
- $24,006
- IRR
- 7.6%
- Equity multiple
- 1.73×
- Total profit
- $32,959
- Equity at exit
- $13,920
Cash invested: $45,080 (down + closing). Projections, not guarantees.
Landlord ↔ Tenant lean methodology
- Overall (STATE)
- 43 Moderately Tenant-Leaning
- State Illinois
- 43 Moderately Tenant-Leaning · D+7
- County
- — inherits STATE
- City
- — inherits STATE
ZIP-level market 60827
- Home prices YoY
- -31.8%
- Rents YoY
- 7.8%
- Active inventory
- 76
- Price-to-rent
- 7.2×
Monthly cashflow live
- Estimated rent
- $1,860 high interval (Pro) →
- Mortgage (P&I)
- −$844
- Tax from tax record
- −$533 /mo · $6,396/yr
- Insurance
- −$67
- HOA
- −$0
- Vacancy / Maint / Mgmt
- −$391
- Net cashflow
- $25
Break-even live
UW: 25.0% down · 7.5% · 30yr · 1.5% tax · 5.0% vac · 8.0% maint · 8.0% mgmt
Financing live
Cash to close
- Down payment
- $40,250
- Closing costs
- $4,830
- Reserves months
- —
- Total cash needed
- —
Loan-product check · same deal, 3 products live
Conventional
25% down · 7.5% · 30yr
- Down + closing
- —
- Monthly P&I
- —
- Monthly cashflow
- —
- DSCR
- —
- Eligible?
- —
Personal DTI + credit; lowest rate.
DSCR
20% down · 8.5% · 30yr
- Down + closing
- —
- Monthly P&I
- —
- Monthly cashflow
- —
- DSCR
- —
- Eligible?
- —
No personal income docs; deal must DSCR.
Hard money
10% down · 12.0% · 12mo
- Down + closing
- —
- Monthly P&I
- —
- Monthly cashflow
- —
- DSCR
- —
- Eligible?
- —
Short-term bridge; refi at stabilization.
Rent comps 14 comps
| Address | Beds | Baths | Sqft | Rent | $/sqft | DOM | Units | Dist |
|---|---|---|---|---|---|---|---|---|
| 14124 Manor Ave Dolton, IL | 3.0 | 2.0 | 1440 | $2,390 | $1.66 | 24d | 1 | 0.27mi |
| 14101 S Atlantic Ave Riverdale, IL | 2.0 | 1.0 | 790 | $1,140 | $1.44 | 7d | 1 | 0.57mi |
| 13841 Forest Ave Dolton, IL | 3.0 | 1.0 | 930 | $1,895 | $2.04 | 24d | 1 | 0.67mi |
| 14844 Wabash Ave Dolton, IL | 3.0 | 1.5 | 1277 | $2,320 | $1.82 | 24d | 1 | 0.73mi |
| 13810 S La Salle St #1 Riverdale, IL | 3.0 | 1.0 | 800 | $1,550 | $1.94 | 2d | 1 | 0.75mi |
| 14015 S Stewart Ave Unit 2W Riverdale, IL | 2.0 | 1.0 | 800 | $1,400 | $1.75 | 24d | 1 | 0.78mi |
| 14305 Irving Ave Unit 2 Dolton, IL | 3.0 | 1.0 | 1100 | $2,200 | $2.00 | 24d | 1 | 0.80mi |
| 13708 S Wentworth Ave Riverdale, IL | 3.0 | 1.5 | 1500 | $2,200 | $1.47 | 22d | 1 | 0.88mi |
| 13604 S Wentworth Ave Riverdale, IL | 3.0 | 1.0 | 1100 | $1,200 | $1.09 | 24d | 1 | 0.99mi |
| 14500 Cottage Grove Ave Unit 3 Dolton, IL | 2.0 | 1.0 | 1000 | $1,475 | $1.48 | 24d | 1 | 1.05mi |
| 14817 Champlain Ave Dolton, IL | 2.0 | 1.0 | 980 | $2,430 | $2.48 | 22d | 1 | 1.09mi |
| 14916 Langley Ave Dolton, IL | 3.0 | 1.5 | 1418 | $2,500 | $1.76 | 24d | 1 | 1.19mi |
| 724 W 138th St Unit 3 Riverdale, IL | 2.0 | 1.0 | 800 | $1,250 | $1.56 | 18d | 1 | 1.30mi |
| 15238 Doctor Martin Luther King Junior Dr Unit 2W Dolton, IL | 2.0 | 1.0 | 800 | $1,500 | $1.88 | 10d | 1 | 1.31mi |
Listing history 31 events
-
2026-06-18days on market $161,000 Active 44 DOM
-
2026-06-17days on market $161,000 Active 43 DOM
-
2026-06-16days on market $161,000 Active 42 DOM
-
2026-06-15days on market $161,000 Active 41 DOM
-
2026-06-13days on market $161,000 Active 39 DOM
-
2026-06-13days on market $161,000 Active 38 DOM
-
2026-06-09days on market $161,000 Active 35 DOM
-
2026-06-08days on market $161,000 Active 34 DOM
-
2026-06-07days on market $161,000 Active 33 DOM
-
2026-06-04days on market $161,000 Active 30 DOM
-
2026-06-03days on market $161,000 Active 29 DOM
-
2026-06-02days on market $161,000 Active 28 DOM
-
2026-06-01days on market $161,000 Active 27 DOM
-
2026-05-31days on market $161,000 Active 26 DOM
-
2026-05-22price $161,000
-
2026-05-05$165,000 Active
-
2026-02-17historical $1,750
-
2026-02-13$1,750
-
2026-02-09historical $1,650
-
2026-01-31price $1,650
-
2026-01-28$1,600
-
2015-04-30soldstatus $8,500 Closed Sale 338-char remark
Show marketing remark (338 chars)
Brick home features living room, dining room, kitchen, 3 bedrooms and 1 bath. Full basement. Home is being sold "as Is". Buyer responsible for any all repairs. Property is occupied & occupants are not to be disturbed or contacted under any circumstances. Interior inspections are not available. $1000.00 to buyer at closing.
-
2015-04-28status Pending 338-char remark
Show marketing remark (338 chars)
Brick home features living room, dining room, kitchen, 3 bedrooms and 1 bath. Full basement. Home is being sold "as Is". Buyer responsible for any all repairs. Property is occupied & occupants are not to be disturbed or contacted under any circumstances. Interior inspections are not available. $1000.00 to buyer at closing.
-
2015-02-20historical 338-char remark
Show marketing remark (338 chars)
Brick home features living room, dining room, kitchen, 3 bedrooms and 1 bath. Full basement. Home is being sold "as Is". Buyer responsible for any all repairs. Property is occupied & occupants are not to be disturbed or contacted under any circumstances. Interior inspections are not available. $1000.00 to buyer at closing.
-
2015-02-11$22,400 New 338-char remark
Show marketing remark (338 chars)
Brick home features living room, dining room, kitchen, 3 bedrooms and 1 bath. Full basement. Home is being sold "as Is". Buyer responsible for any all repairs. Property is occupied & occupants are not to be disturbed or contacted under any circumstances. Interior inspections are not available. $1000.00 to buyer at closing.
-
2015-02-10historical
-
2015-01-30price
-
2014-12-12status Active
-
2014-12-07historical
-
2014-11-26New
-
1991-05-28soldstatus $55,000
ⓘ Source: listings_history table (triggers on properties + properties_extension) + one-shot
backfill from property_details.listing_events for pre-trigger history.
Tax reassessment forecast IL · Partial reset (capped growth)
- Current annual tax
- $6,396 · $533/mo
- Projected year-2 tax
- $6,396 · $533/mo
- Expected delta
- $0/yr ($0/mo · 0.0%)
ⓘ Screening estimate from a state-policy table — verify with the county assessor before closing.
Climate risk First Street
- Flood 1/10 Low FEMA zone X (unshaded) · 0% chance over 30 yrs
- Wildfire 1/10 Low
- Heat 3/10 Moderate 7 d/yr ≥101°F today · 15 d/yr by 30 yrs out
- Wind 2/10 Low
- Air quality 4/10 Moderate 4 unhealthy d/yr today · 5 by 30 yrs out
Nearby sold comps map
Loading sold comps map…
Walkable amenities ~0.75 mi
Loading nearby amenities…
Taxation est. · year 1
- Rental income
- $22,317
- − Mortgage interest
- −$9,019
- − Property taxes
- −$6,396
- − Insurance
- −$805
- − Repairs & maintenance
- −$1,785
- − Management
- −$1,785
- − Depreciation
- −$4,684
- Taxable loss
- −$2,157
- Est. tax savings @ 24.0%
- +$518
- After-tax cash flow
- $816/yr
For passive investors: Depreciation is non-cash, so a rental often shows a tax loss while cash-flowing — sheltering income. Rental losses are passive: they offset passive income freely, and up to $25,000/yr can offset ordinary (W-2) income if you actively participate and your MAGI is under $100k (phasing out to $0 by $150k); unused losses carry forward. On sale, claimed depreciation is recaptured at up to 25%, and gains may owe capital-gains tax (a 1031 exchange can defer both). Figures are a year-1 estimate at your 24.0% rate — not tax advice; consult a CPA.
Schools (NCES district)
- District
- Thornton Twp Hsd 205
- NCES district ID
- 1738970
- Math proficiency
- 7% ▬ 0.00%
- Reading proficiency
- 8% ▼ -2.00%
- Median HH income
- $43,392
- Composite
- 6.92/100
- National rank
- #9976
- State rank
- #594 of 620 in IL
Livability — Riverdale
- Score
- 69/100
- State rank
- #434
- US rank
- #8867
Category grades
Schools grade is shown separately in the Schools card above.
Census & demographics
- Census place
- Riverdale, IL
- County
- Cook County · 4,486,803 people
- City population
- 24,713
- Metro
- Chicago-Naperville-Elgin, IL-IN-WI
- Population (ZIP)
- 24,713
- Household income
- $37,217
- Rent vs Own
- Severe rent burden
- 1868.0
Population outlook (Cook County) Hauer SSP2
- Today (2025)
- 5,347,519 people
- By 2030
- 5,357,703 · +0.2%
- By 2040
- 5,324,924 · -0.4%
- By 2050
- 5,230,762 · -2.2%
- By 2075
- 4,785,735 · -10.5%
- By 2100
- 4,188,836 · -21.7%
Race, ethnicity, and origin ACS 2023
- Neighborhood character
- Predominantly Black (88%)
- Race & ethnicity
- Black 88% Two or more races 5% Hispanic / Latino 5% White 2%
- Common ancestry
- Iranian 1%
- Foreign-born
- 2% · Canada
- Languages at home
- 96% English-only · Spanish 3%
Political lean MEDSL · Cook
- 2024 margin
- Solid D (+42.0) · D 70.4% · R 28.4% · Other 1.2%
- 2008→2024 swing
- -11.4pp toward R · 2008: 53.4pp · 2024: 42.0pp
- All cycles
- 2024: D+42.0 2020: D+50.3 2016: D+53.0 2012: D+49.4 2008: D+53.4
Not yet ingested
- Civics
- —
Market trends
- HPI YoY
- ▼ -76.39%
- Current HPI
- 163.7725
- Rent YoY
- ▲ 7.82%
- Metro
- Chicago-Naperville-Elgin, IL-IN-WI
- State GDP YoY
- ▲ 1.59%
- F500 in state
- 60
Industry mix (Fortune 500 HQ in IL)
| Industry | F500 HQs | Revenue |
|---|---|---|
| Insurance | 4 | $201B |
|
||
| Consumer Goods | 4 | $87B |
|
||
| Industrial Machinery | 3 | $64B |
|
||
| Healthcare | 2 | $55B |
|
||
| Retail / Pharmacy | 1 | $148B |
|
||
| Agriculture / Food | 1 | $86B |
|
||
Price history
+192.7% since first listed17 events — show timeline
- 2026-05-22 Price Changed $161,000 MRED as Distributed by MLS Grid
- 2026-05-05 Listed $165,000 MRED as Distributed by MLS Grid
- 2026-02-17 Rental Removed $1,750 SHOWMOJO
- 2026-02-13 Listed for Rent $1,750 SHOWMOJO
- 2026-02-09 Rental Removed $1,650 SHOWMOJO
- 2026-01-31 Price Changed $1,650 SHOWMOJO
- 2026-01-28 Listed for Rent $1,600 SHOWMOJO
- 2015-04-30 Sold (MLS) $8,500 MRED as Distributed by MLS Grid
- 2015-04-28 Pending — MRED as Distributed by MLS Grid
- 2015-02-20 Listing Removed — MRED as Distributed by MLS Grid
- 2015-02-11 Listed $22,400 MRED as Distributed by MLS Grid
- 2015-02-10 Listing Removed — MRED as Distributed by MLS Grid
- 2015-01-30 Price Changed — MRED as Distributed by MLS Grid
- 2014-12-12 Relisted — MRED as Distributed by MLS Grid
- 2014-12-07 Listing Removed — MRED as Distributed by MLS Grid
- 2014-11-26 Listed — MRED as Distributed by MLS Grid
- 1991-05-28 Sold (Public Records) $55,000 Public Records
Property tax history
+2.6%/yrLatest (2023): $6,396 · +5.3% YoY. Source: county tax records.
Cash-flow waterfall
monthlySold comps — $/sqft
last 12 mo · ≤1 miLoading sold comps…