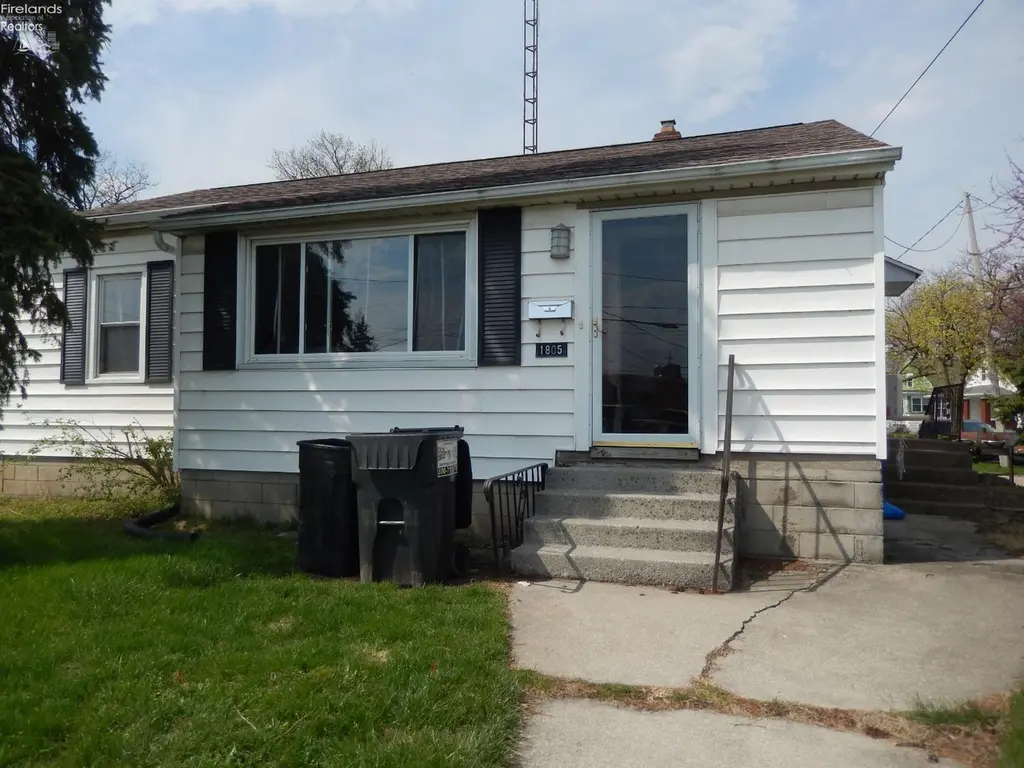
1805 Sycamore Line · Sandusky, OH
Flood risk 1/10 · Minimal
- FEMA flood zone
- X (unshaded)
- Chance of flooding over 30 yrs
- 0.0%
- Est. flood insurance / yr
- $473 – $860
Fire risk 1/10 · Minimal
- Est. fire insurance / yr
- $713 – $1,323
Heat risk 3/10 · Minor
- Hot days now (above 95°F)
- 7 days/yr
- Hot days in 30 yrs
- 16 days/yr
Wind risk 2/10 · Minimal
- Chance of severe wind over 30 yrs
- —
Air-quality risk 2/10 · Minimal
- Unhealthy air days now
- 1 days/yr
- Unhealthy air days in 30 yrs
- 2 days/yr
Risk factors via First Street. Map © Google.
Why this score? — see what drove the C+ grade
The composite is a weighted blend of 9 inputs, each scored 0–100. Each bar is that input's sub-score; the figure is the points it added to the 100-point composite (weight × sub-score).
- Cash flow +30.0/30.0
- DSCR +10.0/10.0
- 1% rule +8.5/10.0
- Livability +4.2/5.0
- Rent growth +2.5/5.0
- Schools +2.5/10.0
- Condition / age +2.5/5.0
- ARV discount +0.0/15.0
- Appreciation +0.0/10.0
$145,900
🖨 Deal sheet 📄 Offer letter ✓ Due diligence
Listing remarks MLS
Spacious Living with Bonus Basement Potential!Location: 1805 Sycamore Line, Sandusky, OH 44870Welcome to this charming single-family home on Sycamore Line, offering a fantastic blend of functional living space and future potential. This 1950s-built residence sits on a generous city lot and is ready for its next chapter. Interior HighlightsGenerous Living Space: Features a large living room perfect for gatherings or quiet evenings. Kitchen & Dining: The kitchen includes a dedicated eat-in area, creating a cozy hub for daily meals. Versatile Bedrooms: This home offers 3 traditional bedrooms, with the added benefit of a bonus fourth bedroom located in the basement, ideal for guests or a private office. Lower Level Potential: The basement provides a spacious family room for extra entertainment space and includes dedicated washer and dryer hookups. Exterior & AmenitiesDetached Garage: Keep your vehicle protected from Ohio winters in the detached garage. Spacious Lot: The lot provides plenty of room for outdoor activities, gardening, or a play area. Comfort Control: Equipped with central cooling and a gas heating system to keep you comfortable year-round.
Key facts
- 0.25 acre lot
- Garage
- Built 1950
Neighborhood map
What this means for you Summary
Snapshot
- This is a 3-bed/1.0-bath single-family listed at $146k.
Deal economics
- At list price, monthly cash flow is $639 ($8k/yr) — positive.
- The deal already cash-flows at list — no discount required.
- Meets the 1% rule at list price ($2k rent vs $146k).
- Recommended offer: $142k (3.0% below list) — sets the bar for market timing.
- Cap rate 11.6% vs local median 5.4% in Sandusky — top-decile yield for the area; either an underpriced asset or a hidden risk that comps aren't pricing in. Stress-test before assuming the spread holds.
Location & tenants
- Location reads 83/100 on livability (#63 in OH, #929 nationally) — a professional / high-income tenant draw. Strengths: commute A+, cost of living A+, housing A+; Watch: crime D-, employment F.
- Sandusky City (town): math 24% / reading 37% proficiency, ranked #583 of 656 in OH (top 89%) — families likely to look elsewhere, expect single-tenant / working-renter base with shorter leases; 71% free/reduced lunch — lower-income household profile, screen leases tightly.
- Market conditions: 209 active listings in the ZIP; 2 comparable units currently listed for rent nearby; 128 units permitted in Erie County in 2024 (5 in 5+ unit buildings).
- This rent runs 38% of the median local income ($62k/yr) — at the standard rent-burdened threshold; future hikes will face affordability resistance.
Forward outlook
- Local home prices are declining (-3.0%/yr); year-one equity from $1k of loan paydown is wiped out by about $4k of value loss. Plan a longer hold.
- Erie County population projected at -15% by 2050 — secular population decline; favor cash flow + early exit over multi-decade hold.
- At projected returns (-3.0% appreciation + 3.0% rent growth), your $41k cash investment doubles in ~7 years — after that, you're playing with house money.
Negotiation context
- It's been on market 60 days — a 3% lower offer ($142k) is reasonable based on typical stale-listing flexibility.
- Current owner paid $64k; list at $146k implies a 130% gain — meaningful room to come down on a strong offer.
Risks & watch-outs
- Watch-outs: built in 1950 — expect roof / HVAC / electrical / plumbing capex.
Questions for the listing agent
- It's been on market 60 days. Have you received any prior offers? Is the seller open to a 3% concession, seller financing, or rate buy-down credit?
- Built in 1950 — when were the roof, HVAC, electrical panel, plumbing, and water heater last replaced?
- Is there a deadline driving the sale (1031 exchange, divorce, estate, relocation)? That informs how much negotiation room exists.
- Crime grade is D in this area — have there been break-ins, vandalism, or insurance claims at this property in the last 3 years? What carrier currently insures it and at what premium?
- What's the average days-on-market for RENTAL listings here right now (not sales)? A rising rental-DOM trend means longer vacancies and softer asking-rent achievability than the comps imply.
- What's the recent tenant-quality profile in this submarket — average credit score on applications, eviction rate, late-payment / NSF rate, and stable-employment percentage? A property-management company in the area should have these aggregated.
- How much new for-sale + rental construction is in the pipeline within 1–3 miles? Heavy new supply typically softens prices + rents 12–24 months out; constrained supply supports both.
Investment metrics
- 1% rule
- 1.35% ✓
- Cap rate
- 11.55%
- Cash-on-cash
- 18.78%
- DSCR
- 1.84
- GRM
- 6.2
CMA / ARV
- ARV (median comp)
- $116,603
- List price
- $145,900
- Delta
- 25.13%
- Verdict
- OVERPRICED
- Comps
- 20 within 1.0 mi
Show comp detail 12 sales within ~0.75 mi
| Address | Dist | Beds/Ba | Sqft | Sold | Price | $/sf | Match |
|---|---|---|---|---|---|---|---|
| 1119 E Parish St | 0.27mi | 3/1.0 | 1,000 (+1%) | 6mo | $62,000 | $62 | 81 |
| 421 Scott St | 0.56mi | 3/1.0 | 1,012 (+2%) | 2mo | $119,900 | $118 | 68 |
| 1809 Knupke Rd | 0.69mi | 3/1.0 | 1,000 (+1%) | 2mo | $162,000 | $162 | 64 |
| 1810 Knupke St | 0.69mi | 3/1.0 | 960 (-3%) | 1mo | $147,000 | $153 | 62 |
| 1304 E Parish St | 0.37mi | 3/1.0 | 1,116 (+13%) | 1mo | $95,000 | $85 | 60 |
| 1474 Dixon Dr | 0.71mi | 3/1.0 | 975 (-1%) | 6mo | $130,000 | $133 | 59 |
| 1014 Fourth St St | 0.63mi | 3/1.0 | 924 (-6%) | 2mo | $120,000 | $130 | 58 |
| 1648 Oakmont Lane Ln | 0.70mi | 3/1.0 | 925 (-6%) | 1mo | $150,000 | $162 | 55 |
| 1123 Huntington Ave | 0.33mi | 2/1.0 (-1) | 870 (-12%) | 6mo | $113,300 | $130 | 55 |
| 1115 Fifth St | 0.60mi | 3/1.5 | 1,089 (+10%) | 5mo | $174,700 | $160 | 49 |
| 206 Townsend St | 0.70mi | 2/1.0 (-1) | 1,049 (+6%) | 6mo | $148,000 | $141 | 48 |
| 306 Tyler St | 0.58mi | 3/1.0 | 1,136 (+15%) | 3mo | $130,000 | $114 | 46 |
Match score weights: distance 35% · size 25% · config 20% · recency 20%. Top-matched comps best support the ARV.
Projected returns pro-forma
-3.0% appreciation · 3.0% rent growth · sell at horizon
- IRR
- 10.6%
- Equity multiple
- 1.42×
- Total profit
- $17,055
- Equity at exit
- $21,754
- IRR
- 19.6%
- Equity multiple
- 2.64×
- Total profit
- $67,188
- Equity at exit
- $12,615
Cash invested: $40,852 (down + closing). Projections, not guarantees.
Landlord ↔ Tenant lean methodology
- Overall (STATE)
- 73 Landlord-Friendly
- State Ohio
- 73 Landlord-Friendly · R+6
- County
- — inherits STATE
- City
- — inherits STATE
ZIP-level market 44870
- Active inventory
- 209
- Price-to-rent
- 6.2×
Monthly cashflow live
- Estimated rent
- $1,974 medium interval (Pro) →
- Mortgage (P&I)
- −$765
- Tax from tax record
- −$94 /mo · $1,127/yr
- Insurance
- −$61
- HOA
- −$0
- Vacancy / Maint / Mgmt
- −$414
- Net cashflow
- $639
Break-even live
UW: 25.0% down · 7.5% · 30yr · 1.5% tax · 5.0% vac · 8.0% maint · 8.0% mgmt
Financing live
Cash to close
- Down payment
- $36,475
- Closing costs
- $4,377
- Reserves months
- —
- Total cash needed
- —
Loan-product check · same deal, 3 products live
Conventional
25% down · 7.5% · 30yr
- Down + closing
- —
- Monthly P&I
- —
- Monthly cashflow
- —
- DSCR
- —
- Eligible?
- —
Personal DTI + credit; lowest rate.
DSCR
20% down · 8.5% · 30yr
- Down + closing
- —
- Monthly P&I
- —
- Monthly cashflow
- —
- DSCR
- —
- Eligible?
- —
No personal income docs; deal must DSCR.
Hard money
10% down · 12.0% · 12mo
- Down + closing
- —
- Monthly P&I
- —
- Monthly cashflow
- —
- DSCR
- —
- Eligible?
- —
Short-term bridge; refi at stabilization.
Rent comps 2 comps
| Address | Beds | Baths | Sqft | Rent | $/sqft | DOM | Units | Dist |
|---|---|---|---|---|---|---|---|---|
| 156 E Market St Sandusky, OH | 1.0–2.0 | 1.0–2.5 | 1266 | $3,539 | $2.79 | 43d | 5 | 1.27mi |
| 1515 W Perkins Ave Sandusky, OH | 2.0 | 1.0 | 925 | $925 | $1.00 | 43d | 1 | 1.38mi |
Listing history 17 events
-
2026-06-19days on market $145,900 Active 60 DOM
-
2026-06-18days on market $145,900 Active 59 DOM
-
2026-06-17days on market $145,900 Active 58 DOM
-
2026-06-16days on market $145,900 Active 57 DOM
-
2026-06-15days on market $145,900 Active 56 DOM
-
2026-06-14days on market $145,900 Active 54 DOM
-
2026-06-12days on market $145,900 Active 53 DOM
-
2026-06-09days on market $145,900 Active 50 DOM
-
2026-06-08days on market $145,900 Active 49 DOM
-
2026-06-07days on market $145,900 Active 48 DOM
-
2026-06-03days on market $145,900 Active 44 DOM
-
2026-06-02days on market $145,900 Active 43 DOM
-
2026-06-01days on market $145,900 Active 42 DOM
-
2026-05-31days on market $145,900 Active 41 DOM
-
2026-05-30days on market $145,900 Active 40 DOM
-
2026-04-17$145,900 Active 1179-char remark
Show marketing remark (1179 chars)
Spacious Living with Bonus Basement Potential!Location: 1805 Sycamore Line, Sandusky, OH 44870Welcome to this charming single-family home on Sycamore Line, offering a fantastic blend of functional living space and future potential. This 1950s-built residence sits on a generous city lot and is ready for its next chapter. Interior HighlightsGenerous Living Space: Features a large living room perfect for gatherings or quiet evenings. Kitchen & Dining: The kitchen includes a dedicated eat-in area, creating a cozy hub for daily meals. Versatile Bedrooms: This home offers 3 traditional bedrooms, with the added benefit of a bonus fourth bedroom located in the basement, ideal for guests or a private office. Lower Level Potential: The basement provides a spacious family room for extra entertainment space and includes dedicated washer and dryer hookups. Exterior & AmenitiesDetached Garage: Keep your vehicle protected from Ohio winters in the detached garage. Spacious Lot: The lot provides plenty of room for outdoor activities, gardening, or a play area. Comfort Control: Equipped with central cooling and a gas heating system to keep you comfortable year-round.
-
1998-06-24soldstatus $63,500
ⓘ Source: listings_history table (triggers on properties + properties_extension) + one-shot
backfill from property_details.listing_events for pre-trigger history.
Tax reassessment forecast OH · Partial reset (capped growth)
- Current annual tax
- $1,127 · $94/mo
- Projected year-2 tax
- $1,702 · $142/mo
- Expected delta
- +$574/yr (+$48/mo · 50.9%)
ⓘ Screening estimate from a state-policy table — verify with the county assessor before closing.
Climate risk First Street
- Flood 1/10 Low FEMA zone X (unshaded) · 0% chance over 30 yrs
- Wildfire 1/10 Low
- Heat 3/10 Moderate 7 d/yr ≥95°F today · 16 d/yr by 30 yrs out
- Wind 2/10 Low
- Air quality 2/10 Low 1 unhealthy d/yr today · 2 by 30 yrs out
Nearby sold comps map
Loading sold comps map…
Walkable amenities ~0.75 mi
Loading nearby amenities…
Taxation est. · year 1
- Rental income
- $23,685
- − Mortgage interest
- −$8,173
- − Property taxes
- −$1,127
- − Insurance
- −$730
- − Repairs & maintenance
- −$1,895
- − Management
- −$1,895
- − Depreciation
- −$4,244
- Taxable income
- $5,621
- Est. tax owed @ 24.0%
- −$1,349
- After-tax cash flow
- $6,323/yr
For passive investors: Depreciation is non-cash, so a rental often shows a tax loss while cash-flowing — sheltering income. Rental losses are passive: they offset passive income freely, and up to $25,000/yr can offset ordinary (W-2) income if you actively participate and your MAGI is under $100k (phasing out to $0 by $150k); unused losses carry forward. On sale, claimed depreciation is recaptured at up to 25%, and gains may owe capital-gains tax (a 1031 exchange can defer both). Figures are a year-1 estimate at your 24.0% rate — not tax advice; consult a CPA.
Schools (NCES district)
- District
- Sandusky City
- NCES district ID
- 3904474
- Math proficiency
- 24% ▼ -17.00%
- Reading proficiency
- 37% ▼ -9.00%
- Median HH income
- $34,583
- Composite
- 25.1/100
- National rank
- #7532
- State rank
- #583 of 656 in OH
Livability — Sandusky
- Score
- 83/100
- State rank
- #63
- US rank
- #929
Category grades
Schools grade is shown separately in the Schools card above.
Census & demographics
- Census place
- Sandusky, OH
- County
- Erie County · 39,883 people
- City population
- 39,883
- Metro
- Sandusky, OH
- Population (ZIP)
- 39,883
- Household income
- $62,082
- Rent vs Own
- Severe rent burden
- 1602.0
Population outlook (Erie County) Hauer SSP2
- Today (2025)
- 73,204 people
- By 2030
- 71,341 · -2.5%
- By 2040
- 66,771 · -8.8%
- By 2050
- 62,512 · -14.6%
- By 2075
- 56,154 · -23.3%
- By 2100
- 49,045 · -33.0%
Race, ethnicity, and origin ACS 2023
- Neighborhood character
- Predominantly White (72%)
- Race & ethnicity
- White 72% Black 15% Two or more races 8% Hispanic / Latino 5%
- Common ancestry
- Romanian 3% Slovak 2% Subsaharan African 1%
- Foreign-born
- 1% · Canada
- Languages at home
- 96% English-only · Spanish 2%
Political lean MEDSL · Erie
- 2024 margin
- R (+14.1) · D 42.5% · R 56.6%
- 2008→2024 swing
- -28.0pp toward R · 2008: 13.9pp · 2024: -14.1pp
- All cycles
- 2024: R+14.1 2020: R+11.6 2016: R+9.8 2012: D+11.3 2008: D+13.9
Not yet ingested
- Civics
- —
Market trends
- HPI YoY
- ▼ -151.99%
- Current HPI
- 209.6383
- Rent YoY
- —
- Metro
- Sandusky, OH
- State GDP YoY
- ▲ 1.98%
- F500 in state
- 48
Industry mix (Fortune 500 HQ in OH)
| Industry | F500 HQs | Revenue |
|---|---|---|
| Insurance | 3 | $145B |
|
||
| Industrial Machinery | 3 | $49B |
|
||
| Financial Services | 3 | $24B |
|
||
| Consumer Goods | 2 | $93B |
|
||
| Aerospace / Defense | 2 | $47B |
|
||
| Utilities | 2 | $33B |
|
||
Price history
+129.8% since first listed2 events — show timeline
- 2026-04-17 Listed $145,900 FAOR
- 1998-06-24 Sold (Public Records) $63,500 Public Records
Property tax history
-0.1%/yrLatest (2025): $1,127 · -1.0% YoY. Source: county tax records.
Cash-flow waterfall
monthlySold comps — $/sqft
last 12 mo · ≤1 miLoading sold comps…