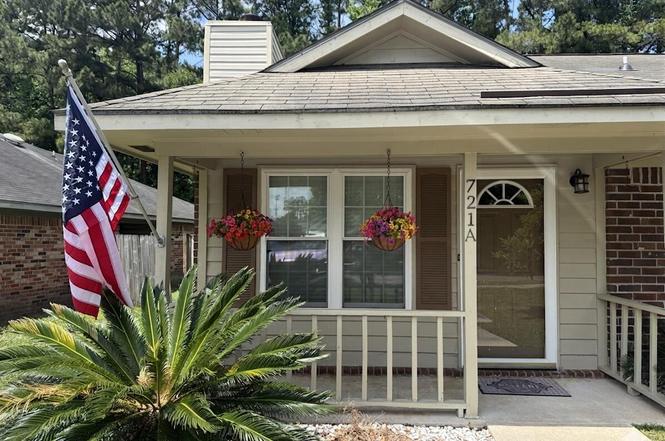
721 Temple Rd Unit A · Ladson, SC
Flood risk 1/10 · Minimal
- FEMA flood zone
- X (unshaded)
- Chance of flooding over 30 yrs
- 0.0%
- Est. flood insurance / yr
- $507 – $1,088
Fire risk 4/10 · Minor
- Est. fire insurance / yr
- $783 – $1,453
Heat risk 9/10 · Severe
- Hot days now (above 110°F)
- 7 days/yr
- Hot days in 30 yrs
- 17 days/yr
Wind risk 8/10 · Major
- Chance of severe wind over 30 yrs
- 97.0%
Air-quality risk 2/10 · Minimal
- Unhealthy air days now
- 2 days/yr
- Unhealthy air days in 30 yrs
- 2 days/yr
Risk factors via First Street. Map © Google.
Why this score? — see what drove the C grade
The composite is a weighted blend of 9 inputs, each scored 0–100. Each bar is that input's sub-score; the figure is the points it added to the 100-point composite (weight × sub-score).
- Cash flow +24.6/30.0
- DSCR +7.9/10.0
- ARV discount +7.5/15.0
- 1% rule +5.9/10.0
- Schools +3.6/10.0
- Rent growth +3.4/5.0
- Livability +3.2/5.0
- Condition / age +2.5/5.0
- Appreciation +0.0/10.0
$217,500
🖨 Deal sheet (PDF) 📄 Offer letter ✓ Due diligence
Listing remarks
$2500 Flex money is being offered from the Seller to the Buyer to be used towards their Closing Costs! 721A Temple Road is a turn-key brick duplex home which includes a refrigerator, washer, and dryer, making it move-in ready for new owners. The seller is offering to purchase a Home Warranty for the new owner for a little extra piece of mind. This property is conveniently situated approximately three miles from I-26, providing easy access to major routes. It is located 3.5 miles from the new Carnes Crossroad Publix Shopping Center and the Berkeley Roper Hospital. Additionally, the Nexton Shopping District is just five miles away. The area is thriving and rapidly growing, offering future pot
Key facts
- Brick duplex
- Shed included
- Private fenced yard
Tags
Property features AI
Finance
- HOA & community: HOA fee collected monthly; Community amenities: dog park, fitness center, pool
Exterior
- Parking: Off-street parking; No carport spaces
- Utilities: Public sewer; Berkeley Electric Co-Op service; Charleston Water Service
- Home design: Single-family attached residence (Condominium/Duplex); One story; Ground-level entry
- Construction: Condominium/duplex construction
- Exterior features: Privacy wood fencing (wooden enclosed fence); Asphalt roof; Shed(s) on property
Interior
- Kitchen: Built-in electric oven; Dishwasher; Disposal; Microwave; Refrigerator; Pantry / eat-in space
- Bedrooms: 2 bedrooms; Primary bedroom on lower level with ceiling fan
- Flooring: Luxury vinyl; Vinyl
- Bathrooms: 2 bathrooms
- Heating & cooling: Central heating; Electric forced-air heating; Central air conditioning
- Interior features: Blown ceiling insulation; Tray ceilings; Ceiling fans; Eat-in kitchen; Family room; Pantry; Wood-burning fireplace in the family room
- Laundry & utility: Washer and dryer included (washer hookup, electric dryer hookup); Laundry room
Neighborhood map
What this means for you Summary
Snapshot
- This is a 6-bed/4.0-bath single-family listed at $218k.
Deal economics
- At list price, monthly cash flow is $449 ($5k/yr) — positive.
- The deal already cash-flows at list — no discount required.
- Meets the 1% rule at list price ($2k rent vs $218k).
- Recommended offer: $191k (12.0% below list) — sets the bar for market timing.
- Cap rate 8.8% vs local median 4.9% in Ladson — top-decile yield for the area; either an underpriced asset or a hidden risk that comps aren't pricing in. Stress-test before assuming the spread holds.
Location & tenants
- Location reads 64/100 on livability (#155 in SC) — a middle-class / working-renter tenant base. Strengths: cost of living A+, housing A+; Watch: amenities F, commute F, health & safety F.
- Berkeley 01 (suburban): math 35% / reading 48% proficiency, ranked #30 of 80 in SC (top 38%) — families likely to look elsewhere, expect single-tenant / working-renter base with shorter leases.
- Zoned schools: College Park Elementary (math 16% / reading 25%, grade F, #490 of 597 statewide, top 82%, 833 students, 100% FRL); College Park Middle (math 14% / reading 28%, grade F, #177 of 229 statewide, top 78%, 714 students, 100% FRL); Stratford High (math 49% / reading 79%, grade B-, #92 of 196 statewide, top 48%, 2,653 students, 42% FRL) — zoned schools average 81% FRL vs 48% district-wide (32 pts higher); higher-poverty schools than district average — tighter screening recommended.
- Market conditions: Rents rising (+3.6%/yr); 178 active listings in the ZIP; solid renter incomes; 3,183 units permitted in Berkeley County in 2024 (580 in 5+ unit buildings).
- This rent runs 36% of the median local income ($78k/yr) — at the standard rent-burdened threshold; future hikes will face affordability resistance.
Forward outlook
- Local home prices are declining (-3.0%/yr); year-one equity from $2k of loan paydown is wiped out by about $7k of value loss. Plan a longer hold.
- Berkeley County population projected at +48% by 2050 — long-run rental-demand tailwind backs the buy-and-hold thesis.
Negotiation context
- It's been on market 156 days — a 12% lower offer ($191k) is reasonable based on typical stale-listing flexibility.
Risks & watch-outs
- Climate carrying-cost: severe wind risk, 97% chance of damaging wind over 30y; extreme-heat days projected 7→17/yr by 2055 (HVAC capex compounding) — expect insurance premiums to compound above CPI over the hold.
Questions for the listing agent
- It's been on market 156 days. Have you received any prior offers? Is the seller open to a 12% concession, seller financing, or rate buy-down credit?
- What does the HOA fee cover, when was the last increase, and are there any pending special assessments or reserve-fund shortfalls?
- Why hasn't it sold? Are there any deal-killer items the seller is aware of (foundation, flood, title, zoning, code violations)?
- Is there a deadline driving the sale (1031 exchange, divorce, estate, relocation)? That informs how much negotiation room exists.
- Schools are F-rated, which usually means shorter tenancies and higher turnover. Who's the typical renter profile here, and what's been the actual vacancy rate?
- What's the average days-on-market for RENTAL listings here right now (not sales)? A rising rental-DOM trend means longer vacancies and softer asking-rent achievability than the comps imply.
- What's the recent tenant-quality profile in this submarket — average credit score on applications, eviction rate, late-payment / NSF rate, and stable-employment percentage? A property-management company in the area should have these aggregated.
- How much new for-sale + rental construction is in the pipeline within 1–3 miles? Heavy new supply typically softens prices + rents 12–24 months out; constrained supply supports both.
Investment metrics
- 1% rule
- 1.09% ✓
- Cap rate
- 8.77%
- Cash-on-cash
- 8.84%
- DSCR
- 1.39
- GRM
- 7.6
CMA / ARV
No comps found within radius.
Projected returns pro-forma
-3.0% appreciation · 3.62% rent growth · sell at horizon
- IRR
- -2.2%
- Equity multiple
- 0.92×
- Total profit
- $-5,175
- Equity at exit
- $32,430
- IRR
- 8.1%
- Equity multiple
- 1.63×
- Total profit
- $38,469
- Equity at exit
- $18,805
Cash invested: $60,900 (down + closing). Projections, not guarantees.
Landlord ↔ Tenant lean methodology
- Overall (STATE)
- 90 Strongly Landlord-Friendly
- State South Carolina
- 90 Strongly Landlord-Friendly · R+6
- County
- — inherits STATE
- City
- — inherits STATE
ZIP-level market 29456
- Home prices YoY
- -15.1%
- Rents YoY
- 3.6%
- Active inventory
- 178
- Price-to-rent
- 7.6×
Monthly cashflow live
- Estimated rent
- $2,379 medium interval (Pro) →
- Mortgage (P&I)
- −$1,141
- Tax from tax record
- −$39 /mo · $470/yr
- Insurance
- −$91
- HOA
- −$160
- Vacancy / Maint / Mgmt
- −$500
- Net cashflow
- $449
Break-even live
Sensitivity live
| Price | -10% $572 | -5% $510 | +0% $449 | +5% $387 | +10% $66 |
|---|---|---|---|---|---|
| Rent | -10% $261 | -5% $355 | +0% $449 | +5% $543 | +10% $637 |
| Rate | -1.0pp $558 | -0.5pp $504 | base $449 | +0.5pp $392 | +1.0pp $335 |
UW: 25.0% down · 7.5% · 30yr · 1.5% tax · 5.0% vac · 8.0% maint · 8.0% mgmt
Financing live
Cash to close
- Down payment
- $54,375
- Closing costs
- $6,525
- Reserves months
- —
- Total cash needed
- —
Loan-product check · same deal, 3 products live
Conventional
25% down · 7.5% · 30yr
- Down + closing
- —
- Monthly P&I
- —
- Monthly cashflow
- —
- DSCR
- —
- Eligible?
- —
Personal DTI + credit; lowest rate.
DSCR
20% down · 8.5% · 30yr
- Down + closing
- —
- Monthly P&I
- —
- Monthly cashflow
- —
- DSCR
- —
- Eligible?
- —
No personal income docs; deal must DSCR.
Hard money
10% down · 12.0% · 12mo
- Down + closing
- —
- Monthly P&I
- —
- Monthly cashflow
- —
- DSCR
- —
- Eligible?
- —
Short-term bridge; refi at stabilization.
HOA detail
- Monthly dues
- $160 · $1,920/yr
Listing history 22 events
-
2026-06-21days on market $217,500 Active 156 DOM
-
2026-06-18days on market $217,500 Active 153 DOM
-
2026-06-17days on market $217,500 Active 152 DOM
-
2026-06-16days on market $217,500 Active 151 DOM
-
2026-06-15price $217,500 Active 150 DOM
-
2026-06-15days on market $219,900 Active 150 DOM
-
2026-06-13days on market $219,900 Active 148 DOM
-
2026-06-13days on market $219,900 Active 147 DOM
-
2026-06-10days on market $219,900 Active 145 DOM
-
2026-06-09days on market $219,900 Active 144 DOM
-
2026-06-08days on market $219,900 Active 143 DOM
-
2026-06-07days on market $219,900 Active 142 DOM
-
2026-06-05days on market $219,900 Active 139 DOM
-
2026-06-03days on market $219,900 Active 138 DOM
-
2026-06-03days on market $219,900 Active 137 DOM
-
2026-06-01days on market $219,900 Active 136 DOM
-
2026-05-31days on market $219,900 Active 135 DOM
-
2026-05-13price $219,900
-
2026-04-27price $220,000
-
2026-03-31price $223,900
-
2026-01-16$225,000 Active
-
2006-09-15soldstatus $12,320,659
ⓘ Source: listings_history table (triggers on properties + properties_extension) + one-shot
backfill from property_details.listing_events for pre-trigger history.
Tax reassessment forecast SC · Resets to sale price
- Current annual tax
- $470 · $39/mo
- Projected year-2 tax
- $1,240 · $103/mo
- Expected delta
- +$770/yr (+$64/mo · 164.0%)
ⓘ Screening estimate from a state-policy table — verify with the county assessor before closing.
Climate risk First Street
- Flood 1/10 Low FEMA zone X (unshaded) · 0% chance over 30 yrs
- Wildfire 4/10 Moderate
- Heat 9/10 Extreme 7 d/yr ≥110°F today · 17 d/yr by 30 yrs out
- Wind 8/10 Severe 97% chance of damaging wind over 30 yrs
- Air quality 2/10 Low 2 unhealthy d/yr today · 2 by 30 yrs out
Nearby sold comps map
Loading sold comps map…
Walkable amenities ~0.75 mi
Loading nearby amenities…
Taxation est. · year 1
- Rental income
- $28,544
- − Mortgage interest
- −$12,183
- − Property taxes
- −$470
- − Insurance
- −$1,088
- − Repairs & maintenance
- −$2,284
- − Management
- −$2,284
- − HOA
- −$1,920
- − Depreciation
- −$6,327
- Taxable income
- $1,989
- Est. tax owed @ 24.0%
- −$477
- After-tax cash flow
- $4,908/yr
For passive investors: Depreciation is non-cash, so a rental often shows a tax loss while cash-flowing — sheltering income. Rental losses are passive: they offset passive income freely, and up to $25,000/yr can offset ordinary (W-2) income if you actively participate and your MAGI is under $100k (phasing out to $0 by $150k); unused losses carry forward. On sale, claimed depreciation is recaptured at up to 25%, and gains may owe capital-gains tax (a 1031 exchange can defer both). Figures are a year-1 estimate at your 24.0% rate — not tax advice; consult a CPA.
Schools (NCES district)
- District
- Berkeley 01
- NCES district ID
- 4501170
- Math proficiency
- 35% ▼ -8.00%
- Reading proficiency
- 48% ▼ -2.00%
- Median HH income
- $52,724
- Composite
- 35.95/100
- National rank
- #4799
- State rank
- #30 of 80 in SC
Livability — Ladson
- Score
- 64/100
- State rank
- #155
- US rank
- #14552
Category grades
Schools grade is shown separately in the Schools card above.
Census & demographics
- Census place
- Ladson, SC
- County
- Dorchester County · 182,866 people
- City population
- 41,214
- Metro
- Charleston-North Charleston, SC
- Population (ZIP)
- 41,214
- Household income
- $78,361
- Rent vs Own
- Severe rent burden
- 1384.0
Population outlook (Berkeley County) Hauer SSP2
- Today (2025)
- 254,184 people
- By 2030
- 279,677 · +10.0%
- By 2040
- 329,379 · +29.6%
- By 2050
- 375,557 · +47.8%
- By 2075
- 476,740 · +87.6%
- By 2100
- 535,945 · +110.8%
Race, ethnicity, and origin ACS 2023
- Neighborhood character
- Diverse neighborhood (Simpson 0.67)
- Race & ethnicity
- White 47% Black 29% Hispanic / Latino 14% Two or more races 10% Asian 4%
- Hispanic origin (detail)
- Mexican 8% Puerto Rican 1%
- Common ancestry
- Romanian 2% Slovak 2% Lithuanian 2%
- Foreign-born
- 11% · Canada
- Languages at home
- 82% English-only · Spanish 10% Other Indo-European 3% Tagalog/Filipino 1%
Political lean MEDSL · Berkeley
- 2024 margin
- R (+16.3) · D 41.1% · R 57.4% · Other 1.4%
- 2008→2024 swing
- -3.2pp toward R · 2008: -13.1pp · 2024: -16.3pp
- All cycles
- 2024: R+16.3 2020: R+11.7 2016: R+17.4 2012: R+18.9 2008: R+13.1
Not yet ingested
- Civics
- —
Market trends
- HPI YoY
- ▼ -55.17%
- Current HPI
- 310.9027
- Rent YoY
- ▲ 3.62%
- Metro
- Charleston-North Charleston, SC
- State GDP YoY
- ▲ 4.51%
- F500 in state
- 2
Industry mix (Fortune 500 HQ in SC)
| Industry | F500 HQs | Revenue |
|---|---|---|
| Packaging | 1 | $7B |
|
||
Price history
-98.2% since first listed5 events — show timeline
- 2026-05-13 Price Changed $219,900 Charleston Trident MLS
- 2026-04-27 Price Changed $220,000 Charleston Trident MLS
- 2026-03-31 Price Changed $223,900 Charleston Trident MLS
- 2026-01-16 Listed $225,000 Charleston Trident MLS
- 2006-09-15 Sold (Public Records) $12,320,659 Public Records
Property tax history
+1.6%/yrLatest (2025): $470 · +7.1% YoY. Source: county tax records.
Cash-flow waterfall
monthlySold comps — $/sqft
last 12 mo · ≤1 miLoading sold comps…