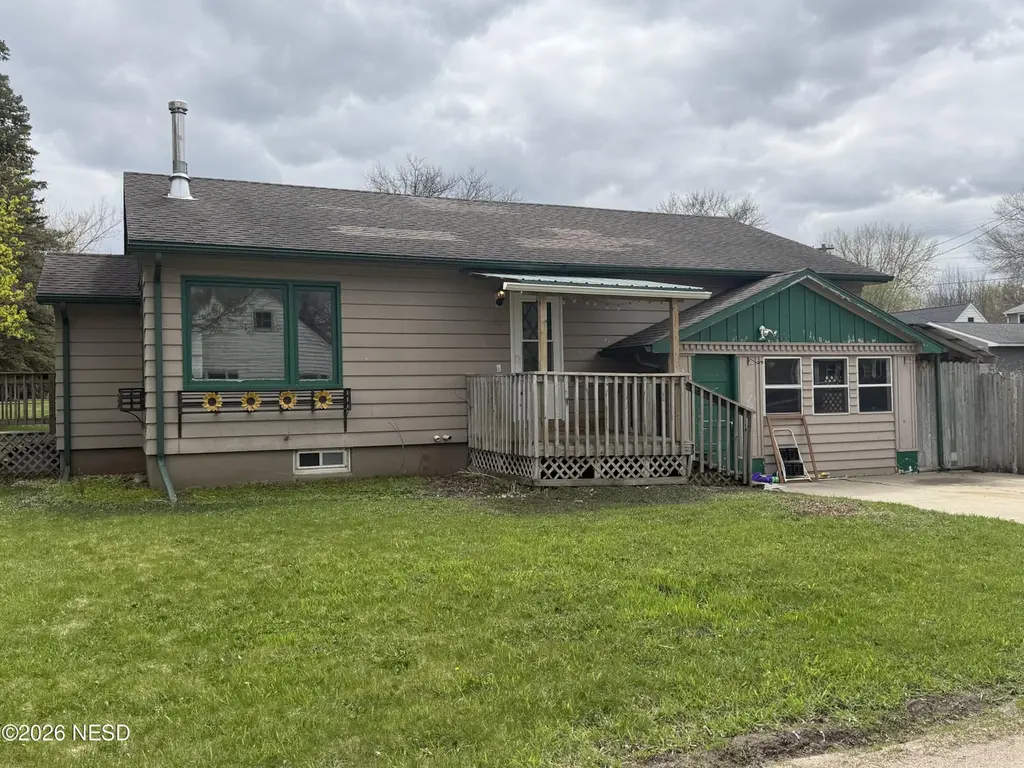
802 S 3rd St · Milbank, SD
Flood risk 1/10 · Minimal
- FEMA flood zone
- X (unshaded)
- Chance of flooding over 30 yrs
- 0.0%
- Est. flood insurance / yr
- $473 – $860
Fire risk 1/10 · Minimal
- Est. fire insurance / yr
- $1,342 – $2,492
Heat risk 2/10 · Minimal
- Hot days now (above 100°F)
- 7 days/yr
- Hot days in 30 yrs
- 13 days/yr
Wind risk 2/10 · Minimal
- Chance of severe wind over 30 yrs
- —
Air-quality risk 2/10 · Minimal
- Unhealthy air days now
- 1 days/yr
- Unhealthy air days in 30 yrs
- 1 days/yr
Risk factors via First Street. Map © Google.
Why this score? — see what drove the C- grade
The composite is a weighted blend of 9 inputs, each scored 0–100. Each bar is that input's sub-score; the figure is the points it added to the 100-point composite (weight × sub-score).
- Cash flow +18.1/30.0
- ARV discount +12.1/15.0
- DSCR +5.7/10.0
- 1% rule +4.9/10.0
- Schools +4.6/10.0
- Livability +3.9/5.0
- Rent growth +2.5/5.0
- Condition / age +2.5/5.0
- Appreciation +0.0/10.0
$125,000
🖨 Deal sheet 📄 Offer letter ✓ Due diligence
Key facts
- 6,969 sq ft lot
- Built 1958
Neighborhood map
What this means for you Summary
Snapshot
- This is a 3-bed/2.0-bath single-family listed at $125k.
Deal economics
- At list price, monthly cash flow is $109 ($1k/yr) — positive.
- The deal already cash-flows at list — no discount required.
- To meet the 1% rule (rent ≥ 1% of price), the offer needs to be $123k (1.4% below list).
- Recommended offer: $123k (1.4% below list) — sets the bar for 1% rule.
Location & tenants
- Location reads 77/100 on livability (#19 in SD, #3,182 nationally) — a middle-class / working-renter tenant base. Strengths: cost of living A+, housing A+, health & safety A+; Watch: amenities F, commute F.
- Milbank School District 25-4 (town): math 46% / reading 61% proficiency, ranked #19 of 59 in SD (top 32%) — acceptable for families but not a draw, mixed tenant base, ~2y average lease.
- Market conditions: 37 active listings in the ZIP; 22 units permitted in Grant County in 2024 (0 in 5+ unit buildings).
Forward outlook
- Local home prices are declining (-3.0%/yr); year-one equity from $864 of loan paydown is wiped out by about $4k of value loss. Plan a longer hold.
- Grant County population projected at -16% by 2050 — secular population decline; favor cash flow + early exit over multi-decade hold.
Negotiation context
- Only 0 days on market — expect competitive offers; lowballing is unlikely to land.
Risks & watch-outs
- Watch-outs: built in 1958 — expect roof / HVAC / electrical / plumbing capex.
Questions for the listing agent
- Built in 1958 — when were the roof, HVAC, electrical panel, plumbing, and water heater last replaced?
- Is there a deadline driving the sale (1031 exchange, divorce, estate, relocation)? That informs how much negotiation room exists.
- What's the average days-on-market for RENTAL listings here right now (not sales)? A rising rental-DOM trend means longer vacancies and softer asking-rent achievability than the comps imply.
- What's the recent tenant-quality profile in this submarket — average credit score on applications, eviction rate, late-payment / NSF rate, and stable-employment percentage? A property-management company in the area should have these aggregated.
- How much new for-sale + rental construction is in the pipeline within 1–3 miles? Heavy new supply typically softens prices + rents 12–24 months out; constrained supply supports both.
Investment metrics
- 1% rule
- 0.99% ✗
- Cap rate
- 7.34%
- Cash-on-cash
- 3.75%
- DSCR
- 1.17
- GRM
- 8.5
CMA / ARV
- ARV (on-the-fly)
- $139,216
- Comps found
- 12
Show comp detail 12 sales within ~0.75 mi
| Address | Dist | Beds/Ba | Sqft | Sold | Price | $/sf | Match |
|---|---|---|---|---|---|---|---|
| 410 S 3rd St | 0.28mi | 3/2.0 | 1,842 (+2%) | 0mo | $100,000 | $54 | 84 |
| 603 S 5th St | 0.21mi | 3/2.0 | 1,904 (+5%) | 1mo | $130,000 | $68 | 81 |
| 521 S 4th St | 0.18mi | 2/1.0 (-1) | 1,688 (-7%) | 2mo | $103,500 | $61 | 70 |
| 808 S 7th St | 0.24mi | 2/1.0 (-1) | 1,700 (-6%) | 0mo | $145,000 | $85 | 70 |
| 801 S 5th St | 0.17mi | 3/1.0 | 1,920 (+6%) | 10mo | $72,500 | $38 | 69 |
| 912 S Main St | 0.14mi | 2/1.0 (-1) | 1,976 (+9%) | 1mo | $108,500 | $55 | 68 |
| 517 S 2nd St | 0.20mi | 2/1.0 (-1) | 1,608 (-11%) | 2mo | $143,500 | $89 | 62 |
| 305 W 6th Ave | 0.47mi | 3/2.0 | 1,920 (+6%) | 10mo | $90,500 | $47 | 59 |
| 1108 Vista Dr | 0.32mi | 2/1.0 (-1) | 1,632 (-10%) | 2mo | $150,000 | $92 | 58 |
| 811 Summit St | 0.41mi | 4/1.0 (+1) | 1,585 (-12%) | 1mo | $152,000 | $96 | 50 |
| 218 W 5th Ave | 0.43mi | 4/1.0 (+1) | 2,043 (+13%) | 2mo | $157,000 | $77 | 48 |
| 312 N 1st St | 0.72mi | 4/2.0 (+1) | 1,984 (+10%) | 10mo | $235,000 | $118 | 37 |
Match score weights: distance 35% · size 25% · config 20% · recency 20%. Top-matched comps best support the ARV.
Projected returns pro-forma
-3.0% appreciation · 3.0% rent growth · sell at horizon
- IRR
- -10.4%
- Equity multiple
- 0.62×
- Total profit
- $-13,263
- Equity at exit
- $18,638
- IRR
- -1.0%
- Equity multiple
- 0.93×
- Total profit
- $-2,495
- Equity at exit
- $10,808
Cash invested: $35,000 (down + closing). Projections, not guarantees.
Landlord ↔ Tenant lean methodology
- Overall (STATE)
- 83 Strongly Landlord-Friendly
- State South Dakota
- 83 Strongly Landlord-Friendly · R+16
- County
- — inherits STATE
- City
- — inherits STATE
ZIP-level market 57252
- Active inventory
- 37
- Price-to-rent
- 8.5×
Monthly cashflow live
- Estimated rent
- $1,232 medium interval (Pro) →
- Mortgage (P&I)
- −$656
- Tax est. 1.5%
- −$156 /mo · $1,875/yr
- Insurance
- −$52
- HOA
- −$0
- Vacancy / Maint / Mgmt
- −$259
- Net cashflow
- $109
Break-even live
UW: 25.0% down · 7.5% · 30yr · 1.5% tax · 5.0% vac · 8.0% maint · 8.0% mgmt
Financing live
Cash to close
- Down payment
- $31,250
- Closing costs
- $3,750
- Reserves months
- —
- Total cash needed
- —
Loan-product check · same deal, 3 products live
Conventional
25% down · 7.5% · 30yr
- Down + closing
- —
- Monthly P&I
- —
- Monthly cashflow
- —
- DSCR
- —
- Eligible?
- —
Personal DTI + credit; lowest rate.
DSCR
20% down · 8.5% · 30yr
- Down + closing
- —
- Monthly P&I
- —
- Monthly cashflow
- —
- DSCR
- —
- Eligible?
- —
No personal income docs; deal must DSCR.
Hard money
10% down · 12.0% · 12mo
- Down + closing
- —
- Monthly P&I
- —
- Monthly cashflow
- —
- DSCR
- —
- Eligible?
- —
Short-term bridge; refi at stabilization.
Listing history 2 events
-
2026-05-26historical
-
2026-05-05$125,000
ⓘ Source: listings_history table (triggers on properties + properties_extension) + one-shot
backfill from property_details.listing_events for pre-trigger history.
Climate risk First Street
- Flood 1/10 Low FEMA zone X (unshaded) · 0% chance over 30 yrs
- Wildfire 1/10 Low
- Heat 2/10 Low 7 d/yr ≥100°F today · 13 d/yr by 30 yrs out
- Wind 2/10 Low
- Air quality 2/10 Low 1 unhealthy d/yr today · 1 by 30 yrs out
Nearby sold comps map
Loading sold comps map…
Walkable amenities ~0.75 mi
Loading nearby amenities…
Taxation est. · year 1
- Rental income
- $14,785
- − Mortgage interest
- −$7,002
- − Property taxes
- −$1,875
- − Insurance
- −$625
- − Repairs & maintenance
- −$1,183
- − Management
- −$1,183
- − Depreciation
- −$3,636
- Taxable loss
- −$719
- Est. tax savings @ 24.0%
- +$173
- After-tax cash flow
- $1,486/yr
For passive investors: Depreciation is non-cash, so a rental often shows a tax loss while cash-flowing — sheltering income. Rental losses are passive: they offset passive income freely, and up to $25,000/yr can offset ordinary (W-2) income if you actively participate and your MAGI is under $100k (phasing out to $0 by $150k); unused losses carry forward. On sale, claimed depreciation is recaptured at up to 25%, and gains may owe capital-gains tax (a 1031 exchange can defer both). Figures are a year-1 estimate at your 24.0% rate — not tax advice; consult a CPA.
Schools (NCES district)
- District
- Milbank School District 25-4
- NCES district ID
- 4600002
- Math proficiency
- 46% ▲ 3.00%
- Reading proficiency
- 61% ▼ -1.00%
- Median HH income
- $49,055
- Composite
- 45.54/100
- National rank
- #2604
- State rank
- #19 of 59 in SD
Livability — Milbank
- Score
- 77/100
- State rank
- #19
- US rank
- #3182
Category grades
Schools grade is shown separately in the Schools card above.
Census & demographics
- Census place
- Milbank, SD
- Population (ZIP)
- 4,882
Population outlook (Grant County) Hauer SSP2
- Today (2025)
- 6,713 people
- By 2030
- 6,458 · -3.8%
- By 2040
- 5,990 · -10.8%
- By 2050
- 5,667 · -15.6%
- By 2075
- 5,925 · -11.7%
- By 2100
- 7,228 · +7.7%
Race, ethnicity, and origin ACS 2023
- Neighborhood character
- Predominantly White (89%)
- Race & ethnicity
- White 89% Hispanic / Latino 9% Two or more races 3% Native American 3%
- Hispanic origin (detail)
- Mexican 7%
- Common ancestry
- Portuguese 17% Iranian 6% English 1%
- Foreign-born
- 8% · Canada
- Languages at home
- 88% English-only · Spanish 8% German/W. Germanic 3% Korean 1%
Political lean MEDSL · Grant
- 2024 margin
- Solid R (+45.4) · D 26.1% · R 71.5% · Other 2.5%
- 2008→2024 swing
- -41.1pp toward R · 2008: -4.3pp · 2024: -45.4pp
- All cycles
- 2024: R+45.4 2020: R+41.7 2016: R+39.6 2012: R+15.0 2008: R+4.3
Not yet ingested
- Civics
- —
Market trends
- HPI YoY
- ▼ -106.85%
- Current HPI
- 160.3639
- Rent YoY
- —
- Metro
- —
- State GDP YoY
- ▲ 0.70%
- F500 in state
- 2
Industry mix (Fortune 500 HQ in SD)
| Industry | F500 HQs | Revenue |
|---|---|---|
| Utilities | 1 | $1B |
|
||
Price history
2 events — show timeline
- 2026-05-26 Delisted — NESD
- 2026-05-05 Listed $125,000 NESD
Cash-flow waterfall
monthlySold comps — $/sqft
last 12 mo · ≤1 miLoading sold comps…