 Multi-family
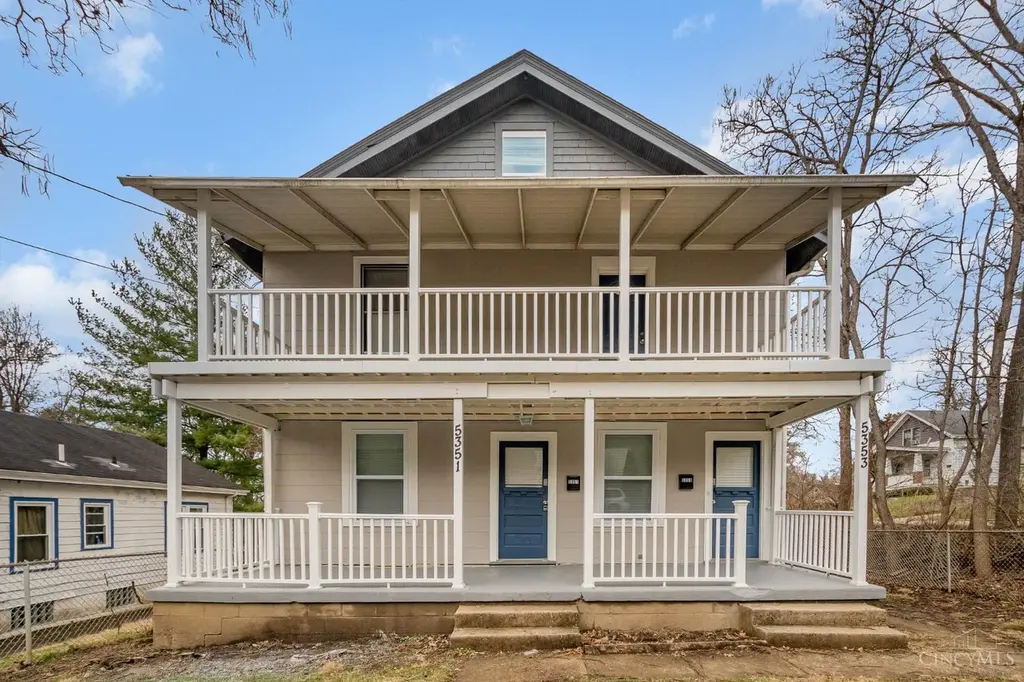
5351 Chapman · Cincinnati, OH
Flood risk 1/10 · Minimal
- FEMA flood zone
- X (unshaded)
- Chance of flooding over 30 yrs
- 0.0%
- Est. flood insurance / yr
- $473 – $860
Fire risk 1/10 · Minimal
- Est. fire insurance / yr
- $713 – $1,323
Heat risk 4/10 · Minor
- Hot days now (above 103°F)
- 7 days/yr
- Hot days in 30 yrs
- 19 days/yr
Wind risk 2/10 · Minimal
- Chance of severe wind over 30 yrs
- 1.0%
Air-quality risk 4/10 · Minor
- Unhealthy air days now
- 4 days/yr
- Unhealthy air days in 30 yrs
- 5 days/yr
Risk factors via First Street. Map © Google.
Why this score? — see what drove the C grade
The composite is a weighted blend of 9 inputs, each scored 0–100. Each bar is that input's sub-score; the figure is the points it added to the 100-point composite (weight × sub-score).
- Cash flow +22.5/30.0
- ARV discount +7.5/15.0
- DSCR +7.2/10.0
- 1% rule +5.3/10.0
- Rent growth +4.0/5.0
- Livability +4.0/5.0
- Schools +2.5/10.0
- Condition / age +2.5/5.0
- Appreciation +0.0/10.0
$349,000
🖨 Deal sheet 📄 Offer letter ✓ Due diligence
Multi-family units
County records classify this as Multi-Family (2-4 Unit). Listing-text estimate: 1 unit. estimate disagrees with records
Listing remarks MLS
INVESTOR SPECIAL! All new electrical and updated bathroom. Drywall on property stays with the home. Property sold AS-IS
Key facts
- Separate utilities
- Bonus rooms
- Income producing
Tags
Property features AI
Finance
- Financial info: Two rental units with current rents listed: 2-bedroom $1,495; 3+ bedroom $1,695
Exterior
- Parking: Detached driveway parking with 2 garage spaces and 2 open parking spaces
- Utilities: Public water; Public sewer; Natural gas
- Home design: Duplex; Two levels; Poured foundation
- Construction: Vinyl siding; Shingle roof; Poured foundation; Built as a duplex
- Exterior features: Vinyl windows
Interior
- Bedrooms: Two-unit property: one 2-bedroom unit and one 3+ bedroom unit
- Heating & cooling: Forced air heating; Central air conditioning
- Interior features: Full basement
Neighborhood map
What this means for you Summary
Snapshot
- This is a 3-bed/2.0-bath multifamily listed at $349k.
Deal economics
- At list price, monthly cash flow is $589 ($7k/yr) — positive.
- The deal already cash-flows at list — no discount required.
- Meets the 1% rule at list price ($4k rent vs $349k).
- Cap rate 8.3% vs local median 3.9% in Cincinnati — top-decile yield for the area; either an underpriced asset or a hidden risk that comps aren't pricing in. Stress-test before assuming the spread holds.
Location & tenants
- Location reads 80/100 on livability (#130 in OH, #1,856 nationally) — a professional / high-income tenant draw. Strengths: amenities A+, commute A+, cost of living A+; Watch: employment D, crime F.
- Cincinnati Public Schools (urban): math 25% / reading 36% proficiency, ranked #581 of 656 in OH (top 89%) — families likely to look elsewhere, expect single-tenant / working-renter base with shorter leases; 70% free/reduced lunch — lower-income household profile, screen leases tightly.
- Market conditions: Rents rising fast (+5.9%/yr); 70 active listings in the ZIP; 7 comparable units currently listed for rent nearby; rentals leasing fast (median 12d on market — plan ~1-2 weeks tenant-placement turnaround); 801 units permitted in Hamilton County in 2024 (190 in 5+ unit buildings).
- At $3,588/mo this rent would consume 60% of the median local household income ($72k/yr) (locally 1046% of renters already pay >50% of income on rent) — very limited rent-growth headroom before tenants either downsize or default.
Forward outlook
- Local home prices are declining (-3.0%/yr); year-one equity from $2k of loan paydown is wiped out by about $10k of value loss. Plan a longer hold.
- At projected returns (-3.0% appreciation + 5.9% rent growth), your $98k cash investment doubles in ~10 years — after that, you're playing with house money.
Negotiation context
- Only 1 days on market — expect competitive offers; lowballing is unlikely to land.
- 4 sale attempts since 4y ago; this cycle's ask has dropped $20k (5%) from the opening price — seller is motivated, your offer sets the floor, not the list.
- Current owner paid $142k; list at $349k implies a 145% gain — meaningful room to come down on a strong offer.
Risks & watch-outs
- Watch-outs: built in 1924 — expect roof / HVAC / electrical / plumbing capex.
Questions for the listing agent
- Built in 1924 — when were the roof, HVAC, electrical panel, plumbing, and water heater last replaced?
- Is there a deadline driving the sale (1031 exchange, divorce, estate, relocation)? That informs how much negotiation room exists.
- Schools are B-rated — typically a magnet for longer-tenancy family renters. What's the average tenant stay here, and is there a school-zone premium baked into asking?
- Crime grade is F in this area — have there been break-ins, vandalism, or insurance claims at this property in the last 3 years? What carrier currently insures it and at what premium?
- What's the average days-on-market for RENTAL listings here right now (not sales)? A rising rental-DOM trend means longer vacancies and softer asking-rent achievability than the comps imply.
- What's the recent tenant-quality profile in this submarket — average credit score on applications, eviction rate, late-payment / NSF rate, and stable-employment percentage? A property-management company in the area should have these aggregated.
- How much new apartment / multifamily construction is in the pipeline within 1–3 miles? Heavy new supply (>2% of stock underway) typically softens rents 12–24 months out; light construction supports rent growth.
Investment metrics
- 1% rule
- 1.03% ✓
- Cap rate
- 8.32%
- Cash-on-cash
- 7.24%
- DSCR
- 1.32
- GRM
- 8.1
CMA / ARV
No comps found within radius.
Projected returns pro-forma
-3.0% appreciation · 5.86% rent growth · sell at horizon
- IRR
- -2.2%
- Equity multiple
- 0.91×
- Total profit
- $-8,438
- Equity at exit
- $52,037
- IRR
- 10.2%
- Equity multiple
- 1.89×
- Total profit
- $87,014
- Equity at exit
- $30,175
Cash invested: $97,720 (down + closing). Projections, not guarantees.
Landlord ↔ Tenant lean methodology
- Overall (STATE)
- 73 Landlord-Friendly
- State Ohio
- 73 Landlord-Friendly · R+6
- County
- — inherits STATE
- City
- — inherits STATE
ZIP-level market 45227
- Rents YoY
- 5.9%
- Active inventory
- 70
- Price-to-rent
- 16.7×
Monthly cashflow live
- Estimated rent
- $3,588 high interval (Pro) →
- Mortgage (P&I)
- −$1,830
- Tax from tax record
- −$269 /mo · $3,233/yr
- Insurance
- −$145
- HOA
- −$0
- Vacancy / Maint / Mgmt
- −$753
- Net cashflow
- $589
Break-even live
2-unit breakdown (identical units grouped — click to expand)
| Units | Beds | Baths | Est. rent |
|---|---|---|---|
| 1× unit | 2 | 1 | $1,738 |
| 1× unit | 3 | 1 | $1,850 |
| Total (2 units) | $3,588 | ||
UW: 25.0% down · 7.5% · 30yr · 1.5% tax · 5.0% vac · 8.0% maint · 8.0% mgmt
Financing live
Cash to close
- Down payment
- $87,250
- Closing costs
- $10,470
- Reserves months
- —
- Total cash needed
- —
Loan-product check · same deal, 3 products live
Conventional
25% down · 7.5% · 30yr
- Down + closing
- —
- Monthly P&I
- —
- Monthly cashflow
- —
- DSCR
- —
- Eligible?
- —
Personal DTI + credit; lowest rate.
DSCR
20% down · 8.5% · 30yr
- Down + closing
- —
- Monthly P&I
- —
- Monthly cashflow
- —
- DSCR
- —
- Eligible?
- —
No personal income docs; deal must DSCR.
Hard money
10% down · 12.0% · 12mo
- Down + closing
- —
- Monthly P&I
- —
- Monthly cashflow
- —
- DSCR
- —
- Eligible?
- —
Short-term bridge; refi at stabilization.
Rent comps 7 comps
| Address | Beds | Baths | Sqft | Rent | $/sqft | DOM | Units | Dist |
|---|---|---|---|---|---|---|---|---|
| 5319 Weltner Ave Cincinnati, OH | 3.0 | 1.0 | 1408 | $1,900 | $1.35 | 4d | 1 | 0.13mi |
| 6303 Chandler St Cincinnati, OH | 4.0 | 2.5 | 1732 | $3,300 | $1.91 | 11d | 1 | 0.20mi |
| 5123 Glenshade Ave Cincinnati, OH | 3.0 | 1.0 | 1442 | $1,995 | $1.38 | 24d | 1 | 0.24mi |
| 6304 Desmond St Cincinnati, OH | 4.0 | 1.5 | 1900 | $2,750 | $1.45 | 7d | 1 | 0.24mi |
| 5500 Ehrling Rd Cincinnati, OH | 3.0 | 2.0 | 1408 | $2,031 | $1.44 | 24d | 1 | 0.98mi |
| 6208 Bancroft St Cincinnati, OH | 3.0 | 2.5 | 1937 | $2,500 | $1.29 | 2d | 1 | 1.23mi |
| 6703 Murray Ave Cincinnati, OH | 2.0–3.0 | 1.0 | 1300 | $1,700 | $1.31 | 44d | 1 | 1.26mi |
Listing history 21 events
-
2026-06-18pricedays on market $349,000 Active 1 DOM
-
2026-06-09days on market $359,000 Active 57 DOM
-
2026-06-08days on market $359,000 Active 56 DOM
-
2026-06-07days on market $359,000 Active 55 DOM
-
2026-06-03days on market $359,000 Active 51 DOM
-
2026-06-02days on market $359,000 Active 50 DOM
-
2026-06-01days on market $359,000 Active 49 DOM
-
2026-05-31days on market $359,000 Active 48 DOM
-
2026-05-21status Active
-
2026-04-25historical Contingency Pending
-
2026-04-25historical
-
2026-04-22status Active
-
2026-04-14historical Contingency Pending
-
2026-04-11price $359,000
-
2026-03-18$369,000 Active
-
2023-09-13price $142,500 122-char remark
Show marketing remark (122 chars)
INVESTOR SPECIAL! All new electrical and updated bathroom. Drywall on property stays with the home. Property sold AS-IS
-
2022-11-10soldstatus $142,500
-
2022-10-20soldstatus $142,500 Sold 122-char remark
Show marketing remark (122 chars)
INVESTOR SPECIAL! All new electrical and updated bathroom. Drywall on property stays with the home. Property sold AS-IS
-
2022-09-21historical Contingency Pending 122-char remark
Show marketing remark (122 chars)
INVESTOR SPECIAL! All new electrical and updated bathroom. Drywall on property stays with the home. Property sold AS-IS
-
2022-09-21price $159,000 122-char remark
Show marketing remark (122 chars)
INVESTOR SPECIAL! All new electrical and updated bathroom. Drywall on property stays with the home. Property sold AS-IS
-
2022-09-16$159,000 Active 122-char remark
Show marketing remark (122 chars)
INVESTOR SPECIAL! All new electrical and updated bathroom. Drywall on property stays with the home. Property sold AS-IS
ⓘ Source: listings_history table (triggers on properties + properties_extension) + one-shot
backfill from property_details.listing_events for pre-trigger history.
Tax reassessment forecast OH · Partial reset (capped growth)
- Current annual tax
- $3,233 · $269/mo
- Projected year-2 tax
- $4,339 · $362/mo
- Expected delta
- +$1,106/yr (+$92/mo · 34.2%)
ⓘ Screening estimate from a state-policy table — verify with the county assessor before closing.
Climate risk First Street
- Flood 1/10 Low FEMA zone X (unshaded) · 0% chance over 30 yrs
- Wildfire 1/10 Low
- Heat 4/10 Moderate 7 d/yr ≥103°F today · 19 d/yr by 30 yrs out
- Wind 2/10 Low 100% chance of damaging wind over 30 yrs
- Air quality 4/10 Moderate 4 unhealthy d/yr today · 5 by 30 yrs out
Nearby sold comps map
Loading sold comps map…
Walkable amenities ~0.75 mi
Loading nearby amenities…
Taxation est. · year 1
- Rental income
- $43,056
- − Mortgage interest
- −$19,549
- − Property taxes
- −$3,233
- − Insurance
- −$1,745
- − Repairs & maintenance
- −$3,444
- − Management
- −$3,444
- − Depreciation
- −$10,153
- Taxable income
- $1,487
- Est. tax owed @ 24.0%
- −$357
- After-tax cash flow
- $6,717/yr
For passive investors: Depreciation is non-cash, so a rental often shows a tax loss while cash-flowing — sheltering income. Rental losses are passive: they offset passive income freely, and up to $25,000/yr can offset ordinary (W-2) income if you actively participate and your MAGI is under $100k (phasing out to $0 by $150k); unused losses carry forward. On sale, claimed depreciation is recaptured at up to 25%, and gains may owe capital-gains tax (a 1031 exchange can defer both). Figures are a year-1 estimate at your 24.0% rate — not tax advice; consult a CPA.
Schools (NCES district)
- District
- Cincinnati Public Schools
- NCES district ID
- 3904375
- Math proficiency
- 25% ▼ -19.00%
- Reading proficiency
- 36% ▼ -14.00%
- Median HH income
- $35,743
- Composite
- 25.21/100
- National rank
- #7508
- State rank
- #581 of 656 in OH
Livability — Cincinnati
- Score
- 80/100
- State rank
- #130
- US rank
- #1856
Category grades
Schools grade is shown separately in the Schools card above.
Census & demographics
- Census place
- Cincinnati, OH
- County
- Hamilton County · 701,295 people
- City population
- 505,555
- Metro
- Cincinnati, OH-KY-IN
- Population (ZIP)
- 18,893
- Household income
- $71,646
- Rent vs Own
- Severe rent burden
- 1046.0
Population outlook (Hamilton County) Hauer SSP2
- Today (2025)
- 826,054 people
- By 2030
- 830,947 · +0.6%
- By 2040
- 832,319 · +0.8%
- By 2050
- 822,428 · -0.4%
- By 2075
- 788,688 · -4.5%
- By 2100
- 710,674 · -14.0%
Race, ethnicity, and origin ACS 2023
- Neighborhood character
- Predominantly White (72%)
- Race & ethnicity
- White 72% Black 21% Two or more races 5% Hispanic / Latino 2% Asian 1%
- Common ancestry
- Slovak 2% Romanian 2% Lithuanian 1%
- Foreign-born
- 2% · Canada
- Languages at home
- 97% English-only · Spanish 2%
Political lean MEDSL · Hamilton
- 2024 margin
- D (+14.9) · D 57.0% · R 42.1%
- 2008→2024 swing
- +7.9pp toward D · 2008: 7.0pp · 2024: 14.9pp
- All cycles
- 2024: D+14.9 2020: D+15.9 2016: D+9.5 2012: D+4.9 2008: D+7.0
Not yet ingested
- Civics
- —
Market trends
- HPI YoY
- ▼ -256.16%
- Current HPI
- 240.4507
- Rent YoY
- ▲ 5.86%
- Metro
- Cincinnati, OH-KY-IN
- State GDP YoY
- ▲ 1.98%
- F500 in state
- 48
Industry mix (Fortune 500 HQ in OH)
| Industry | F500 HQs | Revenue |
|---|---|---|
| Insurance | 3 | $145B |
|
||
| Industrial Machinery | 3 | $49B |
|
||
| Financial Services | 3 | $24B |
|
||
| Consumer Goods | 2 | $93B |
|
||
| Aerospace / Defense | 2 | $47B |
|
||
| Utilities | 2 | $33B |
|
||
Price history
+125.8% since first listed13 events — show timeline
- 2026-05-21 Relisted — Cincy MLS
- 2026-04-25 Contingent — Cincy MLS
- 2026-04-25 Listing Removed — Cincy MLS
- 2026-04-22 Relisted — Cincy MLS
- 2026-04-14 Contingent — Cincy MLS
- 2026-04-11 Price Changed $359,000 Cincy MLS
- 2026-03-18 Listed $369,000 Cincy MLS
- 2023-09-13 Price Changed $142,500 Cincy MLS
- 2022-11-10 Sold (Public Records) $142,500 Public Records
- 2022-10-20 Sold (MLS) $142,500 Cincy MLS
- 2022-09-21 Contingent — Cincy MLS
- 2022-09-21 Price Changed $159,000 Cincy MLS
- 2022-09-16 Listed $159,000 Cincy MLS
Property tax history
+14.0%/yrLatest (2025): $3,233 · +0.1% YoY. Source: county tax records.
Cash-flow waterfall
monthlySold comps — $/sqft
last 12 mo · ≤1 miLoading sold comps…