 🔨 Auction
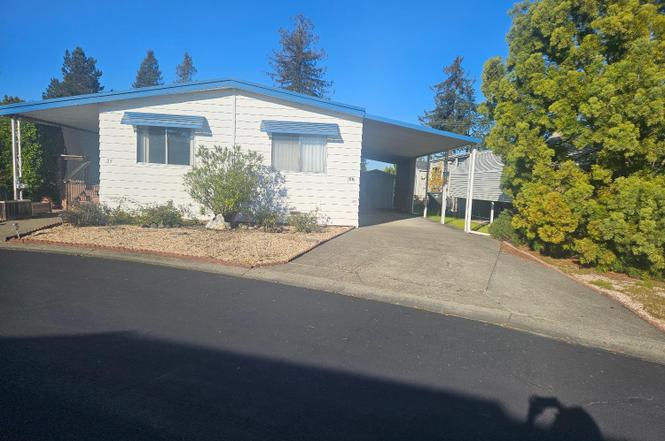
25 Chapala Dr · Santa Rosa, CA
Flood risk 1/10 · Minimal
- FEMA flood zone
- X (unshaded)
- Chance of flooding over 30 yrs
- 0.0%
- Est. flood insurance / yr
- $507 – $1,088
Fire risk 5/10 · Moderate
- Est. fire insurance / yr
- $659 – $1,223
Heat risk 4/10 · Minor
- Hot days now (above 92°F)
- 7 days/yr
- Hot days in 30 yrs
- 15 days/yr
Wind risk 1/10 · Minimal
- Chance of severe wind over 30 yrs
- —
Air-quality risk 10/10 · Severe
- Unhealthy air days now
- 21 days/yr
- Unhealthy air days in 30 yrs
- 21 days/yr
Risk factors via First Street. Map © Google.
Why this score? — see what drove the B- grade
The composite is a weighted blend of 9 inputs, each scored 0–100. Each bar is that input's sub-score; the figure is the points it added to the 100-point composite (weight × sub-score).
- Cash flow +29.6/30.0
- DSCR +10.0/10.0
- 1% rule +8.3/10.0
- ARV discount +7.5/15.0
- Livability +3.8/5.0
- Schools +3.7/10.0
- Rent growth +2.5/5.0
- Condition / age +2.5/5.0
- Appreciation +0.0/10.0
$19,000
🖨 Deal sheet 📄 Offer letter ✓ Due diligence
Listing remarks
AUCTION . Sale Submit offers please and question VIA EMAIL. 25 Chapala manufactured home offers a spacious layout, great natural light and an excellent opportunity to update and make it your own. PARK APPROVAL REQUIRED FOR OCCUPANCY, NOT REQUIRED FOR REMOVAL. Mobilehome DEALERS WELCOME. SPACE IS UNDER RENT CONTROL. Submit offers via email: [email protected] . A non-binding letter of intent stating price of offer is acceptable initially. Drive by, view the home, submit your offer and you may adjust your offer up or down after viewing. Home will be open for viewing on Monday May 15 from 4pm to 7pm. and 12 to 2:00 sat. and Sun. May20 and 21. Buyer must have cash and the sale is AS-IS. SUBMIT LET
Key facts
- 2 parking spots
- Built 1976
- Listed 7 days
Property features AI
Finance
- Financial info: Land lease amount applies
- HOA & community: No homeowners association; Senior community
Exterior
- Parking: 2 parking spaces; Guest parking available
- Utilities: Public sewer
- Home design: Manufactured in park (double wide); Fixer condition; Land lease community
- Construction: Manufacturer: Regal; Make: Regal; Skirting: Unknown
- Exterior features: Front yard; Located on a court
Interior
- Kitchen: Built-in electric oven; Built-in refrigerator; Double oven
- Bedrooms: 2 bedrooms
- Flooring: Carpet; Vinyl
- Bathrooms: 2 full bathrooms
- Heating & cooling: Central heating; No air conditioning
- Interior features: Built-in electric oven; Built-in refrigerator; Double oven; Family room; Living room; Solarium; Other bath features: shower stall(s) and tub with shower over
- Laundry & utility: Washer included; Dryer included; Laundry room
Neighborhood map
What this means for you Summary
Snapshot
- This is a 2-bed/2.0-bath manufactured listed at $19k.
Deal economics
- At list price, monthly cash flow is $807 ($10k/yr) — positive.
- The deal already cash-flows at list — no discount required.
- Meets the 1% rule at list price ($3k rent vs $19k).
- Cap rate 10.6% vs local median 2.5% in Santa Rosa — top-decile yield for the area; either an underpriced asset or a hidden risk that comps aren't pricing in. Stress-test before assuming the spread holds.
Location & tenants
- Location reads 75/100 on livability (#112 in CA, #3,940 nationally) — a middle-class / working-renter tenant base. Strengths: amenities A+, commute A+, employment A+; Watch: schools C-, cost of living F.
- Santa Rosa High (urban): math 31% / reading 47% proficiency, ranked #703 of 1,400 in CA (top 50%) — families likely to look elsewhere, expect single-tenant / working-renter base with shorter leases.
- Market conditions: Rents flat; 199 active listings in the ZIP; 29 comparable units currently listed for rent nearby; rentals leasing fast (median 14d on market — plan ~1-2 weeks tenant-placement turnaround); solid renter incomes; 1,039 units permitted in Sonoma County in 2024 (185 in 5+ unit buildings).
- This rent runs 36% of the median local income ($98k/yr) — at the standard rent-burdened threshold; future hikes will face affordability resistance.
Forward outlook
- Local home prices are declining (-3.0%/yr); year-one equity from $2k of loan paydown is wiped out by about $7k of value loss. Plan a longer hold.
- Sonoma County population projected at +8% by 2050 — modest demand growth; plan on rents tracking national, not racing it.
Negotiation context
- Only 7 days on market — expect competitive offers; lowballing is unlikely to land.
Risks & watch-outs
- Watch-outs: property tax is 17.7% of price.
- Climate carrying-cost: moderate wildfire risk — expect insurance premiums to compound above CPI over the hold.
Questions for the listing agent
- Built in 1976 — when were the roof, HVAC, electrical panel, plumbing, and water heater last replaced?
- Property tax is high relative to price — has the assessment been appealed recently, and will the sale trigger a re-assessment?
- Is there a deadline driving the sale (1031 exchange, divorce, estate, relocation)? That informs how much negotiation room exists.
- What's the average days-on-market for RENTAL listings here right now (not sales)? A rising rental-DOM trend means longer vacancies and softer asking-rent achievability than the comps imply.
- What's the recent tenant-quality profile in this submarket — average credit score on applications, eviction rate, late-payment / NSF rate, and stable-employment percentage? A property-management company in the area should have these aggregated.
- How much new for-sale + rental construction is in the pipeline within 1–3 miles? Heavy new supply typically softens prices + rents 12–24 months out; constrained supply supports both.
Investment metrics
- 1% rule
- 1.33% ✓
- Cap rate
- 10.62%
- Cash-on-cash
- 15.44%
- DSCR
- 1.69
- GRM
- 6.3
CMA / ARV
- ARV (on-the-fly)
- $224,000
- Comps found
- 12
Show comp detail 12 sales within ~0.75 mi
| Address | Dist | Beds/Ba | Sqft | Sold | Price | $/sf | Match |
|---|---|---|---|---|---|---|---|
| 26 Chapala Dr | 0.01mi | 2/2.0 | 1,440 (+3%) | 9mo | $133,142 | $92 | 87 |
| 4 Estrella Dr | 0.16mi | 2/2.0 | 1,440 (+3%) | 2mo | $149,000 | $103 | 86 |
| 89 Estrella Dr | 0.15mi | 2/2.0 | 1,440 (+3%) | 3mo | $230,000 | $160 | 86 |
| 108 Estrella Dr | 0.08mi | 2/2.0 | 1,440 (+3%) | 8mo | $240,000 | $167 | 84 |
| 85 Estrella Dr | 0.19mi | 2/2.0 | 1,450 (+4%) | 1mo | $145,000 | $100 | 84 |
| 107 Estrella Dr | 0.09mi | 2/2.0 | 1,440 (+3%) | 13mo | $160,000 | $111 | 80 |
| 90 Estrella Dr | 0.14mi | 2/2.0 | 1,464 (+5%) | 7mo | $173,000 | $118 | 80 |
| 109 Estrella Dr | 0.07mi | 2/2.0 | 1,248 (-11%) | 3mo | $165,000 | $132 | 76 |
| 3110 Loretta Way | 0.47mi | 3/2.0 (+1) | 1,344 (-4%) | 5mo | $245,000 | $182 | 62 |
| 119 Estrella Dr | 0.12mi | 3/2.0 (+1) | 1,600 (+14%) | 9mo | $265,000 | $166 | 58 |
| 1945 Piner Rd #148 | 0.74mi | 2/2.0 | 1,344 (-4%) | 7mo | $285,000 | $212 | 53 |
| 3116 Loretta Way | 0.49mi | 3/2.0 (+1) | 1,271 (-9%) | 12mo | $235,000 | $185 | 47 |
Match score weights: distance 35% · size 25% · config 20% · recency 20%. Top-matched comps best support the ARV.
Projected returns pro-forma
-3.0% appreciation · 0.1% rent growth · sell at horizon
- IRR
- 2.9%
- Equity multiple
- 1.11×
- Total profit
- $6,695
- Equity at exit
- $33,399
- IRR
- 9.4%
- Equity multiple
- 1.63×
- Total profit
- $39,465
- Equity at exit
- $19,367
Cash invested: $62,720 (down + closing). Projections, not guarantees.
Landlord ↔ Tenant lean methodology
- Overall (STATE)
- 18 Strongly Tenant-Friendly
- State California
- 18 Strongly Tenant-Friendly · D+13
- County
- — inherits STATE
- City
- — inherits STATE
ZIP-level market 95403
- Rents YoY
- 0.1%
- Active inventory
- 199
- Price-to-rent
- 0.5×
Monthly cashflow live
- Estimated rent
- $2,981 high interval (Pro) →
- Mortgage (P&I)
- −$1,175
- Tax est. 1.5%
- −$280 /mo · $3,360/yr
- Insurance
- −$93
- HOA
- −$0
- Vacancy / Maint / Mgmt
- −$626
- Net cashflow
- $807
Break-even live
UW: 25.0% down · 7.5% · 30yr · 1.5% tax · 5.0% vac · 8.0% maint · 8.0% mgmt
Financing live
Cash to close
- Down payment
- $56,000
- Closing costs
- $6,720
- Reserves months
- —
- Total cash needed
- —
Loan-product check · same deal, 3 products live
Conventional
25% down · 7.5% · 30yr
- Down + closing
- —
- Monthly P&I
- —
- Monthly cashflow
- —
- DSCR
- —
- Eligible?
- —
Personal DTI + credit; lowest rate.
DSCR
20% down · 8.5% · 30yr
- Down + closing
- —
- Monthly P&I
- —
- Monthly cashflow
- —
- DSCR
- —
- Eligible?
- —
No personal income docs; deal must DSCR.
Hard money
10% down · 12.0% · 12mo
- Down + closing
- —
- Monthly P&I
- —
- Monthly cashflow
- —
- DSCR
- —
- Eligible?
- —
Short-term bridge; refi at stabilization.
Rent comps 29 comps
| Address | Beds | Baths | Sqft | Rent | $/sqft | DOM | Units | Dist |
|---|---|---|---|---|---|---|---|---|
| 1938 Terry Rd Unit Main Santa Rosa, CA | 3.0 | 3.0 | 1604 | $3,679 | $2.29 | 13d | 1 | 0.25mi |
| 2705 Range Ave Santa Rosa, CA | 1.0–2.0 | 1.0–2.0 | 838 | $2,750 | $3.28 | 13d | 6 | 0.25mi |
| 2354 Heidi Pl Apt 1 Santa Rosa, CA | 2.0 | 1.0 | 900 | $2,000 | $2.22 | 13d | 1 | 0.35mi |
| 2791 McBride Ln #118 Santa Rosa, CA | 3.0 | 2.5 | 1400 | $3,500 | $2.50 | 13d | 1 | 0.36mi |
| 2980 Bay Village Cir Santa Rosa, CA | 1.0–3.0 | 1.0–2.0 | 924 | $2,778 | $3.01 | 13d | 7 | 0.56mi |
| 1333 W Steele Ln Santa Rosa, CA | 1.0–3.0 | 1.0–2.0 | 850 | $2,450 | $2.88 | 13d | 4 | 0.57mi |
| 561 Renaissance Way Santa Rosa, CA | 1.0–2.0 | 1.0–2.0 | 876 | $2,995 | $3.42 | 13d | 18 | 0.66mi |
| 3610 Mendocino Ave Santa Rosa, CA | 2.0 | 1.0–2.0 | 828 | $3,995 | $4.82 | 13d | 177 | 0.74mi |
| 2002 Pinercrest Dr Santa Rosa, CA | 1.0–2.0 | 1.0–2.0 | 792 | $2,350 | $2.97 | 13d | 1 | 0.76mi |
| 2001 Piner Rd Santa Rosa, CA | 1.0–2.0 | 1.0–2.0 | 901 | $2,473 | $2.74 | 13d | 5 | 0.84mi |
| 1595 Herbert St Unit 17 Santa Rosa, CA | 2.0 | 1.0 | 900 | $2,195 | $2.44 | 21d | 1 | 0.92mi |
| 1054 Edwards Ave Unit 1058- C Santa Rosa, CA | 2.0 | 1.5 | 1000 | $2,300 | $2.30 | 13d | 1 | 0.97mi |
| 1163 Hopper Ave Santa Rosa, CA | 1.0–2.0 | 1.0–2.0 | 773 | $2,625 | $3.40 | 7d | 2 | 0.97mi |
| 1514 Lance Dr Santa Rosa, CA | 3.0 | 2.5 | 1185 | $3,150 | $2.66 | 21d | 1 | 1.04mi |
| 1217 Jennings Ave Santa Rosa, CA | 3.0 | 2.0 | 1172 | $3,250 | $2.77 | 13d | 1 | 1.06mi |
| 426 Semillon Ln Santa Rosa, CA | 3.0 | 2.5 | 1746 | $3,600 | $2.06 | 13d | 1 | 1.07mi |
| 347 Semillon Ln Santa Rosa, CA | 3.0 | 4.0 | 1812 | $3,825 | $2.11 | 13d | 1 | 1.08mi |
| 2040 Autumn Walk Dr Santa Rosa, CA | 3.0 | 2.5 | 1428 | $3,450 | $2.42 | 13d | 1 | 1.08mi |
| 200 Bicentennial Way Santa Rosa, CA | 2.0–3.0 | 2.0–3.0 | 1272 | $2,811 | $2.21 | 13d | 3 | 1.09mi |
| 1020 Jennings Ave Santa Rosa, CA | 1.0–2.0 | 1.0–2.0 | 863 | $2,701 | $3.13 | 13d | 8 | 1.12mi |
| 2010 Pioneer Way Santa Rosa, CA | 2.0 | 1.5 | 880 | $2,374 | $2.70 | 13d | 2 | 1.16mi |
| 3587 Round Barn Blvd Santa Rosa, CA | 1.0–2.0 | 1.0–2.0 | 1112 | $2,995 | $2.69 | 4d | 4 | 1.18mi |
| 2300 Waltzer Rd Santa Rosa, CA | 2.0 | 1.0 | 1000 | $2,350 | $2.35 | 13d | 1 | 1.19mi |
| 1470 Tammy Way Santa Rosa, CA | 3.0 | 2.5 | 1200 | $3,000 | $2.50 | 13d | 1 | 1.27mi |
| 2203 Versaro Dr Santa Rosa, CA | 3.0 | 2.5 | 1800 | $3,750 | $2.08 | 13d | 1 | 1.32mi |
| 2135 Pebblewood Ct Santa Rosa, CA | 3.0 | 2.0 | 1340 | $3,400 | $2.54 | 13d | 1 | 1.36mi |
| 2120 Jennings Ave Santa Rosa, CA | 1.0–2.0 | 1.0–2.0 | 750 | $2,450 | $3.27 | 13d | 6 | 1.41mi |
| 2316 Dancing Penny Way Unit 1 Santa Rosa, CA | 3.0 | 2.5 | 1400 | $3,500 | $2.50 | 13d | 1 | 1.44mi |
| 2316 Dancing Penny Way Santa Rosa, CA | 3.0 | 2.5 | 1500 | $3,500 | $2.33 | 13d | 1 | 1.44mi |
Listing history 7 events
-
2026-06-18days on market $19,000 Active 7 DOM
-
2026-06-17days on market $19,000 Active 6 DOM
-
2026-06-16days on market $19,000 Active 5 DOM
-
2026-06-15days on market $19,000 Active 4 DOM
-
2026-06-14days on market $19,000 Active 2 DOM
-
2026-06-13remarks 699-char remark
-
2026-06-13$19,000 Active 1 DOM
ⓘ Source: listings_history table (triggers on properties + properties_extension) + one-shot
backfill from property_details.listing_events for pre-trigger history.
Climate risk First Street
- Flood 1/10 Low FEMA zone X (unshaded) · 0% chance over 30 yrs
- Wildfire 5/10 Major
- Heat 4/10 Moderate 7 d/yr ≥92°F today · 15 d/yr by 30 yrs out
- Wind 1/10 Low
- Air quality 10/10 Extreme 21 unhealthy d/yr today · 21 by 30 yrs out
Nearby sold comps map
Loading sold comps map…
Walkable amenities ~0.75 mi
Loading nearby amenities…
Taxation est. · year 1
- Rental income
- $35,773
- − Mortgage interest
- −$12,547
- − Property taxes
- −$3,360
- − Insurance
- −$1,120
- − Repairs & maintenance
- −$2,862
- − Management
- −$2,862
- − Depreciation
- −$6,516
- Taxable income
- $6,505
- Est. tax owed @ 24.0%
- −$1,561
- After-tax cash flow
- $8,123/yr
For passive investors: Depreciation is non-cash, so a rental often shows a tax loss while cash-flowing — sheltering income. Rental losses are passive: they offset passive income freely, and up to $25,000/yr can offset ordinary (W-2) income if you actively participate and your MAGI is under $100k (phasing out to $0 by $150k); unused losses carry forward. On sale, claimed depreciation is recaptured at up to 25%, and gains may owe capital-gains tax (a 1031 exchange can defer both). Figures are a year-1 estimate at your 24.0% rate — not tax advice; consult a CPA.
Schools (NCES district)
- District
- Santa Rosa High
- NCES district ID
- 0635830
- Math proficiency
- 31% —
- Reading proficiency
- 47% —
- Median HH income
- $62,000
- Composite
- 37.25/100
- National rank
- #8972
- State rank
- #703 of 1400 in CA
Livability — Santa Rosa
- Score
- 75/100
- State rank
- #112
- US rank
- #3940
Category grades
Schools grade is shown separately in the Schools card above.
Census & demographics
- Census place
- Santa Rosa, CA
- County
- Sonoma County · 449,805 people
- City population
- 210,074
- Metro
- Santa Rosa-Petaluma, CA
- Population (ZIP)
- 45,806
- Household income
- $98,191
- Rent vs Own
- Severe rent burden
- 1770.0
Population outlook (Sonoma County) Hauer SSP2
- Today (2025)
- 539,935 people
- By 2030
- 554,870 · +2.8%
- By 2040
- 573,262 · +6.2%
- By 2050
- 580,715 · +7.6%
- By 2075
- 579,229 · +7.3%
- By 2100
- 547,835 · +1.5%
Race, ethnicity, and origin ACS 2023
- Neighborhood character
- Diverse neighborhood (Simpson 0.61)
- Race & ethnicity
- White 50% Hispanic / Latino 37% Two or more races 13% Asian 5% Native American 2% Black 2%
- Hispanic origin (detail)
- Mexican 31%
- Common ancestry
- Italian 3% Slovak 2% Lithuanian 2%
- Foreign-born
- 20% · Canada, Vietnam, South Korea
- Languages at home
- 67% English-only · Spanish 26% Other Indo-European 1% Vietnamese 1%
Political lean MEDSL · Sonoma
- 2024 margin
- Solid D (+46.2) · D 71.4% · R 25.2% · Other 3.3%
- 2008→2024 swing
- -3.4pp toward R · 2008: 49.6pp · 2024: 46.2pp
- All cycles
- 2024: D+46.2 2020: D+51.5 2016: D+47.9 2012: D+44.9 2008: D+49.6
Not yet ingested
- Civics
- —
Market trends
- HPI YoY
- ▼ -679.94%
- Current HPI
- 254.3106
- Rent YoY
- ▲ 0.10%
- Metro
- Santa Rosa-Petaluma, CA
- State GDP YoY
- ▲ 3.21%
- F500 in state
- 116
Industry mix (Fortune 500 HQ in CA)
| Industry | F500 HQs | Revenue |
|---|---|---|
| Technology | 27 | $1,492B |
|
||
| Financial Services | 3 | $174B |
|
||
| Retail | 3 | $44B |
|
||
| Insurance | 3 | $26B |
|
||
| Media / Entertainment | 2 | $115B |
|
||
| Pharmaceuticals / Biotech | 2 | $62B |
|
||
Price history
1 event — show timeline
- 2026-06-11 Listed $19,000 BAREIS
Cash-flow waterfall
monthlySold comps — $/sqft
last 12 mo · ≤1 miLoading sold comps…