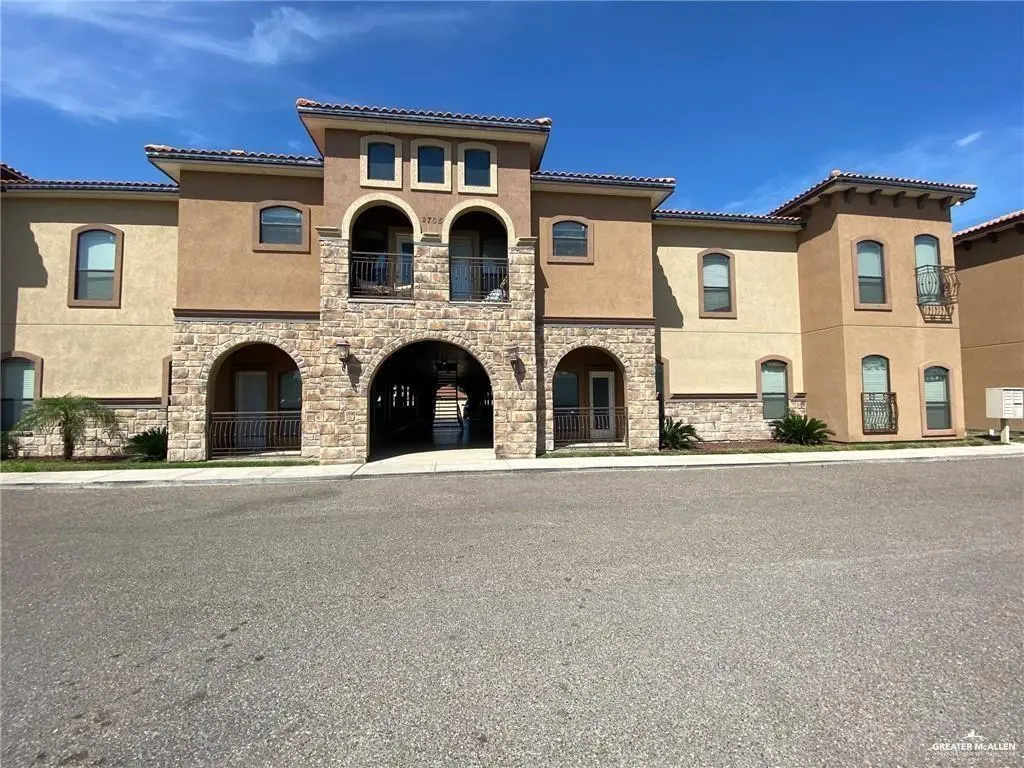
2705 Mimosa Dr #4 · Mission, TX
Flood risk 4/10 · Minor
- FEMA flood zone
- —
- Chance of flooding over 30 yrs
- 0.28%
- Est. flood insurance / yr
- —
Fire risk 2/10 · Minimal
- Est. fire insurance / yr
- $1,222 – $2,270
Heat risk 9/10 · Severe
- Hot days now (above 111°F)
- 7 days/yr
- Hot days in 30 yrs
- 23 days/yr
Wind risk 8/10 · Major
- Chance of severe wind over 30 yrs
- 96.0%
Air-quality risk 2/10 · Minimal
- Unhealthy air days now
- 1 days/yr
- Unhealthy air days in 30 yrs
- 2 days/yr
Risk factors via First Street. Map © Google.
Why this score? — see what drove the D+ grade
The composite is a weighted blend of 9 inputs, each scored 0–100. Each bar is that input's sub-score; the figure is the points it added to the 100-point composite (weight × sub-score).
- Cash flow +16.8/30.0
- ARV discount +7.5/15.0
- 1% rule +7.0/10.0
- DSCR +5.2/10.0
- Livability +3.8/5.0
- Schools +3.4/10.0
- Rent growth +2.5/5.0
- Condition / age +2.5/5.0
- Appreciation +0.0/10.0
$139,000
🖨 Deal sheet 📄 Offer letter ✓ Due diligence
Listing remarks
Comfort & Convenience in a Gated Community This well-kept Spanish Mediterranean-style condo offers a great blend of comfort, style, and location. Situated in a gated community close to parks, shopping centers, and schools, this home is ideal for anyone looking for a practical and welcoming place to live. Inside, you'll find tile flooring throughout, a modern kitchen with quartz countertops, stainless steel appliances, and wood cabinets that provide both charm and functionality. The unit features ceiling fans in key areas for added comfort and two private balconies—one off the master bedroom and another connected to the living room, perfect for relaxing or enjoying some fresh ai
Key facts
- Gated community
- Quartz countertops
- Ceiling fans
Tags
Neighborhood map
What this means for you Summary
Snapshot
- This is a 3-bed/2.0-bath condo listed at $139k.
Deal economics
- At list price, monthly cash flow is $88 ($1k/yr) — positive.
- The deal already cash-flows at list — no discount required.
- Meets the 1% rule at list price ($2k rent vs $139k).
- Recommended offer: $126k (9.0% below list) — sets the bar for market timing.
- Cap rate 7.1% vs local median 3.5% in Mission — top-decile yield for the area; either an underpriced asset or a hidden risk that comps aren't pricing in. Stress-test before assuming the spread holds.
Location & tenants
- Location reads 75/100 on livability (#148 in TX, #4,155 nationally) — a middle-class / working-renter tenant base. Strengths: cost of living A+, housing A+, health & safety A+; Watch: amenities F, commute F, employment D-.
- Sharyland ISD (urban): math 34% / reading 44% proficiency, ranked #406 of 826 in TX (top 49%) — families likely to look elsewhere, expect single-tenant / working-renter base with shorter leases.
- Zoned schools: Donna Wernecke El (math 23% / reading 35%, grade F, #2,668 of 4,322 statewide, top 63%, 697 students, 71% FRL); Sharyland Pioneer H S (math 31% / reading 51%, grade F, #774 of 1,632 statewide, top 49%, 1,471 students, 68% FRL).
- Market conditions: 474 active listings in the ZIP; 40 comparable units currently listed for rent nearby; rentals lingering (median 44d on market — plan ~5-8 weeks vacancy on turnover, expect pricing pressure); 52% of comp listings sitting > 30 days — soft ceiling on asking rent; 7,378 units permitted in Hidalgo County in 2024 (641 in 5+ unit buildings).
- This rent runs 38% of the median local income ($52k/yr) — at the standard rent-burdened threshold; future hikes will face affordability resistance.
Forward outlook
- Local home prices are declining (-3.0%/yr); year-one equity from $961 of loan paydown is wiped out by about $4k of value loss. Plan a longer hold.
- Hidalgo County population projected at +28% by 2050 — long-run rental-demand tailwind backs the buy-and-hold thesis.
Negotiation context
- It's been on market 91 days — a 9% lower offer ($126k) is reasonable based on typical stale-listing flexibility.
Risks & watch-outs
- Climate carrying-cost: severe wind risk, 96% chance of damaging wind over 30y; extreme-heat days projected 7→23/yr by 2055 (HVAC capex compounding) — expect insurance premiums to compound above CPI over the hold.
Questions for the listing agent
- It's been on market 91 days. Have you received any prior offers? Is the seller open to a 9% concession, seller financing, or rate buy-down credit?
- What does the HOA fee cover, when was the last increase, and are there any pending special assessments or reserve-fund shortfalls?
- Any open or pending special assessments — roof, HVAC, plumbing, elevator, façade? What's the per-unit balance and payoff schedule, and is the seller paying it off at close or rolling it to the buyer?
- Why hasn't it sold? Are there any deal-killer items the seller is aware of (foundation, flood, title, zoning, code violations)?
- Is there a deadline driving the sale (1031 exchange, divorce, estate, relocation)? That informs how much negotiation room exists.
- The area grade is low — what's the realistic commute time and amenity access for the typical tenant pool here? Any planned neighborhood developments (good or bad) we should know about?
- What's the average days-on-market for RENTAL listings here right now (not sales)? A rising rental-DOM trend means longer vacancies and softer asking-rent achievability than the comps imply.
- What's the recent tenant-quality profile in this submarket — average credit score on applications, eviction rate, late-payment / NSF rate, and stable-employment percentage? A property-management company in the area should have these aggregated.
- How much new apartment / multifamily construction is in the pipeline within 1–3 miles? Heavy new supply (>2% of stock underway) typically softens rents 12–24 months out; light construction supports rent growth.
Investment metrics
- 1% rule
- 1.20% ✓
- Cap rate
- 7.05%
- Cash-on-cash
- 2.71%
- DSCR
- 1.12
- GRM
- 6.9
CMA / ARV
No comps found within radius.
Projected returns pro-forma
-3.0% appreciation · 3.0% rent growth · sell at horizon
- IRR
- -11.9%
- Equity multiple
- 0.57×
- Total profit
- $-16,728
- Equity at exit
- $20,725
- IRR
- -2.5%
- Equity multiple
- 0.83×
- Total profit
- $-6,567
- Equity at exit
- $12,018
Cash invested: $38,920 (down + closing). Projections, not guarantees.
Landlord ↔ Tenant lean methodology
- Overall (STATE)
- 87 Strongly Landlord-Friendly
- State Texas
- 87 Strongly Landlord-Friendly · R+5
- County
- — inherits STATE
- City
- — inherits STATE
ZIP-level market 78574
- Home prices YoY
- -16.1%
- Active inventory
- 474
- Price-to-rent
- 6.9×
Monthly cashflow live
- Estimated rent
- $1,673 high interval (Pro) →
- Mortgage (P&I)
- −$729
- Tax est. 1.5%
- −$174 /mo · $2,085/yr
- Insurance
- −$58
- HOA
- −$273
- Vacancy / Maint / Mgmt
- −$351
- Net cashflow
- $88
Break-even live
UW: 25.0% down · 7.5% · 30yr · 1.5% tax · 5.0% vac · 8.0% maint · 8.0% mgmt
Financing live
Cash to close
- Down payment
- $34,750
- Closing costs
- $4,170
- Reserves months
- —
- Total cash needed
- —
Loan-product check · same deal, 3 products live
Conventional
25% down · 7.5% · 30yr
- Down + closing
- —
- Monthly P&I
- —
- Monthly cashflow
- —
- DSCR
- —
- Eligible?
- —
Personal DTI + credit; lowest rate.
DSCR
20% down · 8.5% · 30yr
- Down + closing
- —
- Monthly P&I
- —
- Monthly cashflow
- —
- DSCR
- —
- Eligible?
- —
No personal income docs; deal must DSCR.
Hard money
10% down · 12.0% · 12mo
- Down + closing
- —
- Monthly P&I
- —
- Monthly cashflow
- —
- DSCR
- —
- Eligible?
- —
Short-term bridge; refi at stabilization.
Rent comps 40 comps
| Address | Beds | Baths | Sqft | Rent | $/sqft | DOM | Units | Dist |
|---|---|---|---|---|---|---|---|---|
| 2705 Mimosa St #8 Mission, TX | 2.0 | 2.0 | 1245 | $1,480 | $1.19 | 43d | 1 | 0.02mi |
| 2715 Mimosa St #12 Mission, TX | 3.0 | 2.0 | 1408 | $1,350 | $0.96 | 14d | 1 | 0.03mi |
| 2815 Mimosa St Mission, TX | 2.0 | 2.0 | 1154 | $1,088 | $0.94 | 14d | 1 | 0.08mi |
| 1313 N 48th St Unit 4 McAllen, TX | 4.0 | 2.5 | 1172 | $1,295 | $1.10 | 43d | 1 | 0.40mi |
| 4725 Mulberry Ave Unit 3 McAllen, TX | 2.0 | 2.0 | 928 | $1,250 | $1.35 | 43d | 1 | 0.42mi |
| 4729 Magnolia Ave Unit 4 McAllen, TX | 2.0 | 2.0 | 954 | $1,300 | $1.36 | 43d | 1 | 0.44mi |
| 4705 Mulberry Ave Unit 3 McAllen, TX | 2.0 | 2.0 | 954 | $1,200 | $1.26 | 43d | 1 | 0.49mi |
| 4701 Mulberry Ave Unit 3 McAllen, TX | 2.0 | 2.0 | 954 | $1,250 | $1.31 | 21d | 1 | 0.51mi |
| 2401 E 27th St Mission, TX | 3.0 | 2.0 | 1727 | $1,850 | $1.07 | 23d | 1 | 0.51mi |
| 2505 E Solar Dr Mission, TX | 3.0 | 3.5 | 1550 | $2,300 | $1.48 | 43d | 1 | 0.55mi |
| 2614 E Solar Dr Mission, TX | 3.0 | 2.5 | 1492 | $3,000 | $2.01 | 23d | 1 | 0.59mi |
| 1013 N 47th St McAllen, TX | 4.0 | 2.0 | 1663 | $1,650 | $0.99 | 21d | 1 | 0.59mi |
| 4217 La Vista Ave Unit 2 McAllen, TX | 3.0 | 2.0 | 1030 | $1,300 | $1.26 | 43d | 1 | 0.61mi |
| 4608 W Ivy Ave McAllen, TX | 3.0 | 2.0 | 1655 | $1,900 | $1.15 | 14d | 1 | 0.63mi |
| 2201 E 21st St Mission, TX | 4.0 | 2.0 | 1529 | $1,850 | $1.21 | 14d | 1 | 0.71mi |
| 2304 N 45th St McAllen, TX | 3.0 | 2.5 | 1669 | $2,500 | $1.50 | 18d | 1 | 0.73mi |
| 2609 May Ave Mission, TX | 3.0 | 2.0 | 1670 | $1,800 | $1.08 | 43d | 1 | 0.76mi |
| 2203 E 19th St Mission, TX | 3.0 | 2.0 | 1856 | $2,300 | $1.24 | 23d | 1 | 0.78mi |
| 2200 E 19th St Mission, TX | 3.0 | 2.0 | 1829 | $1,950 | $1.07 | 43d | 1 | 0.80mi |
| 4216 Walnut Ave Unit 3 McAllen, TX | 3.0 | 2.0 | 1020 | $1,375 | $1.35 | 43d | 1 | 0.82mi |
| 4305 Walnut Ave Unit 3 McAllen, TX | 2.0 | 2.0 | 900 | $1,250 | $1.39 | 43d | 1 | 0.83mi |
| 4305 Walnut Ave Unit 1 McAllen, TX | 3.0 | 2.0 | 1148 | $1,250 | $1.09 | 23d | 1 | 0.83mi |
| 4116 Walnut Ave Unit 1 McAllen, TX | 2.0 | 2.0 | 950 | $1,025 | $1.08 | 14d | 1 | 0.94mi |
| 4104 Walnut Ave Unit 4 McAllen, TX | 2.0 | 2.0 | 950 | $1,125 | $1.18 | 14d | 1 | 0.99mi |
| 2510 E U.S. Business 83 Unit 8 Mission, TX | 2.0 | 1.5 | 940 | $800 | $0.85 | 14d | 1 | 1.01mi |
| 2514 Yarrow St Mission, TX | 3.0 | 2.0 | 1682 | $2,700 | $1.61 | 23d | 1 | 1.02mi |
| 103 S 48th Ln #3 McAllen, TX | 3.0 | 2.5 | 1272 | $1,500 | $1.18 | 43d | 1 | 1.04mi |
| 103 S 48th Ln #3 McAllen, TX | 3.0 | 2.5 | 1272 | $1,400 | $1.10 | 14d | 1 | 1.04mi |
| 1901 N Glasscock Rd Lot 61 Mission, TX | 3.0 | 2.0 | 960 | $526 | $0.55 | 18d | 1 | 1.06mi |
| 1901 N Glasscock Rd Unit 17-A Mission, TX | 3.0 | 2.0 | 924 | $950 | $1.03 | 43d | 1 | 1.06mi |
| 804 N Taylor Rd Unit 34 Mission, TX | 2.0 | 2.0 | 1020 | $850 | $0.83 | 43d | 1 | 1.07mi |
| 804 N Taylor Rd Mission, TX | 2.0 | 2.0 | 1020 | $850 | $0.83 | 43d | 1 | 1.07mi |
| 116 S 49th St #1 McAllen, TX | 3.0 | 2.5 | 1206 | $1,400 | $1.16 | 43d | 1 | 1.08mi |
| 115 S 48th Ln Unit 2 McAllen, TX | 2.0 | 2.5 | 1250 | $1,200 | $0.96 | 43d | 1 | 1.09mi |
| 214 S 48th Ln Unit 1 McAllen, TX | 2.0 | 2.5 | 1190 | $1,000 | $0.84 | 43d | 1 | 1.15mi |
| 213 S 49th St Unit 4 McAllen, TX | 2.0 | 2.5 | 1225 | $1,350 | $1.10 | 23d | 1 | 1.16mi |
| 1801 Crown Pointe Blvd Mission, TX | 3.0 | 2.0 | 1609 | $1,650 | $1.03 | 14d | 1 | 1.18mi |
| 400 S 49th St Unit 4 McAllen, TX | 3.0 | 2.5 | 1080 | $1,100 | $1.02 | 43d | 1 | 1.23mi |
| 400 S 49th St Unit 2 McAllen, TX | 2.0 | 2.5 | 1080 | $950 | $0.88 | 43d | 1 | 1.23mi |
| 415 N 38th St McAllen, TX | 2.0 | 1.0 | 936 | $800 | $0.85 | 43d | 1 | 1.24mi |
HOA detail condo
- Monthly dues
- $273 · $3,276/yr
- Likely covers
- security
- Assessments
- None detected in remarks — confirm with the listing agent.
Listing history 3 events
-
2026-04-26status Pending
-
2026-04-16historical Option
-
2026-01-24$139,000 Active
ⓘ Source: listings_history table (triggers on properties + properties_extension) + one-shot
backfill from property_details.listing_events for pre-trigger history.
Climate risk First Street
- Flood 4/10 Moderate 28% chance over 30 yrs
- Wildfire 2/10 Low
- Heat 9/10 Extreme 7 d/yr ≥111°F today · 23 d/yr by 30 yrs out
- Wind 8/10 Severe 96% chance of damaging wind over 30 yrs
- Air quality 2/10 Low 1 unhealthy d/yr today · 2 by 30 yrs out
Nearby sold comps map
Loading sold comps map…
Walkable amenities ~0.75 mi
Loading nearby amenities…
Taxation est. · year 1
- Rental income
- $20,075
- − Mortgage interest
- −$7,786
- − Property taxes
- −$2,085
- − Insurance
- −$695
- − Repairs & maintenance
- −$1,606
- − Management
- −$1,606
- − HOA
- −$3,276
- − Depreciation
- −$4,044
- Taxable loss
- −$1,023
- Est. tax savings @ 24.0%
- +$246
- After-tax cash flow
- $1,301/yr
For passive investors: Depreciation is non-cash, so a rental often shows a tax loss while cash-flowing — sheltering income. Rental losses are passive: they offset passive income freely, and up to $25,000/yr can offset ordinary (W-2) income if you actively participate and your MAGI is under $100k (phasing out to $0 by $150k); unused losses carry forward. On sale, claimed depreciation is recaptured at up to 25%, and gains may owe capital-gains tax (a 1031 exchange can defer both). Figures are a year-1 estimate at your 24.0% rate — not tax advice; consult a CPA.
Schools (NCES district)
- District
- Sharyland ISD
- NCES district ID
- 4839930
- Math proficiency
- 34% ▼ -35.00%
- Reading proficiency
- 44% ▼ -15.00%
- Median HH income
- $57,792
- Composite
- 34.38/100
- National rank
- #5214
- State rank
- #406 of 826 in TX
Livability — Mission
- Score
- 75/100
- State rank
- #148
- US rank
- #4155
Category grades
Schools grade is shown separately in the Schools card above.
Census & demographics
- Census place
- Mission, TX
- County
- Hidalgo County · 623,128 people
- Metro
- McAllen-Edinburg-Mission, TX
- Population (ZIP)
- 62,456
- Household income
- $52,393
- Rent vs Own
- Severe rent burden
- 803.0
Population outlook (Hidalgo County) Hauer SSP2
- Today (2025)
- 955,232 people
- By 2030
- 1,009,774 · +5.7%
- By 2040
- 1,120,332 · +17.3%
- By 2050
- 1,225,036 · +28.2%
- By 2075
- 1,439,189 · +50.7%
- By 2100
- 1,533,429 · +60.5%
Race, ethnicity, and origin ACS 2023
- Neighborhood character
- Predominantly Hispanic (97%)
- Race & ethnicity
- Hispanic / Latino 97% Two or more races 62% White 2%
- Hispanic origin (detail)
- Mexican 93%
- Foreign-born
- 33% · Canada
- Languages at home
- 12% English-only · Spanish 87%
Political lean MEDSL · Hidalgo
- 2024 margin
- Toss-up / Even · D 48.1% · R 51.0%
- 2008→2024 swing
- -41.6pp toward R · 2008: 38.7pp · 2024: -2.9pp
- All cycles
- 2024: R+2.9 2020: D+17.1 2016: D+40.5 2012: D+41.8 2008: D+38.7
Not yet ingested
- Civics
- —
Market trends
- HPI YoY
- ▼ -44.13%
- Current HPI
- 230.3323
- Rent YoY
- —
- Metro
- McAllen-Edinburg-Mission, TX
- State GDP YoY
- ▲ 3.95%
- F500 in state
- 110
Industry mix (Fortune 500 HQ in TX)
| Industry | F500 HQs | Revenue |
|---|---|---|
| Energy | 16 | $1,198B |
|
||
| Technology | 5 | $198B |
|
||
| Engineering / Construction | 4 | $72B |
|
||
| Energy Services | 3 | $60B |
|
||
| Utilities | 3 | $41B |
|
||
| Healthcare | 2 | $330B |
|
||
Price history
3 events — show timeline
- 2026-04-26 Pending — MCALLENMLS
- 2026-04-16 Contingent — MCALLENMLS
- 2026-01-24 Listed $139,000 MCALLENMLS
Cash-flow waterfall
monthlySold comps — $/sqft
last 12 mo · ≤1 miLoading sold comps…