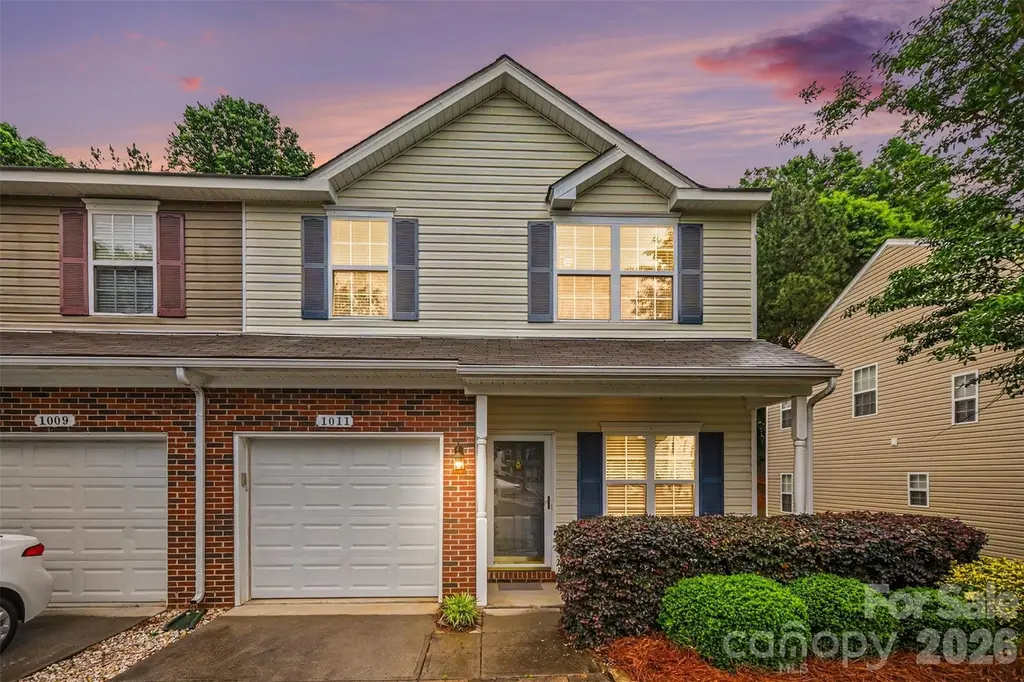
1011 Silver Springs Rd · Fort Mill, SC
Flood risk 1/10 · Minimal
- FEMA flood zone
- X (unshaded)
- Chance of flooding over 30 yrs
- 0.0%
- Est. flood insurance / yr
- $507 – $1,088
Fire risk 3/10 · Minor
- Est. fire insurance / yr
- $783 – $1,453
Heat risk 6/10 · Moderate
- Hot days now (above 105°F)
- 7 days/yr
- Hot days in 30 yrs
- 16 days/yr
Wind risk 6/10 · Moderate
- Chance of severe wind over 30 yrs
- 27.0%
Air-quality risk 3/10 · Minor
- Unhealthy air days now
- 3 days/yr
- Unhealthy air days in 30 yrs
- 3 days/yr
Risk factors via First Street. Map © Google.
Why this score? — see what drove the D- grade
The composite is a weighted blend of 9 inputs, each scored 0–100. Each bar is that input's sub-score; the figure is the points it added to the 100-point composite (weight × sub-score).
- Cash flow +11.0/30.0
- Schools +6.1/10.0
- ARV discount +5.1/15.0
- Livability +3.8/5.0
- DSCR +3.2/10.0
- Rent growth +2.8/5.0
- Condition / age +2.5/5.0
- 1% rule +2.0/10.0
- Appreciation +0.0/10.0
$286,500
🖨 Deal sheet 📄 Offer letter ✓ Due diligence
Listing remarks
Tucked away on a quiet back street of the community, this well-maintained end-unit offers both privacy and convenience. A welcoming open foyer leads into a spacious family room featuring cozy gas logs and serene views of the private backyard. The galley-style kitchen is equipped with full appliances and upgraded 42” cabinetry, providing both functionality and style. Upstairs, you’ll find two versatile loft areas—perfect for a potential third bedroom, home office, or flexible living spaces to suit your needs. Generously sized bedrooms, ample closet space, two full bathrooms, and a dedicated laundry room complete the upper level. Outdoor living is just as inviting with a con
Key facts
- Charming front porch
- Galley-style kitchen
- Private backyard
Tags
Property features AI
Finance
- Other: Private in-ground pool
- HOA & community: Homeowners association (mandatory); HOA rules apply; contact for pet policy
Exterior
- Parking: Attached garage (1 car); Main-level garage
- Utilities: City water; Public sewer; Cable connected; Electricity connected
- Home design: Residential townhouse; Site-built construction; Two levels; Entry level at main floor
- Construction: Brick partial and vinyl exterior; Slab foundation
- Exterior features: Lawn maintenance included; Partial fencing; End unit location; Concrete and paved driveway/roads; Publicly maintained road
Interior
- Kitchen: Dishwasher; Disposal; Electric range; Microwave; Refrigerator
- Bedrooms: 2 bedrooms (both on upper level); Walk-in closet(s) in one bedroom
- Bathrooms: 2 full bathrooms (upper level); 1 half bathroom (main level)
- Heating & cooling: Heat pump heating; Central air conditioning; Ceiling fans
- Interior features: Attic access with pull-down stairs; 8 total rooms; Gas-log fireplace
- Laundry & utility: Laundry room on upper level (inside)
Neighborhood map
What this means for you Summary
Snapshot
- This is a 2-bed/2.5-bath townhouse listed at $286k.
Deal economics
- At list price, monthly cash flow is $-120 ($-1k/yr) — negative.
- To cash-flow at today's rent, offer at most $265k (7.4% below list).
- To meet the 1% rule (rent ≥ 1% of price), the offer needs to be $202k (29.7% below list).
- Recommended offer: $202k (29.7% below list) — sets the bar for 1% rule.
- Cap rate 5.8% vs local median 2.3% in Fort Mill — top-decile yield for the area; either an underpriced asset or a hidden risk that comps aren't pricing in. Stress-test before assuming the spread holds.
Location & tenants
- Location reads 76/100 on livability (#23 in SC, #3,459 nationally) — a middle-class / working-renter tenant base. Strengths: crime A+, employment A+, housing A+; Watch: amenities F, commute F.
- York 04 (suburban): math 65% / reading 71% proficiency, ranked #1 of 80 in SC (top 1%) — acceptable for families but not a draw, mixed tenant base, ~2y average lease; only 15% free/reduced lunch — higher-income household profile.
- Market conditions: Rents rising (+1.0%/yr); 347 active listings in the ZIP; 7 comparable units currently listed for rent nearby; rentals leasing fast (median 3d on market — plan ~1-2 weeks tenant-placement turnaround); solid renter incomes; 2,550 units permitted in York County in 2024 (350 in 5+ unit buildings).
Forward outlook
- Local home prices are declining (-3.0%/yr); year-one equity from $2k of loan paydown is wiped out by about $9k of value loss. Plan a longer hold.
- York County population projected at +44% by 2050 — long-run rental-demand tailwind backs the buy-and-hold thesis.
Negotiation context
- It's been on market 48 days — a 3% lower offer ($278k) is reasonable based on typical stale-listing flexibility.
- Current owner paid $128k; list at $286k implies a 124% gain — meaningful room to come down on a strong offer.
Risks & watch-outs
- Climate carrying-cost: major wind risk, 27% chance of damaging wind over 30y; extreme-heat days projected 7→16/yr by 2055 (HVAC capex compounding) — expect insurance premiums to compound above CPI over the hold.
Questions for the listing agent
- What do current leases actually rent for vs. the listed asking? Can we see a recent rent roll and the last 12 months of T-12 income?
- It's been on market 48 days. Have you received any prior offers? Is the seller open to a 30% concession, seller financing, or rate buy-down credit?
- Is there a deadline driving the sale (1031 exchange, divorce, estate, relocation)? That informs how much negotiation room exists.
- Schools are B-rated — typically a magnet for longer-tenancy family renters. What's the average tenant stay here, and is there a school-zone premium baked into asking?
- The area grade is low — what's the realistic commute time and amenity access for the typical tenant pool here? Any planned neighborhood developments (good or bad) we should know about?
- What's the average days-on-market for RENTAL listings here right now (not sales)? A rising rental-DOM trend means longer vacancies and softer asking-rent achievability than the comps imply.
- What's the recent tenant-quality profile in this submarket — average credit score on applications, eviction rate, late-payment / NSF rate, and stable-employment percentage? A property-management company in the area should have these aggregated.
- How much new for-sale + rental construction is in the pipeline within 1–3 miles? Heavy new supply typically softens prices + rents 12–24 months out; constrained supply supports both.
Investment metrics
- 1% rule
- 0.70% ✗
- Cap rate
- 5.79%
- Cash-on-cash
- -1.80%
- DSCR
- 0.92
- GRM
- 11.8
CMA / ARV
- ARV (on-the-fly)
- $272,000
- Comps found
- 12
Show comp detail 12 sales within ~0.75 mi
| Address | Dist | Beds/Ba | Sqft | Sold | Price | $/sf | Match |
|---|---|---|---|---|---|---|---|
| 461 Delta Dr | 0.18mi | 2/2.5 | 1,600 (0%) | 1mo | $287,000 | $179 | 91 |
| 482 Delta Dr | 0.13mi | 2/2.5 | 1,625 (+2%) | 3mo | $261,000 | $161 | 89 |
| 150 Rapids Rd | 0.14mi | 2/2.5 | 1,584 (-1%) | 3mo | $270,000 | $170 | 89 |
| 480 Delta Dr Unit 6162/480 | 0.14mi | 2/2.5 | 1,589 (-1%) | 7mo | $260,000 | $164 | 87 |
| 218 Tail Race Ln | 0.23mi | 2/2.5 | 1,614 (+1%) | 2mo | $255,000 | $158 | 86 |
| 479 Delta Dr | 0.15mi | 3/2.5 (+1) | 1,635 (+2%) | 1mo | $240,000 | $147 | 84 |
| 628 Fountain Ct | 0.18mi | 3/2.5 (+1) | 1,636 (+2%) | 3mo | $203,500 | $124 | 80 |
| 507 Delta Dr | 0.09mi | 2/2.0 | 1,419 (-11%) | 3mo | $218,000 | $154 | 72 |
| 1003 Silver Springs Rd | 0.02mi | 2/2.5 | 1,370 (-14%) | 9mo | $269,000 | $196 | 68 |
| 126 Rhett Ct | 0.17mi | 3/2.5 (+1) | 1,402 (-12%) | 2mo | $302,500 | $216 | 65 |
| 211 Butler Pl | 0.22mi | 3/2.5 (+1) | 1,412 (-12%) | 3mo | $284,900 | $202 | 63 |
| 463 Delta Dr | 0.18mi | 2/2.5 | 1,370 (-14%) | 10mo | $260,000 | $190 | 59 |
Match score weights: distance 35% · size 25% · config 20% · recency 20%. Top-matched comps best support the ARV.
Projected returns pro-forma
-3.0% appreciation · 1.0% rent growth · sell at horizon
- IRR
- -21.3%
- Equity multiple
- 0.27×
- Total profit
- $-58,190
- Equity at exit
- $42,718
- IRR
- -19.5%
- Equity multiple
- 0.04×
- Total profit
- $-76,747
- Equity at exit
- $24,771
Cash invested: $80,220 (down + closing). Projections, not guarantees.
Landlord ↔ Tenant lean methodology
- Overall (STATE)
- 90 Strongly Landlord-Friendly
- State South Carolina
- 90 Strongly Landlord-Friendly · R+6
- County
- — inherits STATE
- City
- — inherits STATE
ZIP-level market 29715
- Rents YoY
- 1.0%
- Active inventory
- 347
- Price-to-rent
- 11.8×
Monthly cashflow live
- Estimated rent
- $2,015 high interval (Pro) →
- Mortgage (P&I)
- −$1,502
- Tax from tax record
- −$90 /mo · $1,085/yr
- Insurance
- −$119
- HOA
- −$0
- Vacancy / Maint / Mgmt
- −$423
- Net cashflow
- $-120
Break-even live
UW: 25.0% down · 7.5% · 30yr · 1.5% tax · 5.0% vac · 8.0% maint · 8.0% mgmt
Financing live
Cash to close
- Down payment
- $71,625
- Closing costs
- $8,595
- Reserves months
- —
- Total cash needed
- —
Loan-product check · same deal, 3 products live
Conventional
25% down · 7.5% · 30yr
- Down + closing
- —
- Monthly P&I
- —
- Monthly cashflow
- —
- DSCR
- —
- Eligible?
- —
Personal DTI + credit; lowest rate.
DSCR
20% down · 8.5% · 30yr
- Down + closing
- —
- Monthly P&I
- —
- Monthly cashflow
- —
- DSCR
- —
- Eligible?
- —
No personal income docs; deal must DSCR.
Hard money
10% down · 12.0% · 12mo
- Down + closing
- —
- Monthly P&I
- —
- Monthly cashflow
- —
- DSCR
- —
- Eligible?
- —
Short-term bridge; refi at stabilization.
Rent comps 7 comps
| Address | Beds | Baths | Sqft | Rent | $/sqft | DOM | Units | Dist |
|---|---|---|---|---|---|---|---|---|
| 224 Butler Pl Fort Mill, SC | 3.0 | 2.5 | 1348 | $1,995 | $1.48 | 1d | 1 | 0.20mi |
| 232 Butler Pl Fort Mill, SC | 2.0 | 2.5 | 1344 | $1,950 | $1.45 | 10d | 1 | 0.22mi |
| 1065 Traditions Dr Fort Mill, SC | 1.0–2.0 | 1.0–2.0 | 1088 | $2,415 | $2.22 | 1d | 7 | 0.33mi |
| 1481 Turkey Roost Rd Fort Mill, SC | 3.0 | 2.5 | 2100 | $2,700 | $1.29 | 1d | 1 | 1.03mi |
| 1104 Drayton Ct Fort Mill, SC | 3.0 | 3.5 | 1872 | $2,950 | $1.58 | 2d | 1 | 1.31mi |
| 905 Lyndley Dr Fort Mill, SC | 3.0 | 3.5 | 1834 | $2,995 | $1.63 | 10d | 1 | 1.39mi |
| 1 Peach Ln Fort Mill, SC | 3.0 | 3.0 | 1350 | $2,075 | $1.54 | 4d | 1 | 1.41mi |
Listing history 19 events
-
2026-06-18days on market $286,500 Active 48 DOM
-
2026-06-17days on market $286,500 Active 47 DOM
-
2026-06-16days on market $286,500 Active 46 DOM
-
2026-06-15days on market $286,500 Active 45 DOM
-
2026-06-13days on market $286,500 Active 43 DOM
-
2026-06-13days on market $286,500 Active 42 DOM
-
2026-06-09days on market $286,500 Active 39 DOM
-
2026-06-08days on market $286,500 Active 38 DOM
-
2026-06-07days on market $286,500 Active 37 DOM
-
2026-06-04days on market $286,500 Active 34 DOM
-
2026-06-03days on market $286,500 Active 33 DOM
-
2026-06-02days on market $286,500 Active 32 DOM
-
2026-06-01days on market $286,500 Active 31 DOM
-
2026-05-31days on market $286,500 Active 30 DOM
-
2026-05-18price $286,500
-
2026-05-01$294,000 Active
-
2014-06-23soldstatus $128,000
-
2007-09-27soldstatus $137,000
-
2004-02-20soldstatus $1,459,740
ⓘ Source: listings_history table (triggers on properties + properties_extension) + one-shot
backfill from property_details.listing_events for pre-trigger history.
Tax reassessment forecast SC · Resets to sale price
- Current annual tax
- $1,085 · $90/mo
- Projected year-2 tax
- $1,633 · $136/mo
- Expected delta
- +$548/yr (+$46/mo · 50.6%)
ⓘ Screening estimate from a state-policy table — verify with the county assessor before closing.
Climate risk First Street
- Flood 1/10 Low FEMA zone X (unshaded) · 0% chance over 30 yrs
- Wildfire 3/10 Moderate
- Heat 6/10 Major 7 d/yr ≥105°F today · 16 d/yr by 30 yrs out
- Wind 6/10 Major 27% chance of damaging wind over 30 yrs
- Air quality 3/10 Moderate 3 unhealthy d/yr today · 3 by 30 yrs out
Nearby sold comps map
Loading sold comps map…
Walkable amenities ~0.75 mi
Loading nearby amenities…
Taxation est. · year 1
- Rental income
- $24,182
- − Mortgage interest
- −$16,048
- − Property taxes
- −$1,085
- − Insurance
- −$1,432
- − Repairs & maintenance
- −$1,935
- − Management
- −$1,935
- − Depreciation
- −$8,335
- Taxable loss
- −$6,587
- Est. tax savings @ 24.0%
- +$1,581
- After-tax cash flow
- $139/yr
For passive investors: Depreciation is non-cash, so a rental often shows a tax loss while cash-flowing — sheltering income. Rental losses are passive: they offset passive income freely, and up to $25,000/yr can offset ordinary (W-2) income if you actively participate and your MAGI is under $100k (phasing out to $0 by $150k); unused losses carry forward. On sale, claimed depreciation is recaptured at up to 25%, and gains may owe capital-gains tax (a 1031 exchange can defer both). Figures are a year-1 estimate at your 24.0% rate — not tax advice; consult a CPA.
Schools (NCES district)
- District
- York 04
- NCES district ID
- 4503900
- Math proficiency
- 65% ▼ -9.00%
- Reading proficiency
- 71% ▬ 0.00%
- Median HH income
- $79,981
- Composite
- 60.56/100
- National rank
- #835
- State rank
- #1 of 80 in SC
Livability — Fort Mill
- Score
- 76/100
- State rank
- #23
- US rank
- #3459
Category grades
Schools grade is shown separately in the Schools card above.
Census & demographics
- Census place
- Fort Mill, SC
- County
- York County · 281,758 people
- City population
- 128,009
- Metro
- Charlotte-Concord-Gastonia, NC-SC
- Population (ZIP)
- 46,865
- Household income
- $109,689
- Rent vs Own
- Severe rent burden
- 680.0
Population outlook (York County) Hauer SSP2
- Today (2025)
- 307,757 people
- By 2030
- 335,979 · +9.2%
- By 2040
- 391,378 · +27.2%
- By 2050
- 443,234 · +44.0%
- By 2075
- 557,102 · +81.0%
- By 2100
- 625,837 · +103.4%
Race, ethnicity, and origin ACS 2023
- Neighborhood character
- Predominantly White (69%)
- Race & ethnicity
- White 69% Black 11% Hispanic / Latino 10% Two or more races 9% Asian 4%
- Hispanic origin (detail)
- Mexican 4%
- Common ancestry
- Serbian 4% Slovak 3% Romanian 3%
- Foreign-born
- 9% · Canada, China, Jamaica
- Languages at home
- 87% English-only · Spanish 7% Other Indo-European 2% Other Asian/Pacific 2%
Political lean MEDSL · York
- 2024 margin
- R (+19.1) · D 39.7% · R 58.8% · Other 1.5%
- 2008→2024 swing
- -1.4pp toward R · 2008: -17.7pp · 2024: -19.1pp
- All cycles
- 2024: R+19.1 2020: R+16.5 2016: R+22.1 2012: R+20.5 2008: R+17.7
Not yet ingested
- Civics
- —
Market trends
- HPI YoY
- ▼ -161.26%
- Current HPI
- 261.4136
- Rent YoY
- ▲ 1.00%
- Metro
- Charlotte-Concord-Gastonia, NC-SC
- State GDP YoY
- ▲ 4.51%
- F500 in state
- 2
Industry mix (Fortune 500 HQ in SC)
| Industry | F500 HQs | Revenue |
|---|---|---|
| Packaging | 1 | $7B |
|
||
Price history
-80.4% since first listed5 events — show timeline
- 2026-05-18 Price Changed $286,500 CANOPYMLS as Distributed by MLS Grid
- 2026-05-01 Listed $294,000 CANOPYMLS as Distributed by MLS Grid
- 2014-06-23 Sold (Public Records) $128,000 Public Records
- 2007-09-27 Sold (Public Records) $137,000 Public Records
- 2004-02-20 Sold (Public Records) $1,459,740 Public Records
Property tax history
+0.1%/yrLatest (2025): $1,085 · +20.7% YoY. Source: county tax records.
Cash-flow waterfall
monthlySold comps — $/sqft
last 12 mo · ≤1 miLoading sold comps…