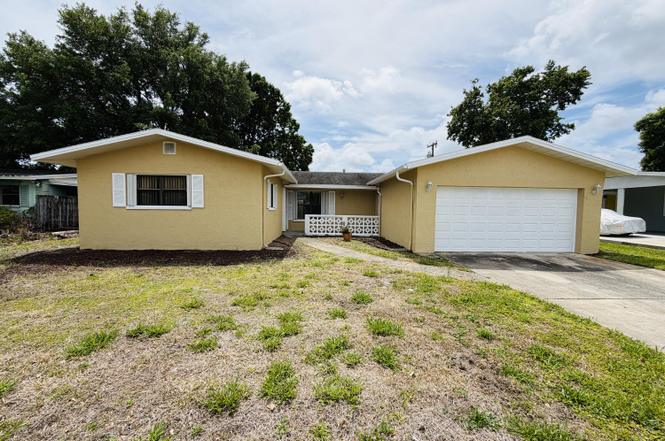
981 Palmer St · Rockledge, FL
Flood risk 6/10 · Moderate
- FEMA flood zone
- X (unshaded)
- Chance of flooding over 30 yrs
- 0.68%
- Est. flood insurance / yr
- $507 – $1,088
Fire risk 4/10 · Minor
- Est. fire insurance / yr
- $947 – $1,759
Heat risk 10/10 · Severe
- Hot days now (above 106°F)
- 7 days/yr
- Hot days in 30 yrs
- 22 days/yr
Wind risk 10/10 · Severe
- Chance of severe wind over 30 yrs
- 99.0%
Air-quality risk 1/10 · Minimal
- Unhealthy air days now
- 0 days/yr
- Unhealthy air days in 30 yrs
- 0 days/yr
Risk factors via First Street. Map © Google.
Why this score? — see what drove the D grade
The composite is a weighted blend of 9 inputs, each scored 0–100. Each bar is that input's sub-score; the figure is the points it added to the 100-point composite (weight × sub-score).
- Cash flow +14.2/30.0
- ARV discount +7.5/15.0
- Schools +4.7/10.0
- DSCR +4.3/10.0
- Livability +4.0/5.0
- 1% rule +3.7/10.0
- Rent growth +2.5/5.0
- Condition / age +2.5/5.0
- Appreciation +0.0/10.0
$285,000
🖨 Deal sheet (PDF) 📄 Offer letter ✓ Due diligence
Listing remarks MLS
Welcome to this spacious 4-bedroom, 2-bath home in the heart of Rockledge. Featuring a desirable split floor plan, this home offers comfortable living with a versatile bonus room--perfect for a home office, playroom, or additional living space. Enjoy the convenience of a 2-car garage and a quiet, well-maintained neighborhood. With ample space for relaxing and entertaining, this home is ready for immediate move in! Washer and dryer included.
Key facts
- Split floor plan
- Bonus room
- Quiet neighborhood
Tags
Property features AI
Finance
- Other: Pets allowed; Unfurnished
Exterior
- Parking: Attached garage with 2 spaces
- Utilities: Public sewer; Cable connected; Electricity connected; Sewer connected
- Home design: Single family residence; One story; Entry on level 1; North-facing
- Construction: Concrete and stucco construction; Shingle roof
- Exterior features: Storm shutters; Back yard fencing; Many trees on lot; Asphalt city street frontage
Interior
- Kitchen: Dishwasher; Electric range; Refrigerator
- Bedrooms: 4 bedrooms (all on main level)
- Flooring: Tile
- Bathrooms: 2 full bathrooms
- Heating & cooling: Central heating (electric); Central air conditioning (electric)
- Interior features: Ceiling fans; Split bedroom floor plan
- Laundry & utility: Washer and dryer in unit (lower level)
Neighborhood map
What this means for you Summary
Snapshot
- This is a 4-bed/2.0-bath single-family listed at $285k.
Deal economics
- At list price, monthly cash flow is $46 ($553/yr) — positive.
- The deal already cash-flows at list — no discount required.
- To meet the 1% rule (rent ≥ 1% of price), the offer needs to be $247k (13.2% below list).
- Recommended offer: $247k (13.2% below list) — sets the bar for 1% rule.
Location & tenants
- Location reads 81/100 on livability (#81 in FL, #1,315 nationally) — a professional / high-income tenant draw. Strengths: housing A+, health & safety A, commute A-; Watch: amenities F.
- Brevard (suburban): math 53% / reading 57% proficiency, ranked #19 of 73 in FL (top 26%) — acceptable for families but not a draw, mixed tenant base, ~2y average lease.
- Zoned schools: Golfview Elementary Magnet School (math 32% / reading 36%, grade F, #1,744 of 2,144 statewide, top 82%, 441 students, 74% FRL); Ronald Mcnair Magnet Middle School (math 58% / reading 50%, grade B-, #196 of 571 statewide, top 36%, 364 students, 58% FRL); Rockledge Senior High School (math 27% / reading 49%, grade F, #328 of 667 statewide, top 50%, 1,558 students, 50% FRL) — zoned schools average 61% FRL vs 43% district-wide (18 pts higher); higher-poverty schools than district average — tighter screening recommended.
- Zoned-school proficiency averages 42% at this address vs 55% district-wide (-13 pts) — the specific schools serving this property underperform the Brevard average; the district grade overstates school quality for this exact location.
- Market conditions: Rents flat; 321 active listings in the ZIP; 9 comparable units currently listed for rent nearby; rentals at typical pace (median 16d on market — plan ~3-4 weeks tenant-placement turnaround); solid renter incomes; 4,602 units permitted in Brevard County in 2024 (702 in 5+ unit buildings).
- This rent runs 34% of the median local income ($86k/yr) — at the standard rent-burdened threshold; future hikes will face affordability resistance.
Forward outlook
- Local home prices are declining (-3.0%/yr); year-one equity from $2k of loan paydown is wiped out by about $9k of value loss. Plan a longer hold.
- Brevard County population projected at +15% by 2050 — modest demand growth; plan on rents tracking national, not racing it.
Negotiation context
- Only 7 days on market — expect competitive offers; lowballing is unlikely to land.
- 5 sale attempts; this cycle's ask is 13156% above the opening price — seller raised mid-cycle; expect resistance to lowballs.
- Current owner paid $220k; 30% above their basis — modest negotiation headroom, anchor on the comps not their cost.
Risks & watch-outs
- Climate carrying-cost: major flood risk; severe wind risk, 99% chance of damaging wind over 30y; extreme-heat days projected 7→22/yr by 2055 (HVAC capex compounding) — expect insurance premiums to compound above CPI over the hold.
Questions for the listing agent
- Built in 1963 — when were the roof, HVAC, electrical panel, plumbing, and water heater last replaced?
- Is there a deadline driving the sale (1031 exchange, divorce, estate, relocation)? That informs how much negotiation room exists.
- Schools are B-rated — typically a magnet for longer-tenancy family renters. What's the average tenant stay here, and is there a school-zone premium baked into asking?
- The area grade is low — what's the realistic commute time and amenity access for the typical tenant pool here? Any planned neighborhood developments (good or bad) we should know about?
- What's the average days-on-market for RENTAL listings here right now (not sales)? A rising rental-DOM trend means longer vacancies and softer asking-rent achievability than the comps imply.
- What's the recent tenant-quality profile in this submarket — average credit score on applications, eviction rate, late-payment / NSF rate, and stable-employment percentage? A property-management company in the area should have these aggregated.
- How much new for-sale + rental construction is in the pipeline within 1–3 miles? Heavy new supply typically softens prices + rents 12–24 months out; constrained supply supports both.
Investment metrics
- 1% rule
- 0.87% ✗
- Cap rate
- 6.49%
- Cash-on-cash
- 0.69%
- DSCR
- 1.03
- GRM
- 9.6
CMA / ARV
No comps found within radius.
Projected returns pro-forma
-3.0% appreciation · 0.12% rent growth · sell at horizon
- IRR
- -18.4%
- Equity multiple
- 0.37×
- Total profit
- $-50,215
- Equity at exit
- $42,494
- IRR
- -17.5%
- Equity multiple
- 0.16×
- Total profit
- $-66,944
- Equity at exit
- $24,642
Cash invested: $79,800 (down + closing). Projections, not guarantees.
Landlord ↔ Tenant lean methodology
- Overall (STATE)
- 87 Strongly Landlord-Friendly
- State Florida
- 87 Strongly Landlord-Friendly · R+3
- County
- — inherits STATE
- City
- — inherits STATE
ZIP-level market 32955
- Home prices YoY
- -20.7%
- Rents YoY
- 0.1%
- Active inventory
- 321
- Price-to-rent
- 9.6×
Monthly cashflow live
- Estimated rent
- $2,474 high interval (Pro) →
- Mortgage (P&I)
- −$1,495
- Tax from tax record
- −$295 /mo · $3,544/yr
- Insurance
- −$119
- HOA
- −$0
- Vacancy / Maint / Mgmt
- −$520
- Net cashflow
- $46
Break-even live
Sensitivity live
| Price | -10% $207 | -5% $127 | +0% $46 | +5% $-35 | +10% $-115 |
|---|---|---|---|---|---|
| Rent | -10% $-149 | -5% $-52 | +0% $46 | +5% $144 | +10% $242 |
| Rate | -1.0pp $190 | -0.5pp $119 | base $46 | +0.5pp $-28 | +1.0pp $-103 |
UW: 25.0% down · 7.5% · 30yr · 1.5% tax · 5.0% vac · 8.0% maint · 8.0% mgmt
Financing live
Cash to close
- Down payment
- $71,250
- Closing costs
- $8,550
- Reserves months
- —
- Total cash needed
- —
Loan-product check · same deal, 3 products live
Conventional
25% down · 7.5% · 30yr
- Down + closing
- —
- Monthly P&I
- —
- Monthly cashflow
- —
- DSCR
- —
- Eligible?
- —
Personal DTI + credit; lowest rate.
DSCR
20% down · 8.5% · 30yr
- Down + closing
- —
- Monthly P&I
- —
- Monthly cashflow
- —
- DSCR
- —
- Eligible?
- —
No personal income docs; deal must DSCR.
Hard money
10% down · 12.0% · 12mo
- Down + closing
- —
- Monthly P&I
- —
- Monthly cashflow
- —
- DSCR
- —
- Eligible?
- —
Short-term bridge; refi at stabilization.
Rent comps 9 comps
| Address | Beds | Baths | Sqft | Rent | $/sqft | DOM | Units | Dist |
|---|---|---|---|---|---|---|---|---|
| 944 Kentucky Ave Rockledge, FL | 3.0 | 2.0 | 1236 | $1,945 | $1.57 | 21d | 1 | 0.71mi |
| 1147 Manatee Dr Rockledge, FL | 3.0 | 2.0 | 1810 | $2,095 | $1.16 | 21d | 1 | 0.73mi |
| 256 Barton Blvd Rockledge, FL | 3.0 | 1.0–2.0 | 1012 | $2,115 | $2.09 | 16d | 23 | 0.79mi |
| 1105 Santa Rosa Dr Rockledge, FL | 3.0 | 2.0 | 1096 | $2,000 | $1.82 | 25d | 1 | 0.80mi |
| 1600 Woodland Dr Unit 1 Rockledge, FL | 3.0 | 2.0 | 1426 | $1,995 | $1.40 | 16d | 1 | 0.85mi |
| 1001 Cascade Cir Rockledge, FL | 2.0–3.0 | 2.0 | 1274 | $2,065 | $1.62 | 16d | 6 | 0.92mi |
| 295 Royal Tern CIR Rockledge, FL | 1.0–3.0 | 1.0–2.0 | 1020 | $2,467 | $2.42 | 16d | 33 | 1.13mi |
| 1607 Amalfi Dr Cocoa, FL | 3.0–4.0 | 2.0 | 1750 | $2,619 | $1.50 | 15d | 5 | 1.31mi |
| 102 Riverside Dr #806 Cocoa, FL | 3.0 | 3.0 | 2019 | $3,500 | $1.73 | 25d | 1 | 1.48mi |
Listing history 6 events
-
2026-06-22days on market $285,000 Active 7 DOM
-
2026-06-18days on market $285,000 Active 4 DOM
-
2026-06-17days on market $285,000 Active 3 DOM
-
2026-06-16days on market $285,000 Active 2 DOM
-
2026-06-15remarks 445-char remark
-
2026-06-15$285,000 Active 1 DOM
ⓘ Source: listings_history table (triggers on properties + properties_extension) + one-shot
backfill from property_details.listing_events for pre-trigger history.
Tax reassessment forecast FL · Resets to sale price
- Current annual tax
- $3,544 · $295/mo
- Projected year-2 tax
- $3,544 · $295/mo
- Expected delta
- $0/yr ($0/mo · 0.0%)
ⓘ Screening estimate from a state-policy table — verify with the county assessor before closing.
Climate risk First Street
- Flood 6/10 Major FEMA zone X (unshaded) · 68% chance over 30 yrs
- Wildfire 4/10 Moderate
- Heat 10/10 Extreme 7 d/yr ≥106°F today · 22 d/yr by 30 yrs out
- Wind 10/10 Extreme 99% chance of damaging wind over 30 yrs
- Air quality 1/10 Low 0 unhealthy d/yr today · 0 by 30 yrs out
Nearby sold comps map
Loading sold comps map…
Walkable amenities ~0.75 mi
Loading nearby amenities…
Taxation est. · year 1
- Rental income
- $29,693
- − Mortgage interest
- −$15,964
- − Property taxes
- −$3,544
- − Insurance
- −$1,425
- − Repairs & maintenance
- −$2,375
- − Management
- −$2,375
- − Depreciation
- −$8,291
- Taxable loss
- −$4,282
- Est. tax savings @ 24.0%
- +$1,028
- After-tax cash flow
- $1,581/yr
For passive investors: Depreciation is non-cash, so a rental often shows a tax loss while cash-flowing — sheltering income. Rental losses are passive: they offset passive income freely, and up to $25,000/yr can offset ordinary (W-2) income if you actively participate and your MAGI is under $100k (phasing out to $0 by $150k); unused losses carry forward. On sale, claimed depreciation is recaptured at up to 25%, and gains may owe capital-gains tax (a 1031 exchange can defer both). Figures are a year-1 estimate at your 24.0% rate — not tax advice; consult a CPA.
Schools (NCES district)
- District
- Brevard
- NCES district ID
- 1200150
- Math proficiency
- 53% ▼ -9.00%
- Reading proficiency
- 57% ▼ -4.00%
- Median HH income
- $49,426
- Composite
- 46.86/100
- National rank
- #2370
- State rank
- #19 of 73 in FL
Livability — Rockledge
- Score
- 81/100
- State rank
- #81
- US rank
- #1315
Category grades
Schools grade is shown separately in the Schools card above.
Census & demographics
- Census place
- Rockledge, FL
- County
- Brevard County · 602,871 people
- City population
- 41,008
- Metro
- Palm Bay-Melbourne-Titusville, FL
- Population (ZIP)
- 41,008
- Household income
- $86,457
- Rent vs Own
- Severe rent burden
- 1273.0
Population outlook (Brevard County) Hauer SSP2
- Today (2025)
- 623,254 people
- By 2030
- 648,420 · +4.0%
- By 2040
- 690,009 · +10.7%
- By 2050
- 715,669 · +14.8%
- By 2075
- 775,744 · +24.5%
- By 2100
- 776,687 · +24.6%
Race, ethnicity, and origin ACS 2023
- Neighborhood character
- Predominantly White (69%)
- Race & ethnicity
- White 69% Black 14% Hispanic / Latino 9% Two or more races 8% Asian 2%
- Hispanic origin (detail)
- Mexican 1% Puerto Rican 3%
- Common ancestry
- Slovak 3% Romanian 2% Serbian 2%
- Foreign-born
- 7% · Canada, Jamaica, Mexico
- Languages at home
- 91% English-only · Spanish 5% Other Indo-European 2%
Political lean MEDSL · Brevard
- 2024 margin
- Strong R (+20.8) · D 39.1% · R 59.9% · Other 1.0%
- 2008→2024 swing
- -10.4pp toward R · 2008: -10.4pp · 2024: -20.8pp
- All cycles
- 2024: R+20.8 2020: R+16.4 2016: R+19.8 2012: R+12.7 2008: R+10.4
Not yet ingested
- Civics
- —
Market trends
- HPI YoY
- ▼ -81.70%
- Current HPI
- 312.7435
- Rent YoY
- ▲ 0.12%
- Metro
- Palm Bay-Melbourne-Titusville, FL
- State GDP YoY
- ▲ 3.28%
- F500 in state
- 36
Industry mix (Fortune 500 HQ in FL)
| Industry | F500 HQs | Revenue |
|---|---|---|
| Industrial Technology | 2 | $29B |
|
||
| Insurance | 2 | $17B |
|
||
| Retail | 1 | $60B |
|
||
| Technology Distribution | 1 | $58B |
|
||
| Homebuilding | 1 | $35B |
|
||
| Technology Manufacturing | 1 | $35B |
|
||
Price history
-86.8% since first listed15 events — show timeline
- 2026-06-15 Listed for Rent $2,150 SCMLS
- 2026-06-14 Listed $285,000 SCMLS
- 2026-04-30 Rental Removed $2,100 SCMLS
- 2026-04-29 Listing Removed — SCMLS
- 2026-04-01 Listed for Rent $2,100 SCMLS
- 2026-03-31 Listed $320,000 SCMLS
- 2026-03-25 Sold (Public Records) $220,000 Public Records
- 2026-03-23 Sold (MLS) $220,000 SCMLS
- 2026-03-05 Pending — SCMLS
- 2026-02-28 Price Changed $224,999 SCMLS
- 2026-01-16 Price Changed $299,000 SCMLS
- 2025-12-15 Listed $305,000 SCMLS
- 1984-05-01 Sold (Public Records) $62,900 Public Records
- 1980-10-01 Sold (Public Records) $47,500 Public Records
- 1964-02-01 Sold (Public Records) $16,300 Public Records
Property tax history
+8.0%/yrLatest (2025): $3,544 · +3.7% YoY. Source: county tax records.
Cash-flow waterfall
monthlySold comps — $/sqft
last 12 mo · ≤1 miLoading sold comps…