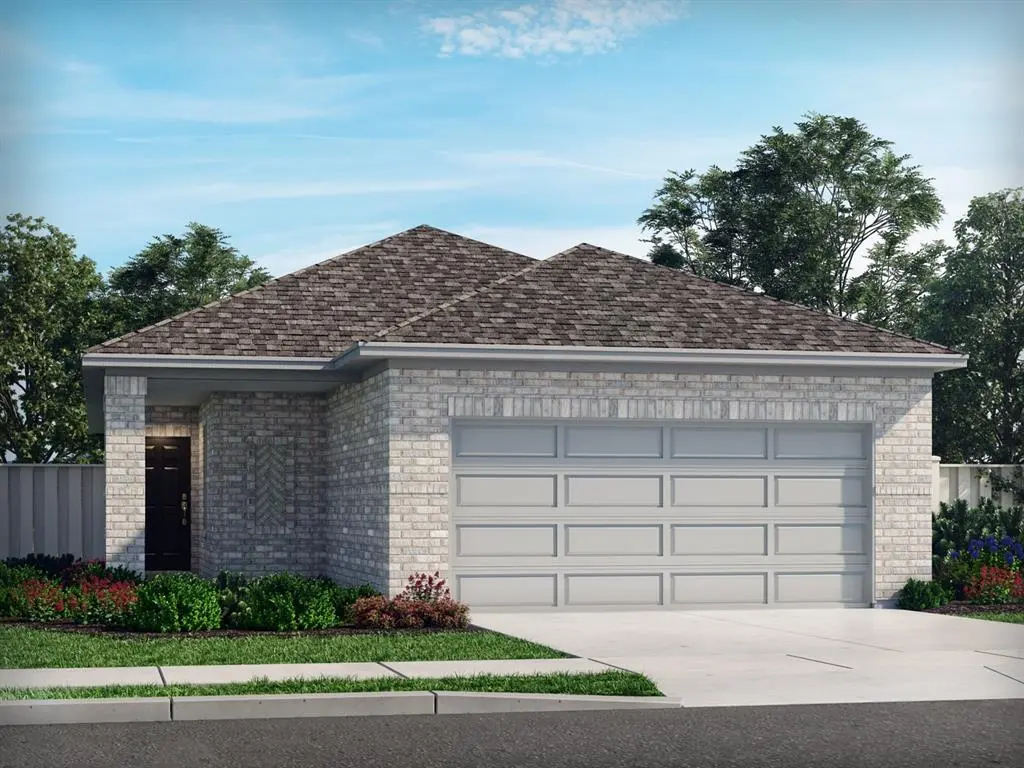
6006 Alderton Dr · Princeton, TX
Flood risk 1/10 · Minimal
- FEMA flood zone
- X (unshaded)
- Chance of flooding over 30 yrs
- 0.0%
- Est. flood insurance / yr
- $507 – $1,088
Fire risk 3/10 · Minor
- Est. fire insurance / yr
- $1,222 – $2,270
Heat risk 7/10 · Major
- Hot days now (above 110°F)
- 6 days/yr
- Hot days in 30 yrs
- 19 days/yr
Wind risk 6/10 · Moderate
- Chance of severe wind over 30 yrs
- 27.0%
Air-quality risk 3/10 · Minor
- Unhealthy air days now
- 3 days/yr
- Unhealthy air days in 30 yrs
- 3 days/yr
Risk factors via First Street. Map © Google.
Why this score? — see what drove the D grade
The composite is a weighted blend of 9 inputs, each scored 0–100. Each bar is that input's sub-score; the figure is the points it added to the 100-point composite (weight × sub-score).
- Cash flow +11.3/30.0
- ARV discount +7.2/15.0
- Schools +5.0/10.0
- Condition / age +5.0/5.0
- 1% rule +3.6/10.0
- DSCR +3.3/10.0
- Livability +3.1/5.0
- Rent growth +2.0/5.0
- Appreciation +0.0/10.0
$277,517
🖨 Deal sheet 📄 Offer letter ✓ Due diligence
Listing remarks
BRAND NEW energy - efficient home Jul 2026! Enjoy family dinners around the kitchen island in the Sequoia's convenient eat-in kitchen. White cabinets with veined white quartz countertops, tan tone EVP flooring and light grey brown textured carpet. Spend the weekends debating what activity to do in this amenity-filled community, make a splash in the resort-style pool, pick up a game of basketball, or let the kids loose on the playground. With quick access to US 380, residents will enjoy the benefits of a short commute to downtown McKinney, Frisco, or Richardson to enjoy nearby shopping and entertainment. Each of our homes is built with innovative, energy-efficient features designed to help y
Key facts
- Resort style pool
- Kitchen island
- 4,792 sq ft lot
Tags
Property features AI
Finance
- Other: Property type: Residential (single family); No livestock or mobile homes allowed; Not in a municipal utility district; Subdivision: Eastridge; Directions: East on 380, north on New Hope Rd E, right on Thistle Creek Trail, left on Water Town Drive
- Financial info: Acceptable financing: Cash, Conventional, FHA, VA
- HOA & community: Mandatory association; Annual association fee of $780; Association fees cover full use of facilities, grounds maintenance and management fees; HOA managed by Neighborhood Management, Inc.
Exterior
- Parking: Attached 2-car garage with single 2-car door; 2 covered parking spaces
- Utilities: City water; City sewer; Individual gas meter; Individual water meter; Underground utilities; Sidewalks, curbs and concrete; Low-flow fixtures for water conservation
- Home design: Single family residence; One story; New construction (incomplete)
- Construction: Built in 2026; Construction materials include brick, concrete, rock/stone and wood; Slab foundation; Composition roof
- Exterior features: Fencing: brick, rock/stone and wood; Community amenities include clubhouse, community pool, jogging/bike path, park and playground
Interior
- Kitchen: Dishwasher; Disposal; Electric oven; Gas cooktop; Microwave; Plumbed for gas in kitchen; Vented exhaust fan; Tankless water heater
- Bedrooms: Primary bedroom on level 1 (approx. 13 x 14); Second bedroom on level 1 (approx. 11 x 11); Third bedroom on level 1 (approx. 11 x 11)
- Flooring: Carpet; Ceramic tile; Luxury vinyl plank
- Bathrooms: Two full bathrooms
- Heating & cooling: Central heating (electric); ENERGY STAR qualified equipment; Zoned heating/cooling; Ceiling fans; Electric cooling
- Interior features: Cable TV available; Decorative lighting; High-speed internet available; Smart home system; Seven total rooms; One living area
- Laundry & utility: Laundry room on level 1 (approx. 7 x 8)
Neighborhood map
What this means for you Summary
Snapshot
- This is a 3-bed/2.0-bath single-family listed at $278k. Condition is rated excellent.
Deal economics
- At list price, monthly cash flow is $-102 ($-1k/yr) — negative.
- To cash-flow at today's rent, offer at most $263k (5.3% below list).
- To meet the 1% rule (rent ≥ 1% of price), the offer needs to be $238k (14.2% below list).
- Recommended offer: $238k (14.2% below list) — sets the bar for 1% rule.
- Cap rate 5.9% vs local median 4.5% in Princeton — top-decile yield for the area; either an underpriced asset or a hidden risk that comps aren't pricing in. Stress-test before assuming the spread holds.
Location & tenants
- Location reads 62/100 on livability (#969 in TX) — a middle-class / working-renter tenant base. Strengths: employment A+, housing A+, cost of living A; Watch: amenities F, commute F, health & safety F.
- Mckinney ISD (suburban): math 54% / reading 58% proficiency, ranked #72 of 826 in TX (top 9%) — acceptable for families but not a draw, mixed tenant base, ~2y average lease.
- Zoned schools: Webb El (math 32% / reading 37%, grade F, #1,995 of 4,322 statewide, top 50%, 355 students, 68% FRL) — zoned schools average 68% FRL vs 28% district-wide (40 pts higher); higher-poverty schools than district average — tighter screening recommended.
- Zoned-school proficiency averages 34% at this address vs 56% district-wide (-22 pts) — the specific schools serving this property underperform the Mckinney ISD average; the district grade overstates school quality for this exact location.
- Market conditions: Rents soft (-2.1%/yr); 2125 active listings in the ZIP; 22 comparable units currently listed for rent nearby; rentals at typical pace (median 19d on market — plan ~3-4 weeks tenant-placement turnaround); high-income renter base; 19,194 units permitted in Collin County in 2024 (3,988 in 5+ unit buildings).
Forward outlook
- Local home prices are declining (-3.0%/yr); year-one equity from $2k of loan paydown is wiped out by about $8k of value loss. Plan a longer hold.
- Collin County population projected at +60% by 2050 — long-run rental-demand tailwind backs the buy-and-hold thesis.
Negotiation context
- It's been on market 27 days — a 2% lower offer ($273k) is reasonable based on typical stale-listing flexibility.
Risks & watch-outs
- Climate carrying-cost: major wind risk, 27% chance of damaging wind over 30y; extreme-heat days projected 6→19/yr by 2055 (HVAC capex compounding) — expect insurance premiums to compound above CPI over the hold.
Questions for the listing agent
- What do current leases actually rent for vs. the listed asking? Can we see a recent rent roll and the last 12 months of T-12 income?
- What does the HOA fee cover, when was the last increase, and are there any pending special assessments or reserve-fund shortfalls?
- Is there a deadline driving the sale (1031 exchange, divorce, estate, relocation)? That informs how much negotiation room exists.
- The area grade is low — what's the realistic commute time and amenity access for the typical tenant pool here? Any planned neighborhood developments (good or bad) we should know about?
- What's the average days-on-market for RENTAL listings here right now (not sales)? A rising rental-DOM trend means longer vacancies and softer asking-rent achievability than the comps imply.
- What's the recent tenant-quality profile in this submarket — average credit score on applications, eviction rate, late-payment / NSF rate, and stable-employment percentage? A property-management company in the area should have these aggregated.
- How much new for-sale + rental construction is in the pipeline within 1–3 miles? Heavy new supply typically softens prices + rents 12–24 months out; constrained supply supports both.
Investment metrics
- 1% rule
- 0.86% ✗
- Cap rate
- 5.85%
- Cash-on-cash
- -1.57%
- DSCR
- 0.93
- GRM
- 9.7
CMA / ARV
- ARV (on-the-fly)
- $275,462
- Comps found
- 12
Show comp detail 12 sales within ~0.75 mi
| Address | Dist | Beds/Ba | Sqft | Sold | Price | $/sf | Match |
|---|---|---|---|---|---|---|---|
| 715 Dotty Dr | 0.06mi | 3/2.0 | 1,318 (0%) | 2mo | $276,097 | $209 | 95 |
| 803 Dotty Dr | 0.05mi | 3/2.0 | 1,318 (0%) | 3mo | $275,736 | $209 | 95 |
| 707 Dotty Dr | 0.07mi | 3/2.0 | 1,318 (0%) | 3mo | $277,257 | $210 | 94 |
| 1130 Old Stead Dr | 0.13mi | 3/2.0 | 1,318 (0%) | 0mo | $285,397 | $217 | 94 |
| 6004 Belchamp Dr | 0.16mi | 3/2.0 | 1,318 (0%) | 1mo | $281,257 | $213 | 92 |
| 1213 Bridgewalk Dr | 0.19mi | 3/2.0 | 1,318 (0%) | 2mo | $280,357 | $213 | 90 |
| 520 Towerglen Dr | 0.57mi | 3/2.0 | 1,335 (+1%) | 1mo | $269,990 | $202 | 70 |
| 804 Hadley Dr | 0.56mi | 3/2.0 | 1,395 (+6%) | 3mo | $279,990 | $201 | 62 |
| 603 Green Grass Dr | 0.55mi | 3/2.0 | 1,504 (+14%) | 2mo | $279,990 | $186 | 50 |
| 516 Towerglen Dr | 0.57mi | 3/2.0 | 1,504 (+14%) | 1mo | $277,490 | $185 | 49 |
| 506 Towerglen Dr | 0.59mi | 3/2.0 | 1,503 (+14%) | 2mo | $279,990 | $186 | 48 |
| 513 Towerglen Dr | 0.60mi | 3/2.0 | 1,504 (+14%) | 1mo | $274,990 | $183 | 47 |
Match score weights: distance 35% · size 25% · config 20% · recency 20%. Top-matched comps best support the ARV.
Projected returns pro-forma
-3.0% appreciation · 0.0% rent growth · sell at horizon
- IRR
- -22.4%
- Equity multiple
- 0.25×
- Total profit
- $-58,364
- Equity at exit
- $41,379
- IRR
- -27.1%
- Equity multiple
- -0.10×
- Total profit
- $-85,840
- Equity at exit
- $23,995
Cash invested: $77,705 (down + closing). Projections, not guarantees.
Landlord ↔ Tenant lean methodology
- Overall (STATE)
- 87 Strongly Landlord-Friendly
- State Texas
- 87 Strongly Landlord-Friendly · R+5
- County
- — inherits STATE
- City
- — inherits STATE
ZIP-level market 75071
- Home prices YoY
- -19.1%
- Rents YoY
- -2.1%
- Active inventory
- 2125
- Price-to-rent
- 9.7×
Monthly cashflow live
- Estimated rent
- $2,381 high interval (Pro) →
- Mortgage (P&I)
- −$1,455
- Tax est. 1.5%
- −$347 /mo · $4,163/yr
- Insurance
- −$116
- HOA
- −$65
- Vacancy / Maint / Mgmt
- −$500
- Net cashflow
- $-102
Break-even live
UW: 25.0% down · 7.5% · 30yr · 1.5% tax · 5.0% vac · 8.0% maint · 8.0% mgmt
Financing live
Cash to close
- Down payment
- $69,379
- Closing costs
- $8,326
- Reserves months
- —
- Total cash needed
- —
Loan-product check · same deal, 3 products live
Conventional
25% down · 7.5% · 30yr
- Down + closing
- —
- Monthly P&I
- —
- Monthly cashflow
- —
- DSCR
- —
- Eligible?
- —
Personal DTI + credit; lowest rate.
DSCR
20% down · 8.5% · 30yr
- Down + closing
- —
- Monthly P&I
- —
- Monthly cashflow
- —
- DSCR
- —
- Eligible?
- —
No personal income docs; deal must DSCR.
Hard money
10% down · 12.0% · 12mo
- Down + closing
- —
- Monthly P&I
- —
- Monthly cashflow
- —
- DSCR
- —
- Eligible?
- —
Short-term bridge; refi at stabilization.
Rent comps 22 comps
| Address | Beds | Baths | Sqft | Rent | $/sqft | DOM | Units | Dist |
|---|---|---|---|---|---|---|---|---|
| 715 Dotty Dr McKinney, TX | 3.0 | 2.0 | 1318 | $2,200 | $1.67 | 24d | 1 | 0.05mi |
| 808 Leavenworth Dr McKinney, TX | 4.0 | 2.0 | 1605 | $3,300 | $2.06 | 17d | 1 | 0.07mi |
| 1004 Knox River Dr McKinney, TX | 3.0 | 2.0 | 1609 | $1,999 | $1.24 | 12d | 1 | 0.13mi |
| 1004 Knox River Dr McKinney, TX | 3.0 | 2.0 | 1609 | $1,999 | $1.24 | 7d | 1 | 0.13mi |
| 1209 Bridgewalk Dr McKinney, TX | 3.0 | 2.0 | 1551 | $2,299 | $1.48 | 5d | 1 | 0.20mi |
| 1209 Bridgewalk Dr McKinney, TX | 3.0 | 2.0 | 1551 | $2,350 | $1.52 | 24d | 1 | 0.20mi |
| 1211 Bridgewalk Dr McKinney, TX | 4.0 | 2.0 | 1605 | $2,500 | $1.56 | 24d | 1 | 0.21mi |
| 704 Summerberry Dr McKinney, TX | 4.0 | 2.0 | 1818 | $2,700 | $1.49 | 1d | 1 | 0.33mi |
| 610 Clover Creek Dr Unit 610 McKinney, TX | 3.0 | 2.0 | 1533 | $2,250 | $1.47 | 43d | 1 | 0.46mi |
| 600 Clover Creek Dr McKinney, TX | 3.0 | 2.0 | 1533 | $2,500 | $1.63 | 1d | 1 | 0.47mi |
| 607 Clover Creek Dr McKinney, TX | 3.0 | 2.0 | 1551 | $2,300 | $1.48 | 11d | 1 | 0.49mi |
| 514 Green Grass Dr McKinney, TX | 3.0 | 2.0 | 1504 | $2,300 | $1.53 | 3d | 1 | 0.53mi |
| 519 Green Grass Dr McKinney, TX | 3.0 | 2.0 | 1450 | $2,500 | $1.72 | 1d | 1 | 0.55mi |
| 506 Towerglen Dr McKinney, TX | 3.0 | 2.0 | 1503 | $2,100 | $1.40 | 43d | 1 | 0.58mi |
| 421 Bertney Dr McKinney, TX | 3.0 | 2.0 | 1500 | $2,200 | $1.47 | 43d | 1 | 0.86mi |
| 114 Mountain Meadow Ln McKinney, TX | 3.0 | 2.0 | 1475 | $2,300 | $1.56 | 43d | 1 | 1.01mi |
| 108 Mountain Meadow Ln McKinney, TX | 3.0 | 2.0 | 1566 | $2,200 | $1.40 | 43d | 1 | 1.03mi |
| 4330 FM 75 Princeton, TX | 4.0 | 2.0 | 1832 | $2,200 | $1.20 | 10d | 1 | 1.04mi |
| 4908 Pebblewood Dr McKinney, TX | 4.0 | 2.0 | 1818 | $2,595 | $1.43 | 2d | 1 | 1.09mi |
| 206 Goosewood Dr McKinney, TX | 3.0 | 2.0 | 1566 | $2,300 | $1.47 | 18d | 1 | 1.18mi |
| 7221 Mayplace Dr McKinney, TX | 4.0 | 2.0 | 1836 | $2,300 | $1.25 | 24d | 1 | 1.42mi |
| 3906 Walmer WAY McKinney, TX | 3.0 | 2.0 | 1318 | $1,950 | $1.48 | 43d | 1 | 1.49mi |
HOA detail
- Monthly dues
- $65 · $780/yr
- Likely covers
- pool
Listing history 14 events
-
2026-06-18days on market $277,517 Active 27 DOM
-
2026-06-17days on market $277,517 Active 26 DOM
-
2026-06-16days on market $277,517 Active 25 DOM
-
2026-06-15days on market $277,517 Active 24 DOM
-
2026-06-13days on market $277,517 Active 22 DOM
-
2026-06-09days on market $277,517 Active 18 DOM
-
2026-06-08days on market $277,517 Active 17 DOM
-
2026-06-07days on market $277,517 Active 16 DOM
-
2026-06-04pricedays on market $277,517 Active 13 DOM
-
2026-06-03days on market $276,017 Active 12 DOM
-
2026-06-02days on market $276,017 Active 11 DOM
-
2026-06-01days on market $276,017 Active 10 DOM
-
2026-05-31days on market $276,017 Active 9 DOM
-
2026-05-22$276,017 Active
ⓘ Source: listings_history table (triggers on properties + properties_extension) + one-shot
backfill from property_details.listing_events for pre-trigger history.
Climate risk First Street
- Flood 1/10 Low FEMA zone X (unshaded) · 0% chance over 30 yrs
- Wildfire 3/10 Moderate
- Heat 7/10 Severe 6 d/yr ≥110°F today · 19 d/yr by 30 yrs out
- Wind 6/10 Major 27% chance of damaging wind over 30 yrs
- Air quality 3/10 Moderate 3 unhealthy d/yr today · 3 by 30 yrs out
Nearby sold comps map
Loading sold comps map…
Walkable amenities ~0.75 mi
Loading nearby amenities…
Taxation est. · year 1
- Rental income
- $28,571
- − Mortgage interest
- −$15,545
- − Property taxes
- −$4,163
- − Insurance
- −$1,388
- − Repairs & maintenance
- −$2,286
- − Management
- −$2,286
- − HOA
- −$780
- − Depreciation
- −$8,073
- Taxable loss
- −$5,949
- Est. tax savings @ 24.0%
- +$1,428
- After-tax cash flow
- $204/yr
For passive investors: Depreciation is non-cash, so a rental often shows a tax loss while cash-flowing — sheltering income. Rental losses are passive: they offset passive income freely, and up to $25,000/yr can offset ordinary (W-2) income if you actively participate and your MAGI is under $100k (phasing out to $0 by $150k); unused losses carry forward. On sale, claimed depreciation is recaptured at up to 25%, and gains may owe capital-gains tax (a 1031 exchange can defer both). Figures are a year-1 estimate at your 24.0% rate — not tax advice; consult a CPA.
Condition & rehab AI · 2 photos
This brand new energy-efficient home is move-in ready with no repairs or maintenance needed. It offers a spacious layout, modern amenities, and convenient access to local attractions.
Schools (NCES district)
- District
- Mckinney ISD
- NCES district ID
- 4829850
- Math proficiency
- 54% ▼ -9.00%
- Reading proficiency
- 58% ▼ -2.00%
- Median HH income
- $78,283
- Composite
- 50.46/100
- National rank
- #1862
- State rank
- #72 of 826 in TX
Livability — Princeton
- Score
- 62/100
- State rank
- #969
- US rank
- #17215
Category grades
Schools grade is shown separately in the Schools card above.
Census & demographics
- County
- Collin County · 1,159,394 people
- City population
- 34,171
- Metro
- Dallas-Fort Worth-Arlington, TX
- Population (ZIP)
- 72,964
- Household income
- $132,447
- Rent vs Own
- Severe rent burden
- 1682.0
Population outlook (Collin County) Hauer SSP2
- Today (2025)
- 1,210,074 people
- By 2030
- 1,358,201 · +12.2%
- By 2040
- 1,654,061 · +36.7%
- By 2050
- 1,937,359 · +60.1%
- By 2075
- 2,567,039 · +112.1%
- By 2100
- 2,952,048 · +144.0%
Race, ethnicity, and origin ACS 2023
- Neighborhood character
- Diverse neighborhood (Simpson 0.64)
- Race & ethnicity
- White 55% Hispanic / Latino 17% Black 13% Two or more races 12% Asian 10%
- Hispanic origin (detail)
- Mexican 12%
- Common ancestry
- Italian 2% Slovak 2% Portuguese 1%
- Foreign-born
- 16% · Canada, China, South Korea
- Languages at home
- 76% English-only · Spanish 11% Other Indo-European 4% Other Asian/Pacific 2%
Political lean MEDSL · Collin
- 2024 margin
- R (+11.1) · D 43.1% · R 54.3% · Other 2.6%
- 2008→2024 swing
- +14.4pp toward D · 2008: -25.6pp · 2024: -11.1pp
- All cycles
- 2024: R+11.1 2020: R+4.3 2016: R+17.0 2012: R+31.6 2008: R+25.6
Not yet ingested
- Civics
- —
Market trends
- HPI YoY
- ▼ -59.92%
- Current HPI
- 254.4946
- Rent YoY
- ▼ -2.15%
- Metro
- Dallas-Fort Worth-Arlington, TX
- State GDP YoY
- ▲ 3.95%
- F500 in state
- 110
Industry mix (Fortune 500 HQ in TX)
| Industry | F500 HQs | Revenue |
|---|---|---|
| Energy | 16 | $1,198B |
|
||
| Technology | 5 | $198B |
|
||
| Engineering / Construction | 4 | $72B |
|
||
| Energy Services | 3 | $60B |
|
||
| Utilities | 3 | $41B |
|
||
| Healthcare | 2 | $330B |
|
||
Price history
1 event — show timeline
- 2026-05-22 Listed $276,017 NTREIS
Cash-flow waterfall
monthlySold comps — $/sqft
last 12 mo · ≤1 miLoading sold comps…