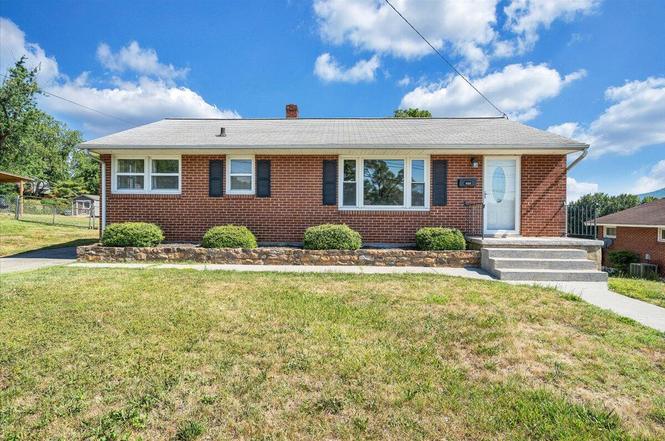
456 Fleming Ave NE · Roanoke, VA
Flood risk 1/10 · Minimal
- FEMA flood zone
- X (unshaded)
- Chance of flooding over 30 yrs
- 0.0%
- Est. flood insurance / yr
- $473 – $860
Fire risk 1/10 · Minimal
- Est. fire insurance / yr
- $666 – $1,236
Heat risk 5/10 · Moderate
- Hot days now (above 101°F)
- 7 days/yr
- Hot days in 30 yrs
- 18 days/yr
Wind risk 2/10 · Minimal
- Chance of severe wind over 30 yrs
- 1.0%
Air-quality risk 2/10 · Minimal
- Unhealthy air days now
- 1 days/yr
- Unhealthy air days in 30 yrs
- 1 days/yr
Risk factors via First Street. Map © Google.
Why this score? — see what drove the D grade
The composite is a weighted blend of 9 inputs, each scored 0–100. Each bar is that input's sub-score; the figure is the points it added to the 100-point composite (weight × sub-score).
- Cash flow +9.8/30.0
- ARV discount +9.8/15.0
- Rent growth +5.0/5.0
- Schools +4.1/10.0
- Livability +3.7/5.0
- 1% rule +2.8/10.0
- DSCR +2.8/10.0
- Condition / age +2.5/5.0
- Appreciation +0.0/10.0
$199,950
🖨 Deal sheet 📄 Offer letter ✓ Due diligence
Listing remarks MLS
Beautifully updated inside. Gleaming refinished HW in LR, DR, hallways & 3 BR's. New vinyl floors in the kitchen & bath, Fresh paint throughout. Updated lighting & bath fixtures. Kitchen redesigned w/ cabinets & counter top, sink & fixtures. SS appliances. Full open unfinished basement w/ laundry hookups. HUGE fenced backyard w/ play space, garden space, storage bld, shed & clothes line.
Key facts
- Unfinished basement
- Storage shed
- Hardwood floors
Tags
Property features AI
Exterior
- Utilities: Electric heat pump for heating and cooling
- Home design: Residential property; Built in 1954
- Exterior features: 0.45-acre lot
Interior
- Kitchen: Built-in microwave
- Bedrooms: Three bedrooms (all on the main level)
- Flooring: Tile flooring; Wood flooring
- Bathrooms: One full bathroom (on the main level)
- Heating & cooling: Heat pump heating; Heat pump cooling (electric)
- Interior features: Storage; Full-view metal door; Insulated, tilt-in windows
Neighborhood map
What this means for you Summary
Snapshot
- This is a 3-bed/1.0-bath single-family listed at $200k.
Deal economics
- At list price, monthly cash flow is $-127 ($-2k/yr) — negative.
- To cash-flow at today's rent, offer at most $178k (11.2% below list).
- To meet the 1% rule (rent ≥ 1% of price), the offer needs to be $155k (22.5% below list).
- Recommended offer: $155k (22.5% below list) — sets the bar for 1% rule.
- Cap rate 5.5% vs local median 4.2% in Roanoke — top-decile yield for the area; either an underpriced asset or a hidden risk that comps aren't pricing in. Stress-test before assuming the spread holds.
Location & tenants
- Location reads 73/100 on livability (#163 in VA) — a middle-class / working-renter tenant base. Strengths: cost of living A+, health & safety A+, housing A; Watch: amenities C-, employment D, crime F.
- Roanoke City Public School District (urban): math 40% / reading 58% proficiency, ranked #102 of 131 in VA (top 78%) — families likely to look elsewhere, expect single-tenant / working-renter base with shorter leases; 67% free/reduced lunch — lower-income household profile, screen leases tightly.
- Zoned schools: Monterey Elementary (math 47% / reading 54%, grade D+, #737 of 1,108 statewide, top 67%, 490 students, 100% FRL); Breckinridge Middle (math 23% / reading 52%, grade F, #315 of 342 statewide, top 93%, 624 students, 99% FRL); William Fleming High (math 66% / reading 68%, grade B, #185 of 319 statewide, top 61%, 1,911 students, 96% FRL) — zoned schools average 98% FRL vs 67% district-wide (32 pts higher); higher-poverty schools than district average — tighter screening recommended.
- Market conditions: Rents rising fast (+10.5%/yr); 194 active listings in the ZIP; 15 comparable units currently listed for rent nearby; rentals at typical pace (median 21d on market — plan ~3-4 weeks tenant-placement turnaround); 113 units permitted in Roanoke city in 2024 (0 in 5+ unit buildings).
- This rent runs 35% of the median local income ($53k/yr) — at the standard rent-burdened threshold; future hikes will face affordability resistance.
Forward outlook
- Local home prices are declining (-3.0%/yr); year-one equity from $1k of loan paydown is wiped out by about $6k of value loss. Plan a longer hold.
- Roanoke County population projected at +11% by 2050 — modest demand growth; plan on rents tracking national, not racing it.
Negotiation context
- Only 1 days on market — expect competitive offers; lowballing is unlikely to land.
- 3 sale attempts since 11y ago with the ask held roughly flat each time — persistent listings suggest the price (not the market) is what's stuck; bring a comps-based counter.
- Current owner paid $112k; list at $200k implies a 79% gain — meaningful room to come down on a strong offer.
Risks & watch-outs
- Watch-outs: built in 1954 — expect roof / HVAC / electrical / plumbing capex.
- Climate carrying-cost: extreme-heat days projected 7→18/yr by 2055 (HVAC capex compounding) — expect insurance premiums to compound above CPI over the hold.
Questions for the listing agent
- What do current leases actually rent for vs. the listed asking? Can we see a recent rent roll and the last 12 months of T-12 income?
- Built in 1954 — when were the roof, HVAC, electrical panel, plumbing, and water heater last replaced?
- Is there a deadline driving the sale (1031 exchange, divorce, estate, relocation)? That informs how much negotiation room exists.
- Schools are A-rated — typically a magnet for longer-tenancy family renters. What's the average tenant stay here, and is there a school-zone premium baked into asking?
- Crime grade is F in this area — have there been break-ins, vandalism, or insurance claims at this property in the last 3 years? What carrier currently insures it and at what premium?
- The area grade is low — what's the realistic commute time and amenity access for the typical tenant pool here? Any planned neighborhood developments (good or bad) we should know about?
- What's the average days-on-market for RENTAL listings here right now (not sales)? A rising rental-DOM trend means longer vacancies and softer asking-rent achievability than the comps imply.
- What's the recent tenant-quality profile in this submarket — average credit score on applications, eviction rate, late-payment / NSF rate, and stable-employment percentage? A property-management company in the area should have these aggregated.
- How much new for-sale + rental construction is in the pipeline within 1–3 miles? Heavy new supply typically softens prices + rents 12–24 months out; constrained supply supports both.
Investment metrics
- 1% rule
- 0.78% ✗
- Cap rate
- 5.53%
- Cash-on-cash
- -2.72%
- DSCR
- 0.88
- GRM
- 10.8
CMA / ARV
- ARV (on-the-fly)
- $210,864
- Comps found
- 12
Show comp detail 12 sales within ~0.75 mi
| Address | Dist | Beds/Ba | Sqft | Sold | Price | $/sf | Match |
|---|---|---|---|---|---|---|---|
| 173 Trinkle Ave NE | 0.18mi | 3/2.0 | 1,064 (-7%) | 5mo | $232,000 | $218 | 72 |
| 3323 Collingwood St NE | 0.41mi | 3/2.0 | 1,200 (+5%) | 2mo | $270,000 | $225 | 67 |
| 3120 Plantation Rd NE | 0.50mi | 2/1.0 (-1) | 1,198 (+4%) | 2mo | $143,000 | $119 | 62 |
| 4104 Old Mountain Rd NE | 0.57mi | 3/1.0 | 1,144 (-0%) | 13mo | $210,000 | $184 | 62 |
| 3112 Plantation Rd NE | 0.52mi | 3/1.5 | 1,072 (-6%) | 7mo | $160,000 | $149 | 57 |
| 218 Wildhurst Ave NE | 0.55mi | 3/1.0 | 1,066 (-7%) | 13mo | $126,000 | $118 | 52 |
| 3222 Plantation Rd NE | 0.43mi | 3/1.0 | 1,022 (-11%) | 12mo | $195,000 | $191 | 52 |
| 223 Oaklawn Ave NE | 0.51mi | 3/1.0 | 1,008 (-12%) | 8mo | $170,000 | $169 | 49 |
| 4348 Old Mountain Rd NE | 0.65mi | 3/2.0 | 1,021 (-11%) | 4mo | $235,000 | $230 | 44 |
| 3103 Shenandoah Valley Ave NE | 0.55mi | 2/1.0 (-1) | 1,036 (-10%) | 13mo | $49,000 | $47 | 43 |
| 2912 Mansfield St NE | 0.75mi | 3/1.0 | 1,061 (-7%) | 15mo | $238,000 | $224 | 40 |
| 2820 Luray St NE | 0.70mi | 3/1.0 | 983 (-14%) | 10mo | $171,000 | $174 | 35 |
Match score weights: distance 35% · size 25% · config 20% · recency 20%. Top-matched comps best support the ARV.
Projected returns pro-forma
-3.0% appreciation · 8.0% rent growth · sell at horizon
- IRR
- -15.5%
- Equity multiple
- 0.42×
- Total profit
- $-32,282
- Equity at exit
- $29,813
- IRR
- -0.3%
- Equity multiple
- 0.98×
- Total profit
- $-1,214
- Equity at exit
- $17,288
Cash invested: $55,986 (down + closing). Projections, not guarantees.
Landlord ↔ Tenant lean methodology
- Overall (STATE)
- 55 Moderately Landlord-Leaning
- State Virginia
- 55 Moderately Landlord-Leaning · D+2
- County
- — inherits STATE
- City
- — inherits STATE
ZIP-level market 24012
- Rents YoY
- 10.5%
- Active inventory
- 194
- Price-to-rent
- 10.8×
Monthly cashflow live
- Estimated rent
- $1,550 high interval (Pro) →
- Mortgage (P&I)
- −$1,049
- Tax from tax record
- −$219 /mo · $2,631/yr
- Insurance
- −$83
- HOA
- −$0
- Vacancy / Maint / Mgmt
- −$325
- Net cashflow
- $-127
Break-even live
UW: 25.0% down · 7.5% · 30yr · 1.5% tax · 5.0% vac · 8.0% maint · 8.0% mgmt
Financing live
Cash to close
- Down payment
- $49,988
- Closing costs
- $5,998
- Reserves months
- —
- Total cash needed
- —
Loan-product check · same deal, 3 products live
Conventional
25% down · 7.5% · 30yr
- Down + closing
- —
- Monthly P&I
- —
- Monthly cashflow
- —
- DSCR
- —
- Eligible?
- —
Personal DTI + credit; lowest rate.
DSCR
20% down · 8.5% · 30yr
- Down + closing
- —
- Monthly P&I
- —
- Monthly cashflow
- —
- DSCR
- —
- Eligible?
- —
No personal income docs; deal must DSCR.
Hard money
10% down · 12.0% · 12mo
- Down + closing
- —
- Monthly P&I
- —
- Monthly cashflow
- —
- DSCR
- —
- Eligible?
- —
Short-term bridge; refi at stabilization.
Rent comps 15 comps
| Address | Beds | Baths | Sqft | Rent | $/sqft | DOM | Units | Dist |
|---|---|---|---|---|---|---|---|---|
| 3816 Plantation Rd NE Roanoke, VA | 2.0 | 2.0 | 1267 | $1,700 | $1.34 | 43d | 1 | 0.13mi |
| 709 Drew Ave NE Apt 2 Roanoke, VA | 2.0 | 1.0 | 825 | $1,050 | $1.27 | 43d | 1 | 0.26mi |
| 3323 Collingwood St NE Roanoke, VA | 3.0 | 2.0 | 1200 | $2,150 | $1.79 | 43d | 1 | 0.42mi |
| 3228 Oliver Rd NE Roanoke, VA | 3.0 | 1.0 | 1017 | $1,150 | $1.13 | 21d | 1 | 0.45mi |
| 4532 Tacoma Ave NE Roanoke, VA | 3.0 | 1.0 | 1092 | $1,550 | $1.42 | 13d | 1 | 0.49mi |
| 3111 Ellsworth St NE Roanoke, VA | 1.0–2.0 | 1.0 | 662 | $1,199 | $1.81 | 13d | 2 | 0.62mi |
| 106 Lee Ave NE Apt 10 Roanoke, VA | 2.0 | 1.5 | 902 | $1,125 | $1.25 | 13d | 1 | 0.75mi |
| 106 Lee Ave NE Apt 10 Roanoke, VA | 2.0 | 1.5 | 820 | $1,160 | $1.41 | 43d | 1 | 0.75mi |
| 2716 Edison St NE Unit & 2718 Roanoke, VA | 2.0 | 1.5 | 864 | $1,225 | $1.42 | 43d | 1 | 0.97mi |
| 812 Whitney Ave NW Roanoke, VA | 2.0 | 1.0 | 825 | $1,100 | $1.33 | 13d | 1 | 1.15mi |
| 2109 Colgate St NE Roanoke, VA | 3.0 | 1.0 | 1240 | $1,700 | $1.37 | 13d | 1 | 1.28mi |
| 2916 Courtland Rd NW Roanoke, VA | 2.0 | 1.0 | 722 | $1,123 | $1.56 | 21d | 1 | 1.30mi |
| 44 Forest Hill Ave NE Roanoke, VA | 2.0 | 1.0 | 768 | $1,150 | $1.50 | 21d | 1 | 1.31mi |
| 4823 Rutgers St NW Roanoke, VA | 1.0–3.0 | 1.0 | 771 | $1,399 | $1.81 | 13d | 5 | 1.37mi |
| 5125 Airport Rd NW Roanoke, VA | 3.0 | 1.0 | 1000 | $1,695 | $1.70 | 13d | 1 | 1.37mi |
Listing history 2 events
-
2026-06-18remarks 690-char remark
-
2026-06-18$199,950 Active 1 DOM
ⓘ Source: listings_history table (triggers on properties + properties_extension) + one-shot
backfill from property_details.listing_events for pre-trigger history.
Tax reassessment forecast VA · Resets to sale price
- Current annual tax
- $2,631 · $219/mo
- Projected year-2 tax
- $2,631 · $219/mo
- Expected delta
- $0/yr ($0/mo · 0.0%)
ⓘ Screening estimate from a state-policy table — verify with the county assessor before closing.
Climate risk First Street
- Flood 1/10 Low FEMA zone X (unshaded) · 0% chance over 30 yrs
- Wildfire 1/10 Low
- Heat 5/10 Major 7 d/yr ≥101°F today · 18 d/yr by 30 yrs out
- Wind 2/10 Low 100% chance of damaging wind over 30 yrs
- Air quality 2/10 Low 1 unhealthy d/yr today · 1 by 30 yrs out
Nearby sold comps map
Loading sold comps map…
Walkable amenities ~0.75 mi
Loading nearby amenities…
Taxation est. · year 1
- Rental income
- $18,598
- − Mortgage interest
- −$11,200
- − Property taxes
- −$2,631
- − Insurance
- −$1,000
- − Repairs & maintenance
- −$1,488
- − Management
- −$1,488
- − Depreciation
- −$5,817
- Taxable loss
- −$5,026
- Est. tax savings @ 24.0%
- +$1,206
- After-tax cash flow
- $-315/yr
For passive investors: Depreciation is non-cash, so a rental often shows a tax loss while cash-flowing — sheltering income. Rental losses are passive: they offset passive income freely, and up to $25,000/yr can offset ordinary (W-2) income if you actively participate and your MAGI is under $100k (phasing out to $0 by $150k); unused losses carry forward. On sale, claimed depreciation is recaptured at up to 25%, and gains may owe capital-gains tax (a 1031 exchange can defer both). Figures are a year-1 estimate at your 24.0% rate — not tax advice; consult a CPA.
Schools (NCES district)
- District
- Roanoke City Public School District
- NCES district ID
- 5103300
- Math proficiency
- 40% ▼ -38.00%
- Reading proficiency
- 58% ▼ -12.00%
- Median HH income
- $38,592
- Composite
- 40.8/100
- National rank
- #3639
- State rank
- #102 of 131 in VA
Livability — Roanoke
- Score
- 73/100
- State rank
- #163
- US rank
- #5055
Category grades
Schools grade is shown separately in the Schools card above.
Census & demographics
- Census place
- Roanoke, VA
- County
- Roanoke City · 101,625 people
- City population
- 168,930
- Metro
- Roanoke, VA
- Population (ZIP)
- 28,235
- Household income
- $52,973
- Rent vs Own
- Severe rent burden
- 1360.0
Population outlook (Roanoke County) Hauer SSP2
- Today (2025)
- 106,094 people
- By 2030
- 108,927 · +2.7%
- By 2040
- 114,104 · +7.5%
- By 2050
- 118,032 · +11.3%
- By 2075
- 123,363 · +16.3%
- By 2100
- 116,827 · +10.1%
Race, ethnicity, and origin ACS 2023
- Neighborhood character
- Diverse neighborhood (Simpson 0.59)
- Race & ethnicity
- White 60% Black 16% Hispanic / Latino 14% Two or more races 13% Asian 4%
- Hispanic origin (detail)
- Mexican 4% Dominican 1%
- Common ancestry
- Romanian 2% Slovak 2% Serbian 1%
- Foreign-born
- 11% · Canada, Vietnam, Jamaica
- Languages at home
- 84% English-only · Spanish 11% Other Asian/Pacific 2% Vietnamese 2%
Political lean MEDSL · Roanoke
- 2024 margin
- Strong D (+23.6) · D 61.1% · R 37.5% · Other 1.4%
- 2008→2024 swing
- +0.2pp no change · 2008: 23.4pp · 2024: 23.6pp
- All cycles
- 2024: D+23.6 2020: D+25.8 2016: D+17.6 2012: D+21.5 2008: D+23.4
Not yet ingested
- Civics
- —
Market trends
- HPI YoY
- ▼ -137.94%
- Current HPI
- 186.9007
- Rent YoY
- ▲ 10.46%
- Metro
- Roanoke, VA
- State GDP YoY
- ▲ 2.40%
- F500 in state
- 50
Industry mix (Fortune 500 HQ in VA)
| Industry | F500 HQs | Revenue |
|---|---|---|
| Aerospace / Defense | 4 | $236B |
|
||
| Technology / Defense | 3 | $32B |
|
||
| Financial Services | 2 | $176B |
|
||
| Utilities | 2 | $27B |
|
||
| Insurance | 2 | $25B |
|
||
| Technology | 2 | $15B |
|
||
Price history
+399.9% since first listed7 events — show timeline
- 2026-06-18 Listed $199,950 MLSRV
- 2015-09-01 Sold (Public Records) $112,000 Public Records
- 2015-08-31 Sold (MLS) $112,000 MLSRV
- 2015-07-29 Listed $114,950 MLSRV
- 2015-07-28 Listing Removed — MLSRV
- 2015-04-28 Listed $114,950 MLSRV
- 1979-08-09 Sold (Public Records) $40,000 Public Records
Property tax history
+7.9%/yrLatest (2025): $2,631 · +5.2% YoY. Source: county tax records.
Cash-flow waterfall
monthlySold comps — $/sqft
last 12 mo · ≤1 miLoading sold comps…