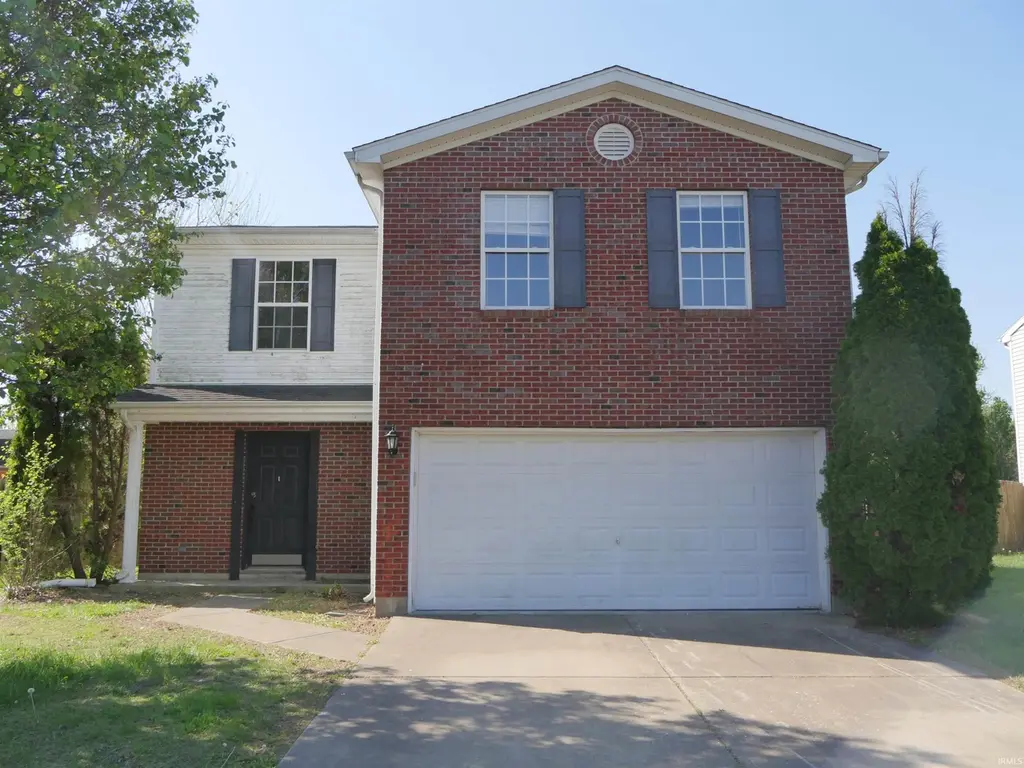
8145 Blake Blvd · Chandler, IN
Flood risk 1/10 · Minimal
- FEMA flood zone
- X (unshaded)
- Chance of flooding over 30 yrs
- 0.0%
- Est. flood insurance / yr
- $507 – $1,088
Fire risk 1/10 · Minimal
- Est. fire insurance / yr
- $717 – $1,331
Heat risk 5/10 · Moderate
- Hot days now (above 106°F)
- 7 days/yr
- Hot days in 30 yrs
- 19 days/yr
Wind risk 2/10 · Minimal
- Chance of severe wind over 30 yrs
- 4.0%
Air-quality risk 4/10 · Minor
- Unhealthy air days now
- 4 days/yr
- Unhealthy air days in 30 yrs
- 6 days/yr
Risk factors via First Street. Map © Google.
Why this score? — see what drove the B grade
The composite is a weighted blend of 9 inputs, each scored 0–100. Each bar is that input's sub-score; the figure is the points it added to the 100-point composite (weight × sub-score).
- Cash flow +30.0/30.0
- 1% rule +10.0/10.0
- DSCR +10.0/10.0
- ARV discount +7.5/15.0
- Schools +4.9/10.0
- Rent growth +4.7/5.0
- Livability +3.3/5.0
- Condition / age +2.5/5.0
- Appreciation +0.0/10.0
$118,900
🖨 Deal sheet 📄 Offer letter ✓ Due diligence
Listing remarks MLS
Newburgh, Great Subdivions, Great Schools - OH MY! This beautiful 2 story home has one of the largest lots in the subdivision! A large foyer (perfect for Pinterest projects!) greets you at the front door and a large, walk in coat closet is a pleasant surprise! The large, open dining area, living room and kitchen area makes entertaining guests so nice. The living room has custom book case and cabinet that accent the lovely gas log fireplace. A large, bright kitchen with fresh paint has ample counter space and cabinets for the chef of the family. A half bath is conveniently located on the lower level, as well as the laundry room. Upstairs are two large guest rooms with large, organized closets. A nice hidden area is right down the hallway - perfect for a small office, play area or extra storage (as currently being used). An extra large Master bedroom with a bump out area perfect for additional furniture or a sitting area and it's private en suite is ready for the new owner. If outdoor entertaining is what you desire, this home is perfect with the large fenced yard! Cook out on your large concrete patio! Roof is new in 2015, new back door, new garbage disposal, newer fridge, tv mount above fireplace. Home Warranty is included for the buyer's peace of mind!
Key facts
- Gutted to the studs
- Open framework
- 0.27 acre lot
Tags
Property features AI
Finance
- Other: Lot is level (approx. 60 x 199, 0.27 acre)
Exterior
- Parking: Attached garage with 2 spaces; Off-street parking
- Utilities: Public water; Public sewer
- Home design: Single-family site-built home; Two stories; Located in The Oaks subdivision
- Construction: Brick and vinyl siding exterior; Slab foundation; Built area above grade: 1,664
- Exterior features: Patio; Full fenced yard; Shed(s)
Interior
- Bedrooms: Total of 8 rooms (bedroom count not specified separately)
- Bathrooms: Two full bathrooms; One half bathroom; One main-level bathroom
- Heating & cooling: Central air conditioning; Natural gas forced-air heating
- Interior features: Living room fireplace
- Laundry & utility: Laundry on main level
Neighborhood map
What this means for you Summary
Snapshot
- This is a 3-bed/2.5-bath single-family listed at $119k.
Deal economics
- At list price, monthly cash flow is $651 ($8k/yr) — positive.
- The deal already cash-flows at list — no discount required.
- Meets the 1% rule at list price ($2k rent vs $119k).
- Recommended offer: $117k (1.5% below list) — sets the bar for market timing.
- Cap rate 12.9% vs local median 3.9% in Chandler — top-decile yield for the area; either an underpriced asset or a hidden risk that comps aren't pricing in. Stress-test before assuming the spread holds.
Location & tenants
- Location reads 66/100 on livability (#282 in IN) — a middle-class / working-renter tenant base. Strengths: cost of living A+, housing A+, crime A; Watch: employment D+, amenities F, commute F.
- Warrick County School Corporation (suburban): math 54% / reading 59% proficiency, ranked #24 of 301 in IN (top 8%) — acceptable for families but not a draw, mixed tenant base, ~2y average lease.
- Zoned schools: John H Castle Elementary School (math 73% / reading 60%, grade B+, #65 of 994 statewide, top 7%, 998 students, 20% FRL); Castle North Middle School (math 57% / reading 59%, grade B, #18 of 330 statewide, top 5%, 770 students, 22% FRL); Castle High School (math 56% / reading 80%, grade B, #22 of 369 statewide, top 6%, 1,961 students, 26% FRL) — zoned schools at 22% FRL track the district average.
- Market conditions: Rents rising fast (+8.7%/yr); 383 active listings in the ZIP; 7 comparable units currently listed for rent nearby; rentals lingering (median 44d on market — plan ~5-8 weeks vacancy on turnover, expect pricing pressure); 57% of comp listings sitting > 30 days — soft ceiling on asking rent; solid renter incomes; 249 units permitted in Warrick County in 2024 (0 in 5+ unit buildings).
Forward outlook
- Local home prices are declining (-3.0%/yr); year-one equity from $822 of loan paydown is wiped out by about $4k of value loss. Plan a longer hold.
- Warrick County population projected at +9% by 2050 — modest demand growth; plan on rents tracking national, not racing it.
- At projected returns (-3.0% appreciation + 8.0% rent growth), your $33k cash investment doubles in ~5 years — after that, you're playing with house money.
Negotiation context
- It's been on market 15 days — a 2% lower offer ($117k) is reasonable based on typical stale-listing flexibility.
- 2 sale attempts since 8y ago with the ask held roughly flat each time — persistent listings suggest the price (not the market) is what's stuck; bring a comps-based counter.
Risks & watch-outs
- Climate carrying-cost: extreme-heat days projected 7→19/yr by 2055 (HVAC capex compounding) — expect insurance premiums to compound above CPI over the hold.
Questions for the listing agent
- Is there a deadline driving the sale (1031 exchange, divorce, estate, relocation)? That informs how much negotiation room exists.
- What's the average days-on-market for RENTAL listings here right now (not sales)? A rising rental-DOM trend means longer vacancies and softer asking-rent achievability than the comps imply.
- What's the recent tenant-quality profile in this submarket — average credit score on applications, eviction rate, late-payment / NSF rate, and stable-employment percentage? A property-management company in the area should have these aggregated.
- How much new for-sale + rental construction is in the pipeline within 1–3 miles? Heavy new supply typically softens prices + rents 12–24 months out; constrained supply supports both.
Investment metrics
- 1% rule
- 1.53% ✓
- Cap rate
- 12.87%
- Cash-on-cash
- 23.48%
- DSCR
- 2.04
- GRM
- 5.4
CMA / ARV
- ARV (on-the-fly)
- $272,896
- Comps found
- 12
Show comp detail 12 sales within ~0.75 mi
| Address | Dist | Beds/Ba | Sqft | Sold | Price | $/sf | Match |
|---|---|---|---|---|---|---|---|
| 8277 Kifer Dr | 0.23mi | 3/1.5 | 1,675 (+1%) | 6mo | $255,000 | $152 | 79 |
| 2977 Jerrald Dr | 0.17mi | 4/2.5 (+1) | 1,755 (+6%) | 4mo | $287,000 | $164 | 74 |
| 2833 Terri Ln | 0.32mi | 3/1.5 | 1,696 (+2%) | 5mo | $225,000 | $133 | 74 |
| 7932 Melissa Ln | 0.22mi | 4/2.0 (+1) | 1,678 (+1%) | 10mo | $195,000 | $116 | 73 |
| 8400 Kifer Dr | 0.32mi | 3/3.0 | 1,819 (+9%) | 2mo | $265,000 | $146 | 66 |
| 2807 Laura Lynn Ln | 0.10mi | 4/2.0 (+1) | 1,908 (+15%) | 2mo | $353,000 | $185 | 62 |
| 8411 Countrywood Ct | 0.36mi | 3/3.0 | 1,818 (+9%) | 6mo | $303,000 | $167 | 60 |
| 7699 Georgia Ln | 0.72mi | 3/2.0 | 1,648 (-1%) | 4mo | $270,000 | $164 | 60 |
| 8486 Bell Crossing Dr | 0.68mi | 3/2.0 | 1,620 (-3%) | 9mo | $274,900 | $170 | 54 |
| 8433 Countrywood Ct | 0.37mi | 3/2.0 | 1,455 (-13%) | 10mo | $245,000 | $168 | 52 |
| 8600 Frontier Dr | 0.56mi | 3/2.0 | 1,853 (+11%) | 2mo | $248,000 | $134 | 51 |
| 8733 Windsor Dr | 0.74mi | 3/3.0 | 1,777 (+7%) | 6mo | $300,000 | $169 | 47 |
Match score weights: distance 35% · size 25% · config 20% · recency 20%. Top-matched comps best support the ARV.
Projected returns pro-forma
-3.0% appreciation · 8.0% rent growth · sell at horizon
- IRR
- 22.0%
- Equity multiple
- 1.96×
- Total profit
- $31,859
- Equity at exit
- $17,728
- IRR
- 33.1%
- Equity multiple
- 4.76×
- Total profit
- $125,012
- Equity at exit
- $10,280
Cash invested: $33,292 (down + closing). Projections, not guarantees.
Landlord ↔ Tenant lean methodology
- Overall (STATE)
- 90 Strongly Landlord-Friendly
- State Indiana
- 90 Strongly Landlord-Friendly · R+11
- County
- — inherits STATE
- City
- — inherits STATE
ZIP-level market 47630
- Rents YoY
- 8.7%
- Active inventory
- 383
- Price-to-rent
- 5.4×
Monthly cashflow live
- Estimated rent
- $1,822 high interval (Pro) →
- Mortgage (P&I)
- −$624
- Tax from tax record
- −$114 /mo · $1,374/yr
- Insurance
- −$50
- HOA
- −$0
- Vacancy / Maint / Mgmt
- −$383
- Net cashflow
- $651
Break-even live
UW: 25.0% down · 7.5% · 30yr · 1.5% tax · 5.0% vac · 8.0% maint · 8.0% mgmt
Financing live
Cash to close
- Down payment
- $29,725
- Closing costs
- $3,567
- Reserves months
- —
- Total cash needed
- —
Loan-product check · same deal, 3 products live
Conventional
25% down · 7.5% · 30yr
- Down + closing
- —
- Monthly P&I
- —
- Monthly cashflow
- —
- DSCR
- —
- Eligible?
- —
Personal DTI + credit; lowest rate.
DSCR
20% down · 8.5% · 30yr
- Down + closing
- —
- Monthly P&I
- —
- Monthly cashflow
- —
- DSCR
- —
- Eligible?
- —
No personal income docs; deal must DSCR.
Hard money
10% down · 12.0% · 12mo
- Down + closing
- —
- Monthly P&I
- —
- Monthly cashflow
- —
- DSCR
- —
- Eligible?
- —
Short-term bridge; refi at stabilization.
Rent comps 7 comps
| Address | Beds | Baths | Sqft | Rent | $/sqft | DOM | Units | Dist |
|---|---|---|---|---|---|---|---|---|
| 8120 Cedar Point Dr Newburgh, IN | 3.0 | 2.0 | 1281 | $1,700 | $1.33 | 43d | 1 | 0.23mi |
| 2974 Enclave Ct Newburgh, IN | 2.0 | 2.0 | 1250 | $2,200 | $1.76 | 43d | 1 | 0.43mi |
| 2964 Enclave Ct Newburgh, IN | 2.0 | 2.0 | 1250 | $1,950 | $1.56 | 20d | 1 | 0.43mi |
| 7872 Sandalwood Dr Newburgh, IN | 3.0 | 2.0 | 1296 | $1,700 | $1.31 | 20d | 1 | 1.20mi |
| 7778 Sandalwood Dr Newburgh, IN | 3.0 | 2.0 | 1376 | $1,700 | $1.24 | 43d | 1 | 1.21mi |
| 107 Olde Newburgh Dr Newburgh, IN | 2.0 | 2.5 | 1380 | $1,375 | $1.00 | 43d | 1 | 1.24mi |
| 114 Olde Newburgh Dr Newburgh, IN | 3.0 | 2.5 | 1526 | $1,500 | $0.98 | 20d | 1 | 1.26mi |
Listing history 8 events
-
2026-06-07statusdays on market $118,900 Pending 15 DOM
-
2026-06-02days on market $118,900 Active 12 DOM
-
2026-06-01days on market $118,900 Active 11 DOM
-
2026-05-31days on market $118,900 Active 10 DOM
-
2026-05-30days on market $118,900 Active 9 DOM
-
2026-05-20$118,900 Active
-
2018-04-27soldstatus $160,000 1274-char remark
Show marketing remark (1274 chars)
Newburgh, Great Subdivions, Great Schools - OH MY! This beautiful 2 story home has one of the largest lots in the subdivision! A large foyer (perfect for Pinterest projects!) greets you at the front door and a large, walk in coat closet is a pleasant surprise! The large, open dining area, living room and kitchen area makes entertaining guests so nice. The living room has custom book case and cabinet that accent the lovely gas log fireplace. A large, bright kitchen with fresh paint has ample counter space and cabinets for the chef of the family. A half bath is conveniently located on the lower level, as well as the laundry room. Upstairs are two large guest rooms with large, organized closets. A nice hidden area is right down the hallway - perfect for a small office, play area or extra storage (as currently being used). An extra large Master bedroom with a bump out area perfect for additional furniture or a sitting area and it's private en suite is ready for the new owner. If outdoor entertaining is what you desire, this home is perfect with the large fenced yard! Cook out on your large concrete patio! Roof is new in 2015, new back door, new garbage disposal, newer fridge, tv mount above fireplace. Home Warranty is included for the buyer's peace of mind!
-
2018-03-12$165,000 1274-char remark
Show marketing remark (1274 chars)
Newburgh, Great Subdivions, Great Schools - OH MY! This beautiful 2 story home has one of the largest lots in the subdivision! A large foyer (perfect for Pinterest projects!) greets you at the front door and a large, walk in coat closet is a pleasant surprise! The large, open dining area, living room and kitchen area makes entertaining guests so nice. The living room has custom book case and cabinet that accent the lovely gas log fireplace. A large, bright kitchen with fresh paint has ample counter space and cabinets for the chef of the family. A half bath is conveniently located on the lower level, as well as the laundry room. Upstairs are two large guest rooms with large, organized closets. A nice hidden area is right down the hallway - perfect for a small office, play area or extra storage (as currently being used). An extra large Master bedroom with a bump out area perfect for additional furniture or a sitting area and it's private en suite is ready for the new owner. If outdoor entertaining is what you desire, this home is perfect with the large fenced yard! Cook out on your large concrete patio! Roof is new in 2015, new back door, new garbage disposal, newer fridge, tv mount above fireplace. Home Warranty is included for the buyer's peace of mind!
ⓘ Source: listings_history table (triggers on properties + properties_extension) + one-shot
backfill from property_details.listing_events for pre-trigger history.
Tax reassessment forecast IN · Partial reset (capped growth)
- Current annual tax
- $1,374 · $114/mo
- Projected year-2 tax
- $1,374 · $114/mo
- Expected delta
- $0/yr ($0/mo · 0.0%)
ⓘ Screening estimate from a state-policy table — verify with the county assessor before closing.
Climate risk First Street
- Flood 1/10 Low FEMA zone X (unshaded) · 0% chance over 30 yrs
- Wildfire 1/10 Low
- Heat 5/10 Major 7 d/yr ≥106°F today · 19 d/yr by 30 yrs out
- Wind 2/10 Low 4% chance of damaging wind over 30 yrs
- Air quality 4/10 Moderate 4 unhealthy d/yr today · 6 by 30 yrs out
Nearby sold comps map
Loading sold comps map…
Walkable amenities ~0.75 mi
Loading nearby amenities…
Taxation est. · year 1
- Rental income
- $21,859
- − Mortgage interest
- −$6,660
- − Property taxes
- −$1,374
- − Insurance
- −$594
- − Repairs & maintenance
- −$1,749
- − Management
- −$1,749
- − Depreciation
- −$3,459
- Taxable income
- $6,274
- Est. tax owed @ 24.0%
- −$1,506
- After-tax cash flow
- $6,312/yr
For passive investors: Depreciation is non-cash, so a rental often shows a tax loss while cash-flowing — sheltering income. Rental losses are passive: they offset passive income freely, and up to $25,000/yr can offset ordinary (W-2) income if you actively participate and your MAGI is under $100k (phasing out to $0 by $150k); unused losses carry forward. On sale, claimed depreciation is recaptured at up to 25%, and gains may owe capital-gains tax (a 1031 exchange can defer both). Figures are a year-1 estimate at your 24.0% rate — not tax advice; consult a CPA.
Schools (NCES district)
- District
- Warrick County School Corporation
- NCES district ID
- 1812390
- Math proficiency
- 54% ▼ -8.00%
- Reading proficiency
- 59% ▼ -6.00%
- Median HH income
- $62,801
- Composite
- 49.38/100
- National rank
- #2014
- State rank
- #24 of 301 in IN
Livability — Chandler
- Score
- 66/100
- State rank
- #282
- US rank
- #11582
Category grades
Schools grade is shown separately in the Schools card above.
Census & demographics
- County
- Warrick County · 39,818 people
- Metro
- Evansville, IN-KY
- Population (ZIP)
- 39,818
- Household income
- $94,162
- Rent vs Own
- Severe rent burden
- 770.0
Population outlook (Warrick County) Hauer SSP2
- Today (2025)
- 66,569 people
- By 2030
- 68,404 · +2.8%
- By 2040
- 71,131 · +6.9%
- By 2050
- 72,743 · +9.3%
- By 2075
- 76,088 · +14.3%
- By 2100
- 72,261 · +8.6%
Race, ethnicity, and origin ACS 2023
- Neighborhood character
- Predominantly White (88%)
- Race & ethnicity
- White 88% Two or more races 5% Black 3% Hispanic / Latino 3% Asian 3%
- Common ancestry
- Italian 3% Lithuanian 2% Romanian 2%
- Foreign-born
- 5% · Canada, China
- Languages at home
- 96% English-only · Spanish 2% Other Indo-European 1%
Political lean MEDSL · Warrick
- 2024 margin
- Solid R (+30.2) · D 34.1% · R 64.3% · Other 1.5%
- 2008→2024 swing
- -17.4pp toward R · 2008: -12.8pp · 2024: -30.2pp
- All cycles
- 2024: R+30.2 2020: R+27.8 2016: R+33.9 2012: R+26.6 2008: R+12.8
Not yet ingested
- Civics
- —
Market trends
- HPI YoY
- ▼ -187.44%
- Current HPI
- 185.7643
- Rent YoY
- ▲ 8.69%
- Metro
- Evansville, IN-KY
- State GDP YoY
- ▲ 2.90%
- F500 in state
- 18
Industry mix (Fortune 500 HQ in IN)
| Industry | F500 HQs | Revenue |
|---|---|---|
| Industrial Machinery | 2 | $37B |
|
||
| Healthcare | 1 | $177B |
|
||
| Pharmaceuticals | 1 | $45B |
|
||
| Metals / Steel | 1 | $18B |
|
||
| Agriculture | 1 | $17B |
|
||
| Packaging | 1 | $12B |
|
||
Price history
-27.9% since first listed3 events — show timeline
- 2026-05-20 Listed $118,900 IRMLS
- 2018-04-27 Sold (MLS) $160,000 IRMLS
- 2018-03-12 Listed $165,000 IRMLS
Property tax history
+5.1%/yrLatest (2024): $1,374 · +0.5% YoY. Source: county tax records.
Cash-flow waterfall
monthlySold comps — $/sqft
last 12 mo · ≤1 miLoading sold comps…