 Multi-family
170 26th St · New York, NY
Flood risk 1/10 · Minimal
- FEMA flood zone
- X (unshaded)
- Chance of flooding over 30 yrs
- 0.0%
- Est. flood insurance / yr
- $507 – $1,088
Fire risk 1/10 · Minimal
- Est. fire insurance / yr
- $691 – $1,283
Heat risk 7/10 · Major
- Hot days now (above 99°F)
- 7 days/yr
- Hot days in 30 yrs
- 15 days/yr
Wind risk 6/10 · Moderate
- Chance of severe wind over 30 yrs
- 62.0%
Air-quality risk 4/10 · Minor
- Unhealthy air days now
- 5 days/yr
- Unhealthy air days in 30 yrs
- 7 days/yr
Risk factors via First Street. Map © Google.
Why this score? — see what drove the D- grade
The composite is a weighted blend of 9 inputs, each scored 0–100. Each bar is that input's sub-score; the figure is the points it added to the 100-point composite (weight × sub-score).
- Appreciation +9.2/10.0
- ARV discount +7.5/15.0
- Schools +5.0/10.0
- Cash flow +4.4/30.0
- Rent growth +4.1/5.0
- Livability +3.8/5.0
- Condition / age +2.5/5.0
- 1% rule +0.0/10.0
- DSCR +0.0/10.0
$1,350,000
🖨 Deal sheet (PDF) 📄 Offer letter ✓ Due diligence
Multi-family units
County records classify this as Multi-Family (2-4 Unit). Listing-text estimate: 1 unit. estimate disagrees with records
Listing remarks
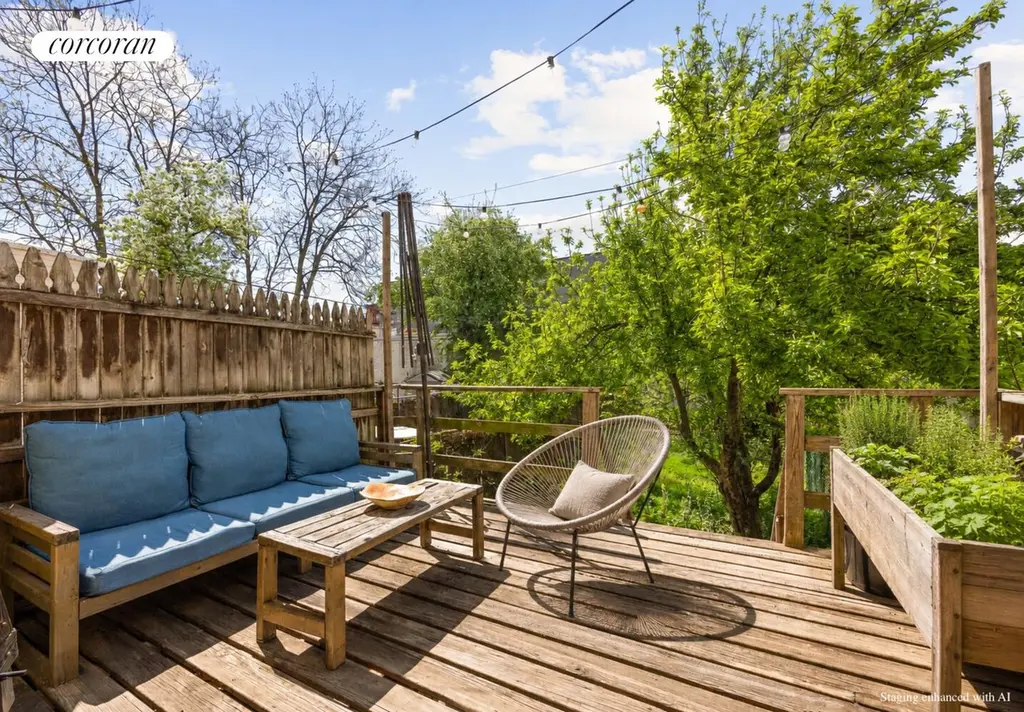
Cottage in the City! Come to Greenwood Heights, and enjoy this charming c. 1910 two-story house with a surprisingly deep and verdant rear garden. Set up as a one-family, this house offers lots of possibilities. The main level is an open plan with hand-burnished wood floors and a wood-burning fireplace. The kitchen is outfitted with white custom cabinetry with glass uppers, white quartz countertops, a five-burner vented stove, an exposed brick chimney and glass sliding doors that lead onto a south-facing deck. There's a sleek full bath with step-in shower on this level. Upstairs are two bedrooms -- one front and one back -- a study/nursery and an oversized walk-in closet. A second full bat
Key facts
- Custom cabinetry
- Open plan
- Deep rear garden
Tags
Property features AI
Finance
- Other: Multi-unit property with 2 total units
- Financial info: Annual taxes listed (amount withheld from output per instructions)
Exterior
- Home design: 2-story building; Entry level: 1
- Construction: Green building
- Exterior features: Property has a view; Lot dimensions approximately 101 x 18
Interior
- Bedrooms: Total of 5 rooms (includes bedrooms and living spaces)
- Bathrooms: 2 full bathrooms
- Interior features: Smoke-free; Has basement (other type)
- Laundry & utility: Washer hookup; In-unit laundry possible; Washer/dryer allowed
Neighborhood map
What this means for you Summary
Snapshot
- This is a 2-bed/2.0-bath multifamily listed at $1.35M.
Deal economics
- At list price, monthly cash flow is $-4k ($-42k/yr) — negative.
- To cash-flow at today's rent, offer at most $730k (45.9% below list).
- To meet the 1% rule (rent ≥ 1% of price), the offer needs to be $555k (58.9% below list).
- Recommended offer: $555k (58.9% below list) — sets the bar for 1% rule.
- Cap rate 3.2% vs local median 2.6% in New York — meaningfully above typical; check what's discounted (condition, days-on-market, listing class) to confirm the premium yield is real.
Location & tenants
- Location reads 75/100 on livability (#268 in NY, #4,188 nationally) — a middle-class / working-renter tenant base. Strengths: amenities A+, commute A+, health & safety A; Watch: crime F, cost of living F.
- Zoned schools: Elm Tree Elementary School (math 27% / reading 52%, grade F, #1,444 of 2,108 statewide, top 71%, 806 students, 94% FRL); Ms 51 William Alexander (math 67% / reading 92%, grade A+, #32 of 729 statewide, top 5%, 1,026 students, 61% FRL); Midwood High School (math 94% / reading 96%, grade A+, #83 of 1,100 statewide, top 8%, 4,062 students, 73% FRL).
- Market conditions: Rents rising fast (+6.3%/yr); 87 active listings in the ZIP; 1 comparable units currently listed for rent nearby; solid renter incomes; 10,063 units permitted in Kings County in 2024 (9,789 in 5+ unit buildings).
- At $5,550/mo this rent would consume 73% of the median local household income ($91k/yr) (locally 1713% of renters already pay >50% of income on rent) — very limited rent-growth headroom before tenants either downsize or default.
Forward outlook
- In year one you build about $122k of equity ($9k loan paydown + $113k appreciation (8.3% local appreciation)).
- Kings County population projected at +13% by 2050 — modest demand growth; plan on rents tracking national, not racing it.
- By year 2, paydown + projected appreciation supports a ~$195k cash-out refi (75% LTV) — recoverable capital for the next deal without selling this one.
Negotiation context
- It's been on market 39 days — a 3% lower offer ($1.31M) is reasonable based on typical stale-listing flexibility.
- Current owner paid $1.12M; 21% above their basis — modest negotiation headroom, anchor on the comps not their cost.
Risks & watch-outs
- Watch-outs: built in 1910 — expect roof / HVAC / electrical / plumbing capex.
- Climate carrying-cost: major wind risk, 62% chance of damaging wind over 30y; extreme-heat days projected 7→15/yr by 2055 (HVAC capex compounding) — expect insurance premiums to compound above CPI over the hold.
Questions for the listing agent
- What do current leases actually rent for vs. the listed asking? Can we see a recent rent roll and the last 12 months of T-12 income?
- It's been on market 39 days. Have you received any prior offers? Is the seller open to a 59% concession, seller financing, or rate buy-down credit?
- Built in 1910 — when were the roof, HVAC, electrical panel, plumbing, and water heater last replaced?
- Is there a deadline driving the sale (1031 exchange, divorce, estate, relocation)? That informs how much negotiation room exists.
- Schools are B-rated — typically a magnet for longer-tenancy family renters. What's the average tenant stay here, and is there a school-zone premium baked into asking?
- Crime grade is F in this area — have there been break-ins, vandalism, or insurance claims at this property in the last 3 years? What carrier currently insures it and at what premium?
- The area grade is low — what's the realistic commute time and amenity access for the typical tenant pool here? Any planned neighborhood developments (good or bad) we should know about?
- What's the average days-on-market for RENTAL listings here right now (not sales)? A rising rental-DOM trend means longer vacancies and softer asking-rent achievability than the comps imply.
- What's the recent tenant-quality profile in this submarket — average credit score on applications, eviction rate, late-payment / NSF rate, and stable-employment percentage? A property-management company in the area should have these aggregated.
- How much new apartment / multifamily construction is in the pipeline within 1–3 miles? Heavy new supply (>2% of stock underway) typically softens rents 12–24 months out; light construction supports rent growth.
Investment metrics
- 1% rule
- 0.41% ✗
- Cap rate
- 3.17%
- Cash-on-cash
- -11.14%
- DSCR
- 0.50
- GRM
- 20.3
CMA / ARV
No comps found within radius.
Projected returns pro-forma
8.35% appreciation · 6.26% rent growth · sell at horizon
- IRR
- 13.1%
- Equity multiple
- 2.01×
- Total profit
- $380,651
- Equity at exit
- $1,057,654
- IRR
- 13.8%
- Equity multiple
- 4.48×
- Total profit
- $1,315,028
- Equity at exit
- $2,130,731
Cash invested: $378,000 (down + closing). Projections, not guarantees.
Landlord ↔ Tenant lean methodology
- Overall (CITY)
- 0 Strongly Tenant-Friendly
- State New York
- 15 Strongly Tenant-Friendly · D+10
- County
- — inherits STATE
- City New York
- 0 Strongly Tenant-Friendly · D+34
ZIP-level market 11232
- Home prices YoY
- 2.0%
- Rents YoY
- 6.3%
- Active inventory
- 87
- Price-to-rent
- 40.5×
Monthly cashflow live
- Estimated rent
- $5,550 medium interval (Pro) →
- Mortgage (P&I)
- −$7,080
- Tax from tax record
- −$253 /mo · $3,033/yr
- Insurance
- −$562
- HOA
- −$0
- Vacancy / Maint / Mgmt
- −$1,166
- Net cashflow
- $-3,510
Break-even live
Sensitivity live
| Price | -10% $-2,746 | -5% $-3,128 | +0% $-3,510 | +5% $-3,892 | +10% $-4,275 |
|---|---|---|---|---|---|
| Rent | -10% $-3,949 | -5% $-3,730 | +0% $-3,510 | +5% $-3,291 | +10% $-3,072 |
| Rate | -1.0pp $-2,830 | -0.5pp $-3,167 | base $-3,510 | +0.5pp $-3,860 | +1.0pp $-4,216 |
2-unit breakdown (identical units grouped — click to expand)
| Units | Beds | Baths | Est. rent |
|---|---|---|---|
| 2× units | 2 | 1 | $5,550 |
| #1 | 2 | 1 | $2,775 |
| #2 | 2 | 1 | $2,775 |
| Total (2 units) | $5,550 | ||
UW: 25.0% down · 7.5% · 30yr · 1.5% tax · 5.0% vac · 8.0% maint · 8.0% mgmt
Financing live
Cash to close
- Down payment
- $337,500
- Closing costs
- $40,500
- Reserves months
- —
- Total cash needed
- —
Loan-product check · same deal, 3 products live
Conventional
25% down · 7.5% · 30yr
- Down + closing
- —
- Monthly P&I
- —
- Monthly cashflow
- —
- DSCR
- —
- Eligible?
- —
Personal DTI + credit; lowest rate.
DSCR
20% down · 8.5% · 30yr
- Down + closing
- —
- Monthly P&I
- —
- Monthly cashflow
- —
- DSCR
- —
- Eligible?
- —
No personal income docs; deal must DSCR.
Hard money
10% down · 12.0% · 12mo
- Down + closing
- —
- Monthly P&I
- —
- Monthly cashflow
- —
- DSCR
- —
- Eligible?
- —
Short-term bridge; refi at stabilization.
Rent comps 1 comps
| Address | Beds | Baths | Sqft | Rent | $/sqft | DOM | Units | Dist |
|---|---|---|---|---|---|---|---|---|
| 1656 8th Ave Unit 2nd floor Brooklyn, NY | 1.0 | 1.0 | 1200 | $3,900 | $3.25 | 26d | 1 | 0.84mi |
Listing history 25 events
-
2026-06-21days on market $1,350,000 Active 39 DOM
-
2026-06-18days on market $1,350,000 Active 36 DOM
-
2026-06-17days on market $1,350,000 Active 35 DOM
-
2026-06-16days on market $1,350,000 Active 34 DOM
-
2026-06-15days on market $1,350,000 Active 33 DOM
-
2026-06-13days on market $1,350,000 Active 31 DOM
-
2026-06-10days on market $1,350,000 Active 27 DOM
-
2026-06-08days on market $1,350,000 Active 26 DOM
-
2026-06-08days on market $1,350,000 Active 25 DOM
-
2026-06-04days on market $1,350,000 Active 22 DOM
-
2026-06-03days on market $1,350,000 Active 21 DOM
-
2026-06-02days on market $1,350,000 Active 20 DOM
-
2026-06-01days on market $1,350,000 Active 19 DOM
-
2026-05-31days on market $1,350,000 Active 18 DOM
-
2026-05-13$1,350,000 Active
-
2021-08-02soldstatus $1,120,000
-
2012-08-16soldstatus $450,000
-
1996-10-11soldstatus $110,000
-
1993-09-10soldstatus $105,000
-
1993-09-10soldstatus $105,000
-
1992-05-08soldstatus $147,000
-
1992-05-08soldstatus $70,000
-
1987-05-13soldstatus $140,000
-
1986-07-16soldstatus $57,500
-
1984-06-01soldstatus $20,000
ⓘ Source: listings_history table (triggers on properties + properties_extension) + one-shot
backfill from property_details.listing_events for pre-trigger history.
Tax reassessment forecast NY · Partial reset (capped growth)
- Current annual tax
- $3,033 · $253/mo
- Projected year-2 tax
- $12,924 · $1,077/mo
- Expected delta
- +$9,891/yr (+$824/mo · 326.1%)
ⓘ Screening estimate from a state-policy table — verify with the county assessor before closing.
Climate risk First Street
- Flood 1/10 Low FEMA zone X (unshaded) · 0% chance over 30 yrs
- Wildfire 1/10 Low
- Heat 7/10 Severe 7 d/yr ≥99°F today · 15 d/yr by 30 yrs out
- Wind 6/10 Major 62% chance of damaging wind over 30 yrs
- Air quality 4/10 Moderate 5 unhealthy d/yr today · 7 by 30 yrs out
Nearby sold comps map
Loading sold comps map…
Walkable amenities ~0.75 mi
Loading nearby amenities…
Taxation est. · year 1
- Rental income
- $66,600
- − Mortgage interest
- −$75,621
- − Property taxes
- −$3,033
- − Insurance
- −$6,750
- − Repairs & maintenance
- −$5,328
- − Management
- −$5,328
- − Depreciation
- −$39,273
- Taxable loss
- −$68,733
- Est. tax savings @ 24.0%
- +$16,496
- After-tax cash flow
- $-25,628/yr
For passive investors: Depreciation is non-cash, so a rental often shows a tax loss while cash-flowing — sheltering income. Rental losses are passive: they offset passive income freely, and up to $25,000/yr can offset ordinary (W-2) income if you actively participate and your MAGI is under $100k (phasing out to $0 by $150k); unused losses carry forward. On sale, claimed depreciation is recaptured at up to 25%, and gains may owe capital-gains tax (a 1031 exchange can defer both). Figures are a year-1 estimate at your 24.0% rate — not tax advice; consult a CPA.
Schools (NCES district)
No district data.
Livability — New York
- Score
- 75/100
- State rank
- #268
- US rank
- #4188
Category grades
Schools grade is shown separately in the Schools card above.
Census & demographics
- Census place
- New York, NY
- County
- Kings County · 2,614,986 people
- City population
- 7,731,280
- Metro
- New York-Newark-Jersey City, NY-NJ-PA
- Population (ZIP)
- 27,816
- Household income
- $90,891
- Rent vs Own
- Severe rent burden
- 1713.0
Population outlook (Kings County) Hauer SSP2
- Today (2025)
- 2,847,441 people
- By 2030
- 2,937,006 · +3.1%
- By 2040
- 3,095,491 · +8.7%
- By 2050
- 3,228,968 · +13.4%
- By 2075
- 3,321,723 · +16.7%
- By 2100
- 3,111,387 · +9.3%
Race, ethnicity, and origin ACS 2023
- Neighborhood character
- Diverse neighborhood (Simpson 0.65)
- Race & ethnicity
- Hispanic / Latino 52% White 23% Asian 15% Two or more races 12% Black 6% Native American 4%
- Hispanic origin (detail)
- Mexican 20% Puerto Rican 9% Dominican 7%
- Common ancestry
- Romanian 3% Scotch-Irish 1% Lithuanian 1%
- Foreign-born
- 38% · Canada, China, Jamaica
- Languages at home
- 40% English-only · Spanish 44% Chinese 9% Other Asian/Pacific 1%
Political lean MEDSL · Kings
- 2024 margin
- Solid D (+44.0) · D 72.0% · R 28.0%
- 2008→2024 swing
- -15.5pp toward R · 2008: 59.4pp · 2024: 44.0pp
- All cycles
- 2024: D+44.0 2020: D+54.8 2016: D+61.8 2012: D+63.9 2008: D+59.4
Not yet ingested
- Civics
- —
Market trends
- HPI YoY
- ▲ 8.35%
- Current HPI
- 422.0849
- Rent YoY
- ▲ 6.26%
- Metro
- New York-Newark-Jersey City, NY-NJ-PA
- State GDP YoY
- ▲ 2.60%
- F500 in state
- 92
Industry mix (Fortune 500 HQ in NY)
| Industry | F500 HQs | Revenue |
|---|---|---|
| Financial Services | 10 | $950B |
|
||
| Consumer Goods | 9 | $162B |
|
||
| Insurance | 4 | $225B |
|
||
| Telecommunications | 2 | $144B |
|
||
| Pharmaceuticals | 2 | $112B |
|
||
| Media / Entertainment | 2 | $69B |
|
||
Price history
+6650.0% since first listed11 events — show timeline
- 2026-05-13 Listed $1,350,000 RLS at REBNY
- 2021-08-02 Sold (Public Records) $1,120,000 Public Records
- 2012-08-16 Sold (Public Records) $450,000 Public Records
- 1996-10-11 Sold (Public Records) $110,000 Public Records
- 1993-09-10 Sold (Public Records) $105,000 Public Records
- 1993-09-10 Sold (Public Records) $105,000 Public Records
- 1992-05-08 Sold (Public Records) $70,000 Public Records
- 1992-05-08 Sold (Public Records) $147,000 Public Records
- 1987-05-13 Sold (Public Records) $140,000 Public Records
- 1986-07-16 Sold (Public Records) $57,500 Public Records
- 1984-06-01 Sold (Public Records) $20,000 Public Records
Property tax history
+6.3%/yrLatest (2025): $3,033 · +3.3% YoY. Source: county tax records.
Cash-flow waterfall
monthlySold comps — $/sqft
last 12 mo · ≤1 miLoading sold comps…