 🏗️ New Construction
519 Hunters Creek Cir · Madison, MS
Flood risk 1/10 · Minimal
- FEMA flood zone
- X (unshaded)
- Chance of flooding over 30 yrs
- 0.0%
- Est. flood insurance / yr
- $507 – $1,088
Fire risk 1/10 · Minimal
- Est. fire insurance / yr
- $1,241 – $2,305
Heat risk 7/10 · Major
- Hot days now (above 108°F)
- 7 days/yr
- Hot days in 30 yrs
- 20 days/yr
Wind risk 8/10 · Major
- Chance of severe wind over 30 yrs
- 80.0%
Air-quality risk 2/10 · Minimal
- Unhealthy air days now
- 0 days/yr
- Unhealthy air days in 30 yrs
- 1 days/yr
Risk factors via First Street. Map © Google.
Why this score? — see what drove the C grade
The composite is a weighted blend of 9 inputs, each scored 0–100. Each bar is that input's sub-score; the figure is the points it added to the 100-point composite (weight × sub-score).
- Cash flow +22.1/30.0
- ARV discount +7.5/15.0
- DSCR +7.1/10.0
- 1% rule +5.1/10.0
- Schools +4.8/10.0
- Livability +4.0/5.0
- Rent growth +3.2/5.0
- Condition / age +2.5/5.0
- Appreciation +0.0/10.0
$265,000
🖨 Deal sheet 📄 Offer letter ✓ Due diligence
Listing remarks MLS
Wonderful corner lot, huge trees, 3 car garage and workshop, potting shed, full length porch, covered rear patio, beautifully maintained. Vaulted ceiling in family room, formal DR. Better Hurry!!!!!
Key facts
- Interior renovation
- Electric fireplace
- Corner lot
Tags
Property features AI
Finance
- Other: Property listed as under construction
Exterior
- Parking: Attached enclosed garage (2 spaces); Driveway; Garage faces side
- Utilities: Public water; Public sewer; Electricity connected; Cable available
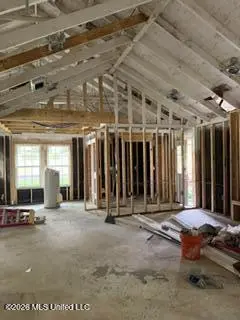
- Home design: Single-family house; One level; Under construction
- Construction: Brick and HardiPlank exterior; Architectural shingle roof; Slab foundation; Built area approximately 1,850 (source: owner)
- Exterior features: Front porch; Slab patio/porch; Private yard; Fenced yard; Level lot; Corner lot
Interior
- Kitchen: Electric range
- Flooring: Luxury vinyl flooring
- Bathrooms: 2 full bathrooms
- Heating & cooling: Central heating; Heating via fireplace; Central air conditioning
- Interior features: Bar; Vaulted ceilings; Fireplace with insert
Neighborhood map
What this means for you Summary
Snapshot
- This is a 3-bed/3.0-bath single-family listed at $265k.
Deal economics
- At list price, monthly cash flow is $397 ($5k/yr) — positive.
- The deal already cash-flows at list — no discount required.
- To meet the 1% rule (rent ≥ 1% of price), the offer needs to be $248k (6.5% below list).
- Recommended offer: $248k (6.5% below list) — sets the bar for 1% rule.
- Cap rate 8.2% vs local median 3.7% in Madison — top-decile yield for the area; either an underpriced asset or a hidden risk that comps aren't pricing in. Stress-test before assuming the spread holds.
Location & tenants
- Location reads 81/100 on livability (#4 in MS, #1,556 nationally) — a professional / high-income tenant draw. Strengths: crime A+, employment A+, housing A+; Watch: amenities D-, commute F.
- Madison County School District (rural): math 54% / reading 54% proficiency, ranked #3 of 130 in MS (top 2%) — acceptable for families but not a draw, mixed tenant base, ~2y average lease.
- Zoned schools: Madison Avenue Lower Elementary (437 students, 99% FRL) — zoned schools average 99% FRL vs 29% district-wide (70 pts higher); higher-poverty schools than district average — tighter screening recommended.
- Market conditions: Rents rising (+2.6%/yr); 628 active listings in the ZIP; 1 comparable units currently listed for rent nearby; high-income renter base; 553 units permitted in Madison County in 2024 (0 in 5+ unit buildings).
Forward outlook
- Local home prices are declining (-3.0%/yr); year-one equity from $2k of loan paydown is wiped out by about $7k of value loss. Plan a longer hold.
- Madison County population projected at +34% by 2050 — long-run rental-demand tailwind backs the buy-and-hold thesis.
Negotiation context
- It's been on market 15 days — a 2% lower offer ($261k) is reasonable based on typical stale-listing flexibility.
- 2 sale attempts since 17y ago with the ask held roughly flat each time — persistent listings suggest the price (not the market) is what's stuck; bring a comps-based counter.
Risks & watch-outs
- Climate carrying-cost: severe wind risk, 80% chance of damaging wind over 30y; extreme-heat days projected 7→20/yr by 2055 (HVAC capex compounding) — expect insurance premiums to compound above CPI over the hold.
Questions for the listing agent
- Is there a deadline driving the sale (1031 exchange, divorce, estate, relocation)? That informs how much negotiation room exists.
- Schools are A-rated — typically a magnet for longer-tenancy family renters. What's the average tenant stay here, and is there a school-zone premium baked into asking?
- What's the average days-on-market for RENTAL listings here right now (not sales)? A rising rental-DOM trend means longer vacancies and softer asking-rent achievability than the comps imply.
- What's the recent tenant-quality profile in this submarket — average credit score on applications, eviction rate, late-payment / NSF rate, and stable-employment percentage? A property-management company in the area should have these aggregated.
- How much new for-sale + rental construction is in the pipeline within 1–3 miles? Heavy new supply typically softens prices + rents 12–24 months out; constrained supply supports both.
Investment metrics
- 1% rule
- 1.01% ✓
- Cap rate
- 8.23%
- Cash-on-cash
- 6.90%
- DSCR
- 1.31
- GRM
- 8.3
CMA / ARV
- ARV (on-the-fly)
- $246,402
- Comps found
- 12
Show comp detail 12 sales within ~0.75 mi
| Address | Dist | Beds/Ba | Sqft | Sold | Price | $/sf | Match |
|---|---|---|---|---|---|---|---|
| 429 S Pin Oak Dr | 0.25mi | 3/2.0 | 1,454 (-0%) | 3mo | $247,500 | $170 | 81 |
| 368 Post Oak Rd | 0.33mi | 3/2.0 | 1,470 (+1%) | 7mo | $250,000 | $170 | 73 |
| 636 Live Oak Dr | 0.41mi | 3/2.0 | 1,474 (+1%) | 3mo | $249,000 | $169 | 72 |
| 104 Willow Ct | 0.33mi | 3/2.0 | 1,384 (-5%) | 2mo | $234,900 | $170 | 71 |
| 112 Armonde Ct | 0.22mi | 2/2.5 (-1) | 1,563 (+7%) | 1mo | $259,000 | $166 | 70 |
| 124 Azalea Cir | 0.44mi | 3/2.0 | 1,456 (-0%) | 10mo | $229,500 | $158 | 67 |
| 122 Eastwood Dr | 0.52mi | 3/2.0 | 1,474 (+1%) | 8mo | $245,000 | $166 | 63 |
| 143 Azalea Cir | 0.40mi | 3/2.0 | 1,582 (+8%) | 1mo | $265,000 | $168 | 62 |
| 429 Brentwood Dr | 0.50mi | 3/2.0 | 1,535 (+5%) | 10mo | $255,000 | $166 | 56 |
| 143 Glenwood Dr | 0.58mi | 3/2.0 | 1,400 (-4%) | 9mo | $249,000 | $178 | 55 |
| 1022 N Azalea Dr | 0.63mi | 3/2.0 | 1,544 (+6%) | 5mo | $245,000 | $159 | 53 |
| 409 Hawthorne Dr | 0.75mi | 3/2.0 | 1,550 (+6%) | 4mo | $274,999 | $177 | 48 |
Match score weights: distance 35% · size 25% · config 20% · recency 20%. Top-matched comps best support the ARV.
Projected returns pro-forma
-3.0% appreciation · 2.61% rent growth · sell at horizon
- IRR
- -6.1%
- Equity multiple
- 0.77×
- Total profit
- $-15,675
- Equity at exit
- $36,739
- IRR
- 3.0%
- Equity multiple
- 1.21×
- Total profit
- $14,744
- Equity at exit
- $21,304
Cash invested: $68,993 (down + closing). Projections, not guarantees.
Landlord ↔ Tenant lean methodology
- Overall (STATE)
- 90 Strongly Landlord-Friendly
- State Mississippi
- 90 Strongly Landlord-Friendly · R+11
- County
- — inherits STATE
- City
- — inherits STATE
ZIP-level market 39110
- Home prices YoY
- -28.3%
- Rents YoY
- 2.6%
- Active inventory
- 628
- Price-to-rent
- 8.9×
Monthly cashflow live
- Estimated rent
- $2,477 medium interval (Pro) →
- Mortgage (P&I)
- −$1,292
- Tax from tax record
- −$165 /mo · $1,981/yr
- Insurance
- −$103
- HOA
- −$0
- Vacancy / Maint / Mgmt
- −$520
- Net cashflow
- $397
Break-even live
UW: 25.0% down · 7.5% · 30yr · 1.5% tax · 5.0% vac · 8.0% maint · 8.0% mgmt
Financing live
Cash to close
- Down payment
- $61,600
- Closing costs
- $7,392
- Reserves months
- —
- Total cash needed
- —
Loan-product check · same deal, 3 products live
Conventional
25% down · 7.5% · 30yr
- Down + closing
- —
- Monthly P&I
- —
- Monthly cashflow
- —
- DSCR
- —
- Eligible?
- —
Personal DTI + credit; lowest rate.
DSCR
20% down · 8.5% · 30yr
- Down + closing
- —
- Monthly P&I
- —
- Monthly cashflow
- —
- DSCR
- —
- Eligible?
- —
No personal income docs; deal must DSCR.
Hard money
10% down · 12.0% · 12mo
- Down + closing
- —
- Monthly P&I
- —
- Monthly cashflow
- —
- DSCR
- —
- Eligible?
- —
Short-term bridge; refi at stabilization.
Rent comps 1 comps
| Address | Beds | Baths | Sqft | Rent | $/sqft | DOM | Units | Dist |
|---|---|---|---|---|---|---|---|---|
| 200 Woodgreen Dr Madison, MS | 2.0 | 2.0 | 970 | $2,400 | $2.47 | 23d | 1 | 1.21mi |
Listing history 10 events
-
2026-06-18days on market $265,000 Active 15 DOM
-
2026-06-17days on market $265,000 Active 14 DOM
-
2026-06-16days on market $265,000 Active 13 DOM
-
2026-06-15days on market $265,000 Active 12 DOM
-
2026-06-14days on market $265,000 Active 10 DOM
-
2026-06-10days on market $265,000 Active 7 DOM
-
2026-06-09days on market $265,000 Active 6 DOM
-
2026-06-08days on market $265,000 Active 5 DOM
-
2026-06-07remarks 699-char remark
-
2026-06-07$265,000 Active 4 DOM
ⓘ Source: listings_history table (triggers on properties + properties_extension) + one-shot
backfill from property_details.listing_events for pre-trigger history.
Tax reassessment forecast MS · Resets to sale price
- Current annual tax
- $1,981 · $165/mo
- Projected year-2 tax
- $2,094 · $174/mo
- Expected delta
- +$113/yr (+$9/mo · 5.7%)
ⓘ Screening estimate from a state-policy table — verify with the county assessor before closing.
Climate risk First Street
- Flood 1/10 Low FEMA zone X (unshaded) · 0% chance over 30 yrs
- Wildfire 1/10 Low
- Heat 7/10 Severe 7 d/yr ≥108°F today · 20 d/yr by 30 yrs out
- Wind 8/10 Severe 80% chance of damaging wind over 30 yrs
- Air quality 2/10 Low 0 unhealthy d/yr today · 1 by 30 yrs out
Nearby sold comps map
Loading sold comps map…
Walkable amenities ~0.75 mi
Loading nearby amenities…
Taxation est. · year 1
- Rental income
- $29,722
- − Mortgage interest
- −$13,802
- − Property taxes
- −$1,981
- − Insurance
- −$1,232
- − Repairs & maintenance
- −$2,378
- − Management
- −$2,378
- − Depreciation
- −$7,168
- Taxable income
- $783
- Est. tax owed @ 24.0%
- −$188
- After-tax cash flow
- $4,573/yr
For passive investors: Depreciation is non-cash, so a rental often shows a tax loss while cash-flowing — sheltering income. Rental losses are passive: they offset passive income freely, and up to $25,000/yr can offset ordinary (W-2) income if you actively participate and your MAGI is under $100k (phasing out to $0 by $150k); unused losses carry forward. On sale, claimed depreciation is recaptured at up to 25%, and gains may owe capital-gains tax (a 1031 exchange can defer both). Figures are a year-1 estimate at your 24.0% rate — not tax advice; consult a CPA.
Schools (NCES district)
- District
- Madison County School District
- NCES district ID
- 2802790
- Math proficiency
- 54% ▼ -7.00%
- Reading proficiency
- 54% ▼ -7.00%
- Median HH income
- $70,579
- Composite
- 48.08/100
- National rank
- #2188
- State rank
- #3 of 130 in MS
Livability — Madison
- Score
- 81/100
- State rank
- #4
- US rank
- #1556
Category grades
Schools grade is shown separately in the Schools card above.
Census & demographics
- Census place
- Madison, MS
- County
- Madison County · 75,005 people
- City population
- 50,443
- Metro
- Jackson, MS
- Population (ZIP)
- 50,443
- Household income
- $125,506
- Rent vs Own
- Severe rent burden
- 227.0
Population outlook (Madison County) Hauer SSP2
- Today (2025)
- 122,509 people
- By 2030
- 131,737 · +7.5%
- By 2040
- 148,930 · +21.6%
- By 2050
- 164,300 · +34.1%
- By 2075
- 197,495 · +61.2%
- By 2100
- 211,429 · +72.6%
Race, ethnicity, and origin ACS 2023
- Neighborhood character
- Predominantly White (76%)
- Race & ethnicity
- White 76% Black 15% Asian 4% Two or more races 3% Hispanic / Latino 2%
- Common ancestry
- Italian 6% Slovak 3% Lithuanian 3%
- Foreign-born
- 5% · China, Canada
- Languages at home
- 92% English-only · Spanish 2% Other Indo-European 2% Chinese 1%
Political lean MEDSL · Madison
- 2024 margin
- R (+17.3) · D 40.8% · R 58.0% · Other 1.2%
- 2008→2024 swing
- -1.7pp toward R · 2008: -15.6pp · 2024: -17.3pp
- All cycles
- 2024: R+17.3 2020: R+11.8 2016: R+16.1 2012: R+15.7 2008: R+15.6
Not yet ingested
- Civics
- —
Market trends
- HPI YoY
- ▼ -60.99%
- Current HPI
- 154.6909
- Rent YoY
- ▲ 2.61%
- Metro
- Jackson, MS
- State GDP YoY
- —
- F500 in state
- 0
Price history
+104.0% since first listed8 events — show timeline
- 2026-06-03 Listed $265,000 MLSU
- 2018-05-11 Sold (Public Records) — Public Records
- 2010-07-28 Sold (Public Records) — Public Records
- 2009-10-08 Sold (Public Records) — Public Records
- 2009-10-08 Sold (Public Records) — Public Records
- 2009-10-01 Sold (MLS) — MLSU
- 2009-09-02 Listed $129,900 MLSU
- 1981-02-05 Sold (Public Records) — Public Records
Property tax history
+4.3%/yrLatest (2025): $1,981 · +0.0% YoY. Source: county tax records.
Cash-flow waterfall
monthlySold comps — $/sqft
last 12 mo · ≤1 miLoading sold comps…