 9-Plex
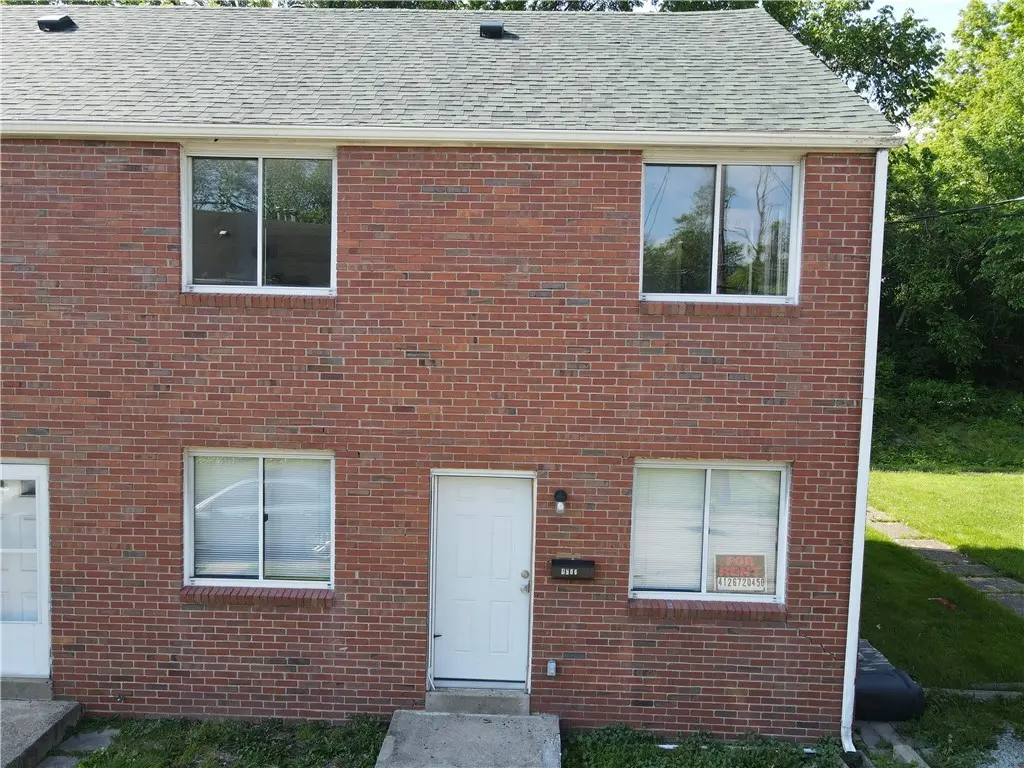
507 Washington Ave · Clairton, PA
Flood risk 1/10 · Minimal
- FEMA flood zone
- X (unshaded)
- Chance of flooding over 30 yrs
- 0.0%
- Est. flood insurance / yr
- $507 – $1,088
Fire risk 1/10 · Minimal
- Est. fire insurance / yr
- $511 – $949
Heat risk 4/10 · Minor
- Hot days now (above 98°F)
- 7 days/yr
- Hot days in 30 yrs
- 18 days/yr
Wind risk 2/10 · Minimal
- Chance of severe wind over 30 yrs
- —
Air-quality risk 5/10 · Moderate
- Unhealthy air days now
- 8 days/yr
- Unhealthy air days in 30 yrs
- 8 days/yr
Risk factors via First Street. Map © Google.
Why this score? — see what drove the C grade
The composite is a weighted blend of 9 inputs, each scored 0–100. Each bar is that input's sub-score; the figure is the points it added to the 100-point composite (weight × sub-score).
- Cash flow +25.5/30.0
- DSCR +8.5/10.0
- ARV discount +7.5/15.0
- 1% rule +6.7/10.0
- Rent growth +5.0/5.0
- Livability +3.2/5.0
- Condition / age +2.5/5.0
- Schools +1.1/10.0
- Appreciation +0.0/10.0
$820,000
🖨 Deal sheet 📄 Offer letter ✓ Due diligence
Multi-family units
County records classify this as Multi-Family (5+ Unit). Listing-text estimate: 9 units. confirmed
5+ unit building — per-unit beds/baths from public records are typically unavailable; the breakdown below (if shown) is an estimate from the listing text.
Listing remarks
18 separately deeded properties located in one neighborhood in Clairton, PA. Mix of (8) 2 and (10) 3 bedroom units. 12 units are tenant occupied. 6 units are vacant. 39 minutes from Downtown Pittsburgh.
Key facts
- 3,820 sq ft lot
- Built 1940
- Listed 21 days
Property features AI
Finance
- Financial info: Actual rents listed for individual unit types (examples): $1,567, $1,825, $800, $962, $1,354, $1,027, $1,251, $1,222, $1,416
Exterior
- Parking: Off-street parking
- Home design: Multi-family building
- Construction: Brick construction; Asphalt roof
- Exterior features: Zoned R (residential)
Interior
- Bedrooms: Several units with 3 bedrooms; Several units with 2 bedrooms
- Bathrooms: Units have 1 full bathroom each
- Interior features: Multiple 2- and 3-bedroom units (10 total units in the building; 18 units in the community overall)
Neighborhood map
What this means for you Summary
Snapshot
- This is a 9 × 1-bed/?-bath units multifamily listed at $820k.
Deal economics
- At list price, monthly cash flow is $2k ($23k/yr) — positive. Per door: $214/mo.
- The deal already cash-flows at list — no discount required.
- Meets the 1% rule at list price ($10k rent vs $820k).
- Recommended offer: $808k (1.5% below list) — sets the bar for market timing.
- Cap rate 9.1% vs local median 12.7% in Clairton — below-typical yield; the buyer is paying a premium for something (appreciation thesis, condition, location) that the cap rate doesn't capture.
Location & tenants
- Location reads 63/100 on livability (#1,308 in PA) — a middle-class / working-renter tenant base. Strengths: cost of living A+, housing A; Watch: crime C-, health & safety D+, schools F.
- Clairton City SD (suburban): math 7% / reading 21% proficiency, ranked #520 of 539 in PA (top 96%) — low school quality limits family demand, transient renter base, plan for 1-2y turnover; 82% free/reduced lunch — lower-income household profile, screen leases tightly.
- Market conditions: Rents rising fast (+10.5%/yr); 94 active listings in the ZIP; 19 comparable units currently listed for rent nearby; rentals lingering (median 44d on market — plan ~5-8 weeks vacancy on turnover, expect pricing pressure); 63% of comp listings sitting > 30 days — soft ceiling on asking rent; solid renter incomes; 2,996 units permitted in Allegheny County in 2024 (1,588 in 5+ unit buildings).
- At $9,606/mo this rent would consume 151% of the median local household income ($77k/yr) (locally 572% of renters already pay >50% of income on rent) — very limited rent-growth headroom before tenants either downsize or default.
Forward outlook
- Local home prices are declining (-3.0%/yr); year-one equity from $6k of loan paydown is wiped out by about $25k of value loss. Plan a longer hold.
- At projected returns (-3.0% appreciation + 8.0% rent growth), your $230k cash investment doubles in ~8 years — after that, you're playing with house money.
Negotiation context
- It's been on market 21 days — a 2% lower offer ($808k) is reasonable based on typical stale-listing flexibility.
- Current owner paid $164k; list at $820k implies a 400% gain — meaningful room to come down on a strong offer.
Risks & watch-outs
- Watch-outs: built in 1940 — expect roof / HVAC / electrical / plumbing capex.
Questions for the listing agent
- Can we see the unit-by-unit rent roll, current vacancy, and any below-market leases? What's the average tenancy length?
- What capital expenditures (roof, boiler, parking lot, exteriors) have been made in the last 5 years, and what's planned in the next 2?
- Built in 1940 — when were the roof, HVAC, electrical panel, plumbing, and water heater last replaced?
- Is there a deadline driving the sale (1031 exchange, divorce, estate, relocation)? That informs how much negotiation room exists.
- Schools are F-rated, which usually means shorter tenancies and higher turnover. Who's the typical renter profile here, and what's been the actual vacancy rate?
- What's the average days-on-market for RENTAL listings here right now (not sales)? A rising rental-DOM trend means longer vacancies and softer asking-rent achievability than the comps imply.
- What's the recent tenant-quality profile in this submarket — average credit score on applications, eviction rate, late-payment / NSF rate, and stable-employment percentage? A property-management company in the area should have these aggregated.
- How much new apartment / multifamily construction is in the pipeline within 1–3 miles? Heavy new supply (>2% of stock underway) typically softens rents 12–24 months out; light construction supports rent growth.
Investment metrics
- 1% rule
- 1.17% ✓
- Cap rate
- 9.11%
- Cash-on-cash
- 10.04%
- DSCR
- 1.45
- GRM
- 7.1
CMA / ARV
No comps found within radius.
Projected returns pro-forma
-3.0% appreciation · 8.0% rent growth · sell at horizon
- IRR
- 4.3%
- Equity multiple
- 1.18×
- Total profit
- $40,442
- Equity at exit
- $122,265
- IRR
- 18.0%
- Equity multiple
- 2.85×
- Total profit
- $424,479
- Equity at exit
- $70,899
Cash invested: $229,600 (down + closing). Projections, not guarantees.
Landlord ↔ Tenant lean methodology
- Overall (STATE)
- 62 Landlord-Friendly
- State Pennsylvania
- 62 Landlord-Friendly · EVEN
- County
- — inherits STATE
- City
- — inherits STATE
ZIP-level market 15025
- Home prices YoY
- -34.4%
- Rents YoY
- 10.5%
- Active inventory
- 94
- Price-to-rent
- 64.0×
Monthly cashflow live
- Estimated rent
- $9,606 high interval (Pro) →
- Mortgage (P&I)
- −$4,300
- Tax est. 1.5%
- −$1,025 /mo · $12,300/yr
- Insurance
- −$342
- HOA
- −$0
- Vacancy / Maint / Mgmt
- −$2,017
- Net cashflow
- $1,922
Break-even live
9-unit breakdown (identical units grouped — click to expand)
| Units | Beds | Baths | Est. rent |
|---|---|---|---|
| 9× units | 1 | — | $9,603 |
| #1 | 1 | — | $1,067 |
| #2 | 1 | — | $1,067 |
| #3 | 1 | — | $1,067 |
| #4 | 1 | — | $1,067 |
| #5 | 1 | — | $1,067 |
| #6 | 1 | — | $1,067 |
| #7 | 1 | — | $1,067 |
| #8 | 1 | — | $1,067 |
| #9 | 1 | — | $1,067 |
| Total (9 units) | $9,606 | ||
UW: 25.0% down · 7.5% · 30yr · 1.5% tax · 5.0% vac · 8.0% maint · 8.0% mgmt
Financing live
Cash to close
- Down payment
- $205,000
- Closing costs
- $24,600
- Reserves months
- —
- Total cash needed
- —
Loan-product check · same deal, 3 products live
Conventional
25% down · 7.5% · 30yr
- Down + closing
- —
- Monthly P&I
- —
- Monthly cashflow
- —
- DSCR
- —
- Eligible?
- —
Personal DTI + credit; lowest rate.
DSCR
20% down · 8.5% · 30yr
- Down + closing
- —
- Monthly P&I
- —
- Monthly cashflow
- —
- DSCR
- —
- Eligible?
- —
No personal income docs; deal must DSCR.
Hard money
10% down · 12.0% · 12mo
- Down + closing
- —
- Monthly P&I
- —
- Monthly cashflow
- —
- DSCR
- —
- Eligible?
- —
Short-term bridge; refi at stabilization.
Rent comps 19 comps
| Address | Beds | Baths | Sqft | Rent | $/sqft | DOM | Units | Dist |
|---|---|---|---|---|---|---|---|---|
| 127 Constitution Cir Clairton, PA | 2.0 | 1.0 | 1063 | $1,275 | $1.20 | 10d | 1 | 0.16mi |
| 127 Constitution Cir Clairton, PA | 2.0 | 1.0 | 972 | $1,275 | $1.31 | 1d | 1 | 0.16mi |
| 753 East Dr Clairton, PA | 3.0 | 1.0 | 1000 | $1,100 | $1.10 | 44d | 1 | 0.26mi |
| 618 Farnsworth Ave Clairton, PA | 2.0 | 1.0 | 896 | $1,050 | $1.17 | 44d | 1 | 0.34mi |
| 601 Farnsworth Ave Clairton, PA | 2.0 | 1.0 | 1004 | $995 | $0.99 | 4d | 1 | 0.34mi |
| 505 Wylie Ave Clairton, PA | 2.0 | 1.0 | 791 | $1,500 | $1.90 | 1d | 1 | 0.38mi |
| 701-703 Waddell Ave Clairton, PA | 4.0 | 1.0 | 1200 | $1,850 | $1.54 | 1d | 1 | 0.50mi |
| 866 Vankirk St Unit 1 Clairton, PA | 2.0 | 1.5 | 1440 | $1,200 | $0.83 | 44d | 1 | 0.51mi |
| 874 Vankirk St Clairton, PA | 3.0 | 1.5 | 1296 | $1,150 | $0.89 | 44d | 1 | 0.52mi |
| 350 Wylie Ave Unit 1 Clairton, PA | 2.0 | 1.0 | 1152 | $1,050 | $0.91 | 44d | 1 | 0.54mi |
| 927 Vankirk St Clairton, PA | 2.0 | 1.0 | 840 | $1,150 | $1.37 | 12d | 1 | 0.58mi |
| 929 Vankirk St Unit 1 Clairton, PA | 2.0 | 1.5 | 810 | $1,050 | $1.30 | 44d | 1 | 0.59mi |
| 809 3rd St Unit 194 Clairton, PA | 2.0 | 1.5 | 1244 | $1,081 | $0.87 | 44d | 1 | 0.67mi |
| 809 3rd St Unit 624 Clairton, PA | 2.0 | 1.5 | 1240 | $1,008 | $0.81 | 44d | 1 | 0.67mi |
| 1347 High Rd Clairton, PA | 2.0 | 1.0 | 870 | $1,250 | $1.44 | 44d | 1 | 0.77mi |
| 507 N 6th St Clairton, PA | 2.0 | 1.5 | 1120 | $1,250 | $1.12 | 44d | 1 | 1.20mi |
| 2140 Lincoln Blvd Elizabeth, PA | 2.0 | 1.0 | 968 | $790 | $0.82 | 44d | 1 | 1.24mi |
| 185 Carnegie Ave Clairton, PA | 3.0 | 1.0 | 1404 | $1,295 | $0.92 | 44d | 1 | 1.37mi |
| 168 Center Ave Unit 1 left) Elizabeth, PA | 2.0 | 1.0 | 950 | $895 | $0.94 | 23d | 1 | 1.39mi |
Listing history 16 events
-
2026-06-18days on market $820,000 Active 21 DOM
-
2026-06-17days on market $820,000 Active 20 DOM
-
2026-06-16days on market $820,000 Active 19 DOM
-
2026-06-15days on market $820,000 Active 18 DOM
-
2026-06-13days on market $820,000 Active 16 DOM
-
2026-06-09days on market $820,000 Active 12 DOM
-
2026-06-08days on market $820,000 Active 11 DOM
-
2026-06-07days on market $820,000 Active 10 DOM
-
2026-06-05days on market $820,000 Active 7 DOM
-
2026-06-03days on market $820,000 Active 6 DOM
-
2026-06-02days on market $820,000 Active 5 DOM
-
2026-06-01days on market $820,000 Active 4 DOM
-
2026-05-31days on market $820,000 Active 3 DOM
-
2026-05-27$820,000 Active
-
2020-02-27soldstatus $164,000
-
1991-04-15soldstatus $18,000
ⓘ Source: listings_history table (triggers on properties + properties_extension) + one-shot
backfill from property_details.listing_events for pre-trigger history.
Climate risk First Street
- Flood 1/10 Low FEMA zone X (unshaded) · 0% chance over 30 yrs
- Wildfire 1/10 Low
- Heat 4/10 Moderate 7 d/yr ≥98°F today · 18 d/yr by 30 yrs out
- Wind 2/10 Low
- Air quality 5/10 Major 8 unhealthy d/yr today · 8 by 30 yrs out
Nearby sold comps map
Loading sold comps map…
Walkable amenities ~0.75 mi
Loading nearby amenities…
Taxation est. · year 1
- Rental income
- $115,272
- − Mortgage interest
- −$45,933
- − Property taxes
- −$12,300
- − Insurance
- −$4,100
- − Repairs & maintenance
- −$9,222
- − Management
- −$9,222
- − Depreciation
- −$23,855
- Taxable income
- $10,641
- Est. tax owed @ 24.0%
- −$2,554
- After-tax cash flow
- $20,509/yr
For passive investors: Depreciation is non-cash, so a rental often shows a tax loss while cash-flowing — sheltering income. Rental losses are passive: they offset passive income freely, and up to $25,000/yr can offset ordinary (W-2) income if you actively participate and your MAGI is under $100k (phasing out to $0 by $150k); unused losses carry forward. On sale, claimed depreciation is recaptured at up to 25%, and gains may owe capital-gains tax (a 1031 exchange can defer both). Figures are a year-1 estimate at your 24.0% rate — not tax advice; consult a CPA.
Schools (NCES district)
- District
- Clairton City SD
- NCES district ID
- 4206030
- Math proficiency
- 7% ▼ -11.00%
- Reading proficiency
- 21% ▼ -12.00%
- Median HH income
- $30,250
- Composite
- 11.0/100
- National rank
- #9742
- State rank
- #520 of 539 in PA
Livability — Clairton
- Score
- 63/100
- State rank
- #1308
- US rank
- #16085
Category grades
Schools grade is shown separately in the Schools card above.
Census & demographics
- Census place
- Clairton, PA
- County
- Allegheny County · 1,022,028 people
- City population
- 16,939
- Metro
- Pittsburgh, PA
- Population (ZIP)
- 16,939
- Household income
- $76,531
- Rent vs Own
- Severe rent burden
- 572.0
Population outlook (Allegheny County) Hauer SSP2
- Today (2025)
- 1,250,282 people
- By 2030
- 1,256,482 · +0.5%
- By 2040
- 1,256,318 · +0.5%
- By 2050
- 1,244,169 · -0.5%
- By 2075
- 1,197,693 · -4.2%
- By 2100
- 1,093,187 · -12.6%
Race, ethnicity, and origin ACS 2023
- Neighborhood character
- Predominantly White (74%)
- Race & ethnicity
- White 74% Black 18% Two or more races 4% Asian 2% Hispanic / Latino 2%
- Common ancestry
- Romanian 6% Lithuanian 2% Slovak 1%
- Foreign-born
- 4% · China, Canada, India
- Languages at home
- 96% English-only · Other Indo-European 1% Chinese 1% Spanish 1%
Political lean MEDSL · Allegheny
- 2024 margin
- Strong D (+20.3) · D 59.7% · R 39.4%
- 2008→2024 swing
- +4.8pp toward D · 2008: 15.5pp · 2024: 20.3pp
- All cycles
- 2024: D+20.3 2020: D+20.4 2016: D+16.4 2012: D+14.4 2008: D+15.5
Not yet ingested
- Civics
- —
Market trends
- HPI YoY
- ▼ -96.35%
- Current HPI
- 183.858
- Rent YoY
- ▲ 10.47%
- Metro
- Pittsburgh, PA
- State GDP YoY
- ▲ 1.68%
- F500 in state
- 34
Industry mix (Fortune 500 HQ in PA)
| Industry | F500 HQs | Revenue |
|---|---|---|
| Healthcare | 2 | $309B |
|
||
| Insurance | 2 | $27B |
|
||
| Telecommunications / Media | 1 | $124B |
|
||
| Industrial Distribution | 1 | $22B |
|
||
| Financial Services | 1 | $20B |
|
||
| Chemicals / Materials | 1 | $18B |
|
||
Price history
+4455.6% since first listed3 events — show timeline
- 2026-05-27 Listed $820,000 West Penn MLS
- 2020-02-27 Sold (Public Records) $164,000 Public Records
- 1991-04-15 Sold (Public Records) $18,000 Public Records
Property tax history
+12.6%/yrLatest (2026): $367 · +11.0% YoY. Source: county tax records.
Cash-flow waterfall
monthlySold comps — $/sqft
last 12 mo · ≤1 miLoading sold comps…