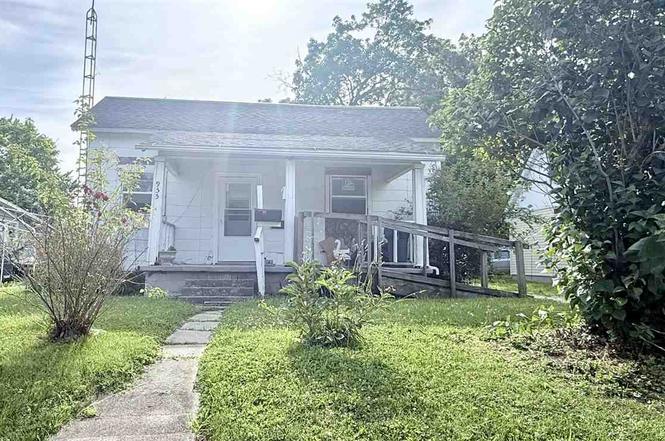
955 S Shank St · Portland, IN
Flood risk 1/10 · Minimal
- FEMA flood zone
- X (unshaded)
- Chance of flooding over 30 yrs
- 0.0%
- Est. flood insurance / yr
- $507 – $1,088
Fire risk 1/10 · Minimal
- Est. fire insurance / yr
- $717 – $1,331
Heat risk 3/10 · Minor
- Hot days now (above 100°F)
- 7 days/yr
- Hot days in 30 yrs
- 18 days/yr
Wind risk 2/10 · Minimal
- Chance of severe wind over 30 yrs
- 1.0%
Air-quality risk 3/10 · Minor
- Unhealthy air days now
- 2 days/yr
- Unhealthy air days in 30 yrs
- 4 days/yr
Risk factors via First Street. Map © Google.
Why this score? — see what drove the C+ grade
The composite is a weighted blend of 9 inputs, each scored 0–100. Each bar is that input's sub-score; the figure is the points it added to the 100-point composite (weight × sub-score).
- Cash flow +24.0/30.0
- ARV discount +15.0/15.0
- DSCR +7.7/10.0
- 1% rule +5.9/10.0
- Livability +3.5/5.0
- Schools +3.2/10.0
- Rent growth +2.5/5.0
- Condition / age +2.5/5.0
- Appreciation +0.0/10.0
$59,500
🖨 Deal sheet 📄 Offer letter ✓ Due diligence
Listing remarks MLS
Outstanding opportunity for homeownership! This charming 2-bedroom home is bursting with potential. Featuring a newer roof, replacement windows, and an updated bathroom. It is the perfect canvas for you to make your own. This property offers an affordable path to homeownership
Key facts
- Newer roof
- Updated bathroom
- Replacement windows
Tags
Property features AI
Finance
- Other: Lot dimensions approximately 46 x 140
Exterior
- Parking: Gravel parking
- Utilities: Public water; Public sewer
- Home design: Single-story site-built single family home; Residential property
- Construction: Fiber cement exterior; Metal and shingle roof; Crawl space foundation; Built as site-built (year built not provided)
- Exterior features: Front porch; Level lot
Interior
- Bedrooms: Total of 5 rooms (bedroom count not specified)
- Flooring: Hardwood flooring; Vinyl flooring
- Bathrooms: One full bathroom (main level)
- Heating & cooling: Natural gas forced-air heating; No cooling
- Interior features: Gas water heater; Water heater; One fireplace
- Laundry & utility: Washer hookup; Electric dryer hookup; Laundry on the main level
Neighborhood map
What this means for you Summary
Snapshot
- This is a 2-bed/1.0-bath single-family listed at $60k.
Deal economics
- At list price, monthly cash flow is $117 ($1k/yr) — positive.
- The deal already cash-flows at list — no discount required.
- Meets the 1% rule at list price ($650 rent vs $60k).
- Cap rate 8.7% vs local median 4.7% in Portland — top-decile yield for the area; either an underpriced asset or a hidden risk that comps aren't pricing in. Stress-test before assuming the spread holds.
Location & tenants
- Location reads 69/100 on livability (#191 in IN) — a middle-class / working-renter tenant base. Strengths: cost of living A+, housing A+; Watch: commute C-, health & safety D, amenities F.
- Jay School Corporation (rural): math 38% / reading 37% proficiency, ranked #175 of 301 in IN (top 58%) — families likely to look elsewhere, expect single-tenant / working-renter base with shorter leases.
- Zoned schools: East Jay Elementary (math 37% / reading 34%, grade F, #584 of 994 statewide, top 59%, 540 students, 56% FRL); Jay County Jr/Sr High School (math 34% / reading 41%, grade F, #245 of 369 statewide, top 67%, 1,242 students, 50% FRL).
- Market conditions: 39 active listings in the ZIP; 1 comparable units currently listed for rent nearby; 19 units permitted in Jay County in 2024 (0 in 5+ unit buildings).
- This rent is only 13% of the median local income ($59k/yr) — well below the 30% rent-burden line; pricing power to push rent on renewal without tenant pushback.
Forward outlook
- Local home prices are declining (-3.0%/yr); year-one equity from $411 of loan paydown is wiped out by about $2k of value loss. Plan a longer hold.
- Jay County population projected at -12% by 2050 — secular population decline; favor cash flow + early exit over multi-decade hold.
Negotiation context
- Only 2 days on market — expect competitive offers; lowballing is unlikely to land.
- 2 sale attempts with the ask held roughly flat each time — persistent listings suggest the price (not the market) is what's stuck; bring a comps-based counter.
Risks & watch-outs
- Watch-outs: built in 1914 — expect roof / HVAC / electrical / plumbing capex.
Questions for the listing agent
- Built in 1914 — when were the roof, HVAC, electrical panel, plumbing, and water heater last replaced?
- Is there a deadline driving the sale (1031 exchange, divorce, estate, relocation)? That informs how much negotiation room exists.
- Schools are D-rated, which usually means shorter tenancies and higher turnover. Who's the typical renter profile here, and what's been the actual vacancy rate?
- What's the average days-on-market for RENTAL listings here right now (not sales)? A rising rental-DOM trend means longer vacancies and softer asking-rent achievability than the comps imply.
- What's the recent tenant-quality profile in this submarket — average credit score on applications, eviction rate, late-payment / NSF rate, and stable-employment percentage? A property-management company in the area should have these aggregated.
- How much new for-sale + rental construction is in the pipeline within 1–3 miles? Heavy new supply typically softens prices + rents 12–24 months out; constrained supply supports both.
Investment metrics
- 1% rule
- 1.09% ✓
- Cap rate
- 8.65%
- Cash-on-cash
- 8.43%
- DSCR
- 1.37
- GRM
- 7.6
CMA / ARV
- ARV (on-the-fly)
- $90,736
- Comps found
- 4
Show comp detail 4 sales within ~0.75 mi
| Address | Dist | Beds/Ba | Sqft | Sold | Price | $/sf | Match |
|---|---|---|---|---|---|---|---|
| 1208 S Shank St | 0.16mi | 2/1.0 | 800 (-6%) | 2mo | $81,000 | $101 | 80 |
| 228 E Elder St | 0.18mi | 2/1.0 | 868 (+1%) | 22mo | $92,000 | $106 | 70 |
| 951 S Bridge St | 0.07mi | 2/1.0 | 978 (+14%) | 20mo | $85,000 | $87 | 57 |
| 664 W Third St | 0.73mi | 2/1.0 | 841 (-2%) | 9mo | $109,000 | $130 | 55 |
Match score weights: distance 35% · size 25% · config 20% · recency 20%. Top-matched comps best support the ARV.
Projected returns pro-forma
-3.0% appreciation · 3.0% rent growth · sell at horizon
- IRR
- -3.5%
- Equity multiple
- 0.87×
- Total profit
- $-2,189
- Equity at exit
- $8,872
- IRR
- 6.2%
- Equity multiple
- 1.46×
- Total profit
- $7,693
- Equity at exit
- $5,144
Cash invested: $16,660 (down + closing). Projections, not guarantees.
Landlord ↔ Tenant lean methodology
- Overall (STATE)
- 90 Strongly Landlord-Friendly
- State Indiana
- 90 Strongly Landlord-Friendly · R+11
- County
- — inherits STATE
- City
- — inherits STATE
ZIP-level market 47371
- Home prices YoY
- -20.1%
- Active inventory
- 39
- Price-to-rent
- 7.6×
Monthly cashflow live
- Estimated rent
- $650 medium interval (Pro) →
- Mortgage (P&I)
- −$312
- Tax from tax record
- −$60 /mo · $716/yr
- Insurance
- −$25
- HOA
- −$0
- Vacancy / Maint / Mgmt
- −$136
- Net cashflow
- $117
Break-even live
UW: 25.0% down · 7.5% · 30yr · 1.5% tax · 5.0% vac · 8.0% maint · 8.0% mgmt
Financing live
Cash to close
- Down payment
- $14,875
- Closing costs
- $1,785
- Reserves months
- —
- Total cash needed
- —
Loan-product check · same deal, 3 products live
Conventional
25% down · 7.5% · 30yr
- Down + closing
- —
- Monthly P&I
- —
- Monthly cashflow
- —
- DSCR
- —
- Eligible?
- —
Personal DTI + credit; lowest rate.
DSCR
20% down · 8.5% · 30yr
- Down + closing
- —
- Monthly P&I
- —
- Monthly cashflow
- —
- DSCR
- —
- Eligible?
- —
No personal income docs; deal must DSCR.
Hard money
10% down · 12.0% · 12mo
- Down + closing
- —
- Monthly P&I
- —
- Monthly cashflow
- —
- DSCR
- —
- Eligible?
- —
Short-term bridge; refi at stabilization.
Rent comps 1 comps
| Address | Beds | Baths | Sqft | Rent | $/sqft | DOM | Units | Dist |
|---|---|---|---|---|---|---|---|---|
| 202 N Meridian St Portland, IN | 1.0 | 1.0 | 900 | $650 | $0.72 | 43d | 1 | 0.87mi |
Listing history 3 events
-
2026-06-18days on market $59,500 Active 2 DOM
-
2026-06-17remarks 278-char remark
-
2026-06-17$59,500 Active 1 DOM
ⓘ Source: listings_history table (triggers on properties + properties_extension) + one-shot
backfill from property_details.listing_events for pre-trigger history.
Tax reassessment forecast IN · Partial reset (capped growth)
- Current annual tax
- $716 · $60/mo
- Projected year-2 tax
- $716 · $60/mo
- Expected delta
- $0/yr ($0/mo · 0.0%)
ⓘ Screening estimate from a state-policy table — verify with the county assessor before closing.
Climate risk First Street
- Flood 1/10 Low FEMA zone X (unshaded) · 0% chance over 30 yrs
- Wildfire 1/10 Low
- Heat 3/10 Moderate 7 d/yr ≥100°F today · 18 d/yr by 30 yrs out
- Wind 2/10 Low 100% chance of damaging wind over 30 yrs
- Air quality 3/10 Moderate 2 unhealthy d/yr today · 4 by 30 yrs out
Nearby sold comps map
Loading sold comps map…
Walkable amenities ~0.75 mi
Loading nearby amenities…
Taxation est. · year 1
- Rental income
- $7,800
- − Mortgage interest
- −$3,333
- − Property taxes
- −$716
- − Insurance
- −$298
- − Repairs & maintenance
- −$624
- − Management
- −$624
- − Depreciation
- −$1,731
- Taxable income
- $475
- Est. tax owed @ 24.0%
- −$114
- After-tax cash flow
- $1,290/yr
For passive investors: Depreciation is non-cash, so a rental often shows a tax loss while cash-flowing — sheltering income. Rental losses are passive: they offset passive income freely, and up to $25,000/yr can offset ordinary (W-2) income if you actively participate and your MAGI is under $100k (phasing out to $0 by $150k); unused losses carry forward. On sale, claimed depreciation is recaptured at up to 25%, and gains may owe capital-gains tax (a 1031 exchange can defer both). Figures are a year-1 estimate at your 24.0% rate — not tax advice; consult a CPA.
Schools (NCES district)
- District
- Jay School Corporation
- NCES district ID
- 1804980
- Math proficiency
- 38% ▼ -13.00%
- Reading proficiency
- 37% ▼ -13.00%
- Median HH income
- $40,841
- Composite
- 31.56/100
- National rank
- #5954
- State rank
- #175 of 301 in IN
Livability — Portland
- Score
- 69/100
- State rank
- #191
- US rank
- #8739
Category grades
Schools grade is shown separately in the Schools card above.
Census & demographics
- Census place
- Portland, IN
- County
- Jay · 12,450 people
- Population (ZIP)
- 12,450
- Household income
- $59,215
- Rent vs Own
- Severe rent burden
- 4.4
Population outlook (Jay County) Hauer SSP2
- Today (2025)
- 20,586 people
- By 2030
- 20,155 · -2.1%
- By 2040
- 19,274 · -6.4%
- By 2050
- 18,203 · -11.6%
- By 2075
- 15,062 · -26.8%
- By 2100
- 10,857 · -47.3%
Race, ethnicity, and origin ACS 2023
- Neighborhood character
- Predominantly White (93%)
- Race & ethnicity
- White 93% Hispanic / Latino 5% Two or more races 4%
- Common ancestry
- Iranian 4% Serbian 2% Italian 1%
- Foreign-born
- 1% · Canada
- Languages at home
- 95% English-only · German/W. Germanic 4% Spanish 1%
Political lean MEDSL · Jay
- 2024 margin
- Solid R (+55.2) · D 21.6% · R 76.7% · Other 1.7%
- 2008→2024 swing
- -47.3pp toward R · 2008: -7.8pp · 2024: -55.2pp
- All cycles
- 2024: R+55.2 2020: R+52.4 2016: R+47.8 2012: R+20.0 2008: R+7.8
Not yet ingested
- Civics
- —
Market trends
- HPI YoY
- ▼ -64.09%
- Current HPI
- 255.0877
- Rent YoY
- —
- Metro
- —
- State GDP YoY
- ▲ 2.90%
- F500 in state
- 18
Industry mix (Fortune 500 HQ in IN)
| Industry | F500 HQs | Revenue |
|---|---|---|
| Industrial Machinery | 2 | $37B |
|
||
| Healthcare | 1 | $177B |
|
||
| Pharmaceuticals | 1 | $45B |
|
||
| Metals / Steel | 1 | $18B |
|
||
| Agriculture | 1 | $17B |
|
||
| Packaging | 1 | $12B |
|
||
Price history
+0.0% since first listed2 events — show timeline
- 2026-06-16 Listed $59,500 RRELMS
- 2026-06-16 Listed $59,500 IRMLS
Property tax history
+0.2%/yrLatest (2025): $716 · +8.5% YoY. Source: county tax records.
Cash-flow waterfall
monthlySold comps — $/sqft
last 12 mo · ≤1 miLoading sold comps…