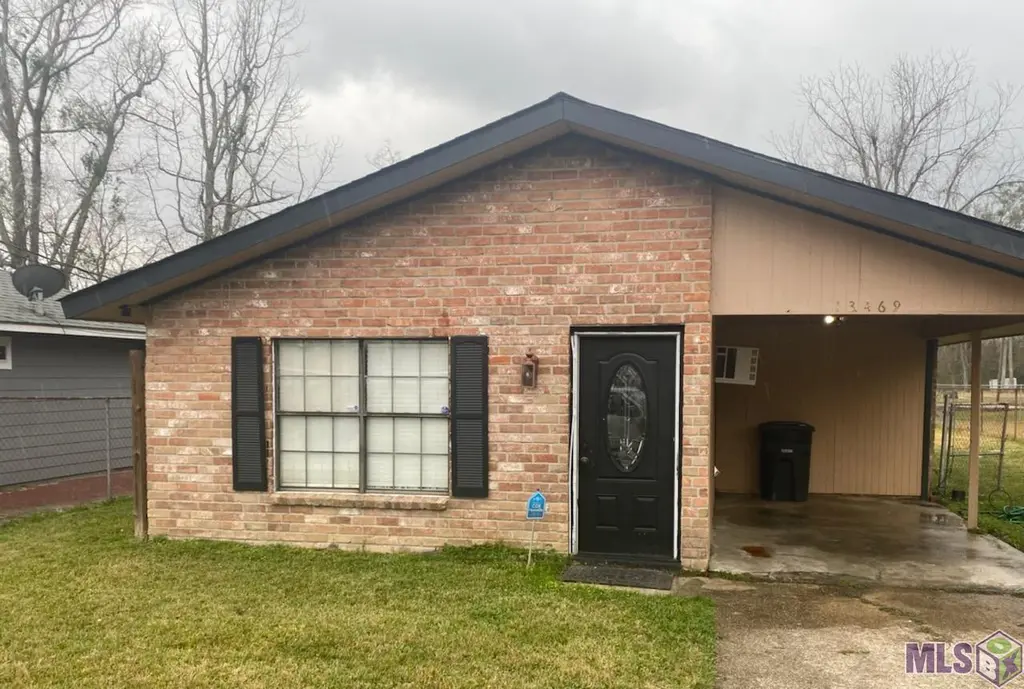
13469 Abraham Dr · Baker, LA
Flood risk 1/10 · Minimal
- FEMA flood zone
- X (unshaded)
- Chance of flooding over 30 yrs
- 0.0%
- Est. flood insurance / yr
- $507 – $1,088
Fire risk 3/10 · Minor
- Est. fire insurance / yr
- $1,269 – $2,357
Heat risk 8/10 · Major
- Hot days now (above 108°F)
- 7 days/yr
- Hot days in 30 yrs
- 20 days/yr
Wind risk 9/10 · Severe
- Chance of severe wind over 30 yrs
- 99.0%
Air-quality risk 2/10 · Minimal
- Unhealthy air days now
- 1 days/yr
- Unhealthy air days in 30 yrs
- 2 days/yr
Risk factors via First Street. Map © Google.
Why this score? — see what drove the B+ grade
The composite is a weighted blend of 9 inputs, each scored 0–100. Each bar is that input's sub-score; the figure is the points it added to the 100-point composite (weight × sub-score).
- Cash flow +27.8/30.0
- ARV discount +15.0/15.0
- DSCR +9.8/10.0
- 1% rule +7.2/10.0
- Appreciation +4.6/10.0
- Livability +3.3/5.0
- Rent growth +2.5/5.0
- Condition / age +2.5/5.0
- Schools +2.4/10.0
$112,000
🖨 Deal sheet (PDF) 📄 Offer letter ✓ Due diligence
Listing remarks MLS
Great investment property
Key facts
- 0.39 acre lot
- Built 1982
- Listed 18 days
Property features AI
Exterior
- Parking: Carport
- Utilities: Public water; Public sewer
- Home design: Single-family detached residential property; Located in the Lincoln Heights subdivision
- Construction: Brick construction; Built on a slab foundation; Property built prior to or in 2026
- Exterior features: Carport
Interior
- Bathrooms: 1 full bathroom
- Heating & cooling: Window unit(s) for cooling; Wall furnace for heating
- Interior features: Window cooling units; Wall furnace heating
Neighborhood map
What this means for you Summary
Snapshot
- This is a 3-bed/1.0-bath single-family listed at $112k.
Deal economics
- At list price, monthly cash flow is $340 ($4k/yr) — positive.
- The deal already cash-flows at list — no discount required.
- Meets the 1% rule at list price ($1k rent vs $112k).
- Recommended offer: $110k (1.5% below list) — sets the bar for market timing.
- Cap rate 9.9% vs local median 4.1% in Baker — top-decile yield for the area; either an underpriced asset or a hidden risk that comps aren't pricing in. Stress-test before assuming the spread holds.
Location & tenants
- Location reads 66/100 on livability (#131 in LA) — a middle-class / working-renter tenant base. Strengths: cost of living A+, housing A; Watch: crime D+, amenities F, commute F.
- East Baton Rouge Parish (urban): math 22% / reading 34% proficiency, ranked #47 of 98 in LA (top 48%) — low school quality limits family demand, transient renter base, plan for 1-2y turnover; 77% free/reduced lunch — lower-income household profile, screen leases tightly.
- Zoned schools: Crestworth Elementary School (math 17% / reading 27%, grade F, #415 of 646 statewide, top 67%, 389 students, 93% FRL); Park Forest Middle School (math 3% / reading 12%, grade F, #207 of 218 statewide, top 95%, 582 students, 78% FRL); Liberty High School (math 50% / reading 74%, grade B-, #15 of 265 statewide, top 6%, 1,208 students, 60% FRL) — zoned schools at 77% FRL track the district average.
- Market conditions: 102 active listings in the ZIP; lower-income renter base — watch delinquency; 2,252 units permitted in East Baton Rouge Parish in 2024 (440 in 5+ unit buildings).
- At $1,364/mo this rent would consume 59% of the median local household income ($28k/yr) (locally 1092% of renters already pay >50% of income on rent) — very limited rent-growth headroom before tenants either downsize or default.
Forward outlook
- Local home prices are declining (-0.9%/yr); year-one equity from $774 of loan paydown is wiped out by about $975 of value loss. Plan a longer hold.
- East Baton Rouge County population projected at +4% by 2050 — modest demand growth; plan on rents tracking national, not racing it.
- At projected returns (-0.9% appreciation + 3.0% rent growth), your $31k cash investment doubles in ~7 years — after that, you're playing with house money.
Negotiation context
- It's been on market 18 days — a 2% lower offer ($110k) is reasonable based on typical stale-listing flexibility.
- 4 sale attempts since 4y ago; this cycle's ask has dropped $14k (11%) from the opening price — seller is motivated, your offer sets the floor, not the list.
Risks & watch-outs
- Climate carrying-cost: severe wind risk, 99% chance of damaging wind over 30y; extreme-heat days projected 7→20/yr by 2055 (HVAC capex compounding) — expect insurance premiums to compound above CPI over the hold.
Questions for the listing agent
- Is there a deadline driving the sale (1031 exchange, divorce, estate, relocation)? That informs how much negotiation room exists.
- Crime grade is D in this area — have there been break-ins, vandalism, or insurance claims at this property in the last 3 years? What carrier currently insures it and at what premium?
- What's the average days-on-market for RENTAL listings here right now (not sales)? A rising rental-DOM trend means longer vacancies and softer asking-rent achievability than the comps imply.
- What's the recent tenant-quality profile in this submarket — average credit score on applications, eviction rate, late-payment / NSF rate, and stable-employment percentage? A property-management company in the area should have these aggregated.
- How much new for-sale + rental construction is in the pipeline within 1–3 miles? Heavy new supply typically softens prices + rents 12–24 months out; constrained supply supports both.
Investment metrics
- 1% rule
- 1.22% ✓
- Cap rate
- 9.94%
- Cash-on-cash
- 13.03%
- DSCR
- 1.58
- GRM
- 6.8
CMA / ARV
- ARV (on-the-fly)
- $168,320
- Comps found
- 2
Show comp detail 2 sales within ~0.75 mi
| Address | Dist | Beds/Ba | Sqft | Sold | Price | $/sf | Match |
|---|---|---|---|---|---|---|---|
| 13309 Abraham Dr | 0.09mi | 3/2.0 | 1,200 (+14%) | 1mo | $60,000 | $50 | 67 |
| 955 St John Ln | 0.67mi | 3/2.0 | 920 (-12%) | 6mo | $147,000 | $160 | 39 |
Match score weights: distance 35% · size 25% · config 20% · recency 20%. Top-matched comps best support the ARV.
Projected returns pro-forma
-0.87% appreciation · 3.0% rent growth · sell at horizon
- IRR
- 9.8%
- Equity multiple
- 1.44×
- Total profit
- $13,901
- Equity at exit
- $27,729
- IRR
- 15.8%
- Equity multiple
- 2.59×
- Total profit
- $49,817
- Equity at exit
- $29,712
Cash invested: $31,360 (down + closing). Projections, not guarantees.
Landlord ↔ Tenant lean methodology
- Overall (STATE)
- 90 Strongly Landlord-Friendly
- State Louisiana
- 90 Strongly Landlord-Friendly · R+12
- County
- — inherits STATE
- City
- — inherits STATE
ZIP-level market 70807
- Home prices YoY
- -1.1%
- Active inventory
- 102
- Price-to-rent
- 6.8×
Monthly cashflow live
- Estimated rent
- $1,364 medium interval (Pro) →
- Mortgage (P&I)
- −$587
- Tax from tax record
- −$103 /mo · $1,235/yr
- Insurance
- −$47
- HOA
- −$0
- Vacancy / Maint / Mgmt
- −$286
- Net cashflow
- $340
Break-even live
Sensitivity live
| Price | -10% $404 | -5% $372 | +0% $340 | +5% $309 | +10% $277 |
|---|---|---|---|---|---|
| Rent | -10% $233 | -5% $287 | +0% $340 | +5% $394 | +10% $448 |
| Rate | -1.0pp $397 | -0.5pp $369 | base $340 | +0.5pp $311 | +1.0pp $282 |
UW: 25.0% down · 7.5% · 30yr · 1.5% tax · 5.0% vac · 8.0% maint · 8.0% mgmt
Financing live
Cash to close
- Down payment
- $28,000
- Closing costs
- $3,360
- Reserves months
- —
- Total cash needed
- —
Loan-product check · same deal, 3 products live
Conventional
25% down · 7.5% · 30yr
- Down + closing
- —
- Monthly P&I
- —
- Monthly cashflow
- —
- DSCR
- —
- Eligible?
- —
Personal DTI + credit; lowest rate.
DSCR
20% down · 8.5% · 30yr
- Down + closing
- —
- Monthly P&I
- —
- Monthly cashflow
- —
- DSCR
- —
- Eligible?
- —
No personal income docs; deal must DSCR.
Hard money
10% down · 12.0% · 12mo
- Down + closing
- —
- Monthly P&I
- —
- Monthly cashflow
- —
- DSCR
- —
- Eligible?
- —
Short-term bridge; refi at stabilization.
Listing history 14 events
-
2026-06-22days on market $112,000 Active 18 DOM
-
2026-06-18price $112,000 Active 15 DOM
-
2026-06-18days on market $116,000 Active 15 DOM
-
2026-06-17days on market $116,000 Active 14 DOM
-
2026-06-16days on market $116,000 Active 13 DOM
-
2026-06-16price $116,000 Active 12 DOM
-
2026-06-15days on market $126,000 Active 12 DOM
-
2026-06-14days on market $126,000 Active 10 DOM
-
2026-06-10days on market $126,000 Active 7 DOM
-
2026-06-09days on market $126,000 Active 6 DOM
-
2026-06-08days on market $126,000 Active 5 DOM
-
2026-06-07days on market $126,000 Active 4 DOM
-
2026-06-05remarks 25-char remark
-
2026-06-05$126,000 Active 1 DOM
ⓘ Source: listings_history table (triggers on properties + properties_extension) + one-shot
backfill from property_details.listing_events for pre-trigger history.
Tax reassessment forecast LA · Resets to sale price
- Current annual tax
- $1,235 · $103/mo
- Projected year-2 tax
- $1,235 · $103/mo
- Expected delta
- $0/yr ($0/mo · 0.0%)
ⓘ Screening estimate from a state-policy table — verify with the county assessor before closing.
Climate risk First Street
- Flood 1/10 Low FEMA zone X (unshaded) · 0% chance over 30 yrs
- Wildfire 3/10 Moderate
- Heat 8/10 Severe 7 d/yr ≥108°F today · 20 d/yr by 30 yrs out
- Wind 9/10 Extreme 99% chance of damaging wind over 30 yrs
- Air quality 2/10 Low 1 unhealthy d/yr today · 2 by 30 yrs out
Nearby sold comps map
Loading sold comps map…
Walkable amenities ~0.75 mi
Loading nearby amenities…
Taxation est. · year 1
- Rental income
- $16,365
- − Mortgage interest
- −$6,274
- − Property taxes
- −$1,235
- − Insurance
- −$560
- − Repairs & maintenance
- −$1,309
- − Management
- −$1,309
- − Depreciation
- −$3,258
- Taxable income
- $2,420
- Est. tax owed @ 24.0%
- −$581
- After-tax cash flow
- $3,505/yr
For passive investors: Depreciation is non-cash, so a rental often shows a tax loss while cash-flowing — sheltering income. Rental losses are passive: they offset passive income freely, and up to $25,000/yr can offset ordinary (W-2) income if you actively participate and your MAGI is under $100k (phasing out to $0 by $150k); unused losses carry forward. On sale, claimed depreciation is recaptured at up to 25%, and gains may owe capital-gains tax (a 1031 exchange can defer both). Figures are a year-1 estimate at your 24.0% rate — not tax advice; consult a CPA.
Schools (NCES district)
- District
- East Baton Rouge Parish
- NCES district ID
- 2200540
- Math proficiency
- 22% ▼ -36.00%
- Reading proficiency
- 34% ▼ -31.00%
- Median HH income
- $46,263
- Composite
- 24.14/100
- National rank
- #7745
- State rank
- #47 of 98 in LA
Livability — Baker
- Score
- 66/100
- State rank
- #131
- US rank
- #12021
Category grades
Schools grade is shown separately in the Schools card above.
Census & demographics
- County
- East Baton Rouge Parish · 399,686 people
- City population
- 17,433
- Metro
- Baton Rouge, LA
- Population (ZIP)
- 15,300
- Household income
- $27,534
- Rent vs Own
- Severe rent burden
- 1092.0
Population outlook (East Baton Rouge County) Hauer SSP2
- Today (2025)
- 464,810 people
- By 2030
- 472,137 · +1.6%
- By 2040
- 480,243 · +3.3%
- By 2050
- 484,422 · +4.2%
- By 2075
- 492,069 · +5.9%
- By 2100
- 476,347 · +2.5%
Race, ethnicity, and origin ACS 2023
- Neighborhood character
- Predominantly Black (91%)
- Race & ethnicity
- Black 91% Two or more races 6% White 3%
- Common ancestry
- Lithuanian 1%
- Foreign-born
- 1% · Canada
Political lean MEDSL · East Baton Rouge
- 2024 margin
- D (+11.1) · D 54.5% · R 43.4% · Other 2.1%
- 2008→2024 swing
- +8.9pp toward D · 2008: 2.2pp · 2024: 11.1pp
- All cycles
- 2024: D+11.1 2020: D+13.1 2016: D+9.2 2012: D+5.2 2008: D+2.2
Not yet ingested
- Civics
- —
Market trends
- HPI YoY
- ▼ -0.87%
- Current HPI
- 78.3629
- Rent YoY
- —
- Metro
- Baton Rouge, LA
- State GDP YoY
- ▲ 3.29%
- F500 in state
- 10
Industry mix (Fortune 500 HQ in LA)
| Industry | F500 HQs | Revenue |
|---|---|---|
| Telecommunications | 2 | $23B |
|
||
| Utilities | 1 | $12B |
|
||
| Wholesale / Distribution | 1 | $5B |
|
||
| Advertising | 1 | $2B |
|
||
Price history
+26.0% since first listed8 events — show timeline
- 2026-06-03 Listed $126,000 AcadianaMLS
- 2026-06-03 Listed $126,000 GBRMLS
- 2022-03-08 Sold (Public Records) $105,000 Public Records
- 2022-03-07 Sold (MLS) — GBRMLS
- 2022-01-24 Pending — GBRMLS
- 2022-01-09 Listed $100,000 AcadianaMLS
- 2022-01-09 Listed $100,000 GBRMLS
- 1986-05-09 Sold (Public Records) — Public Records
Property tax history
+39.4%/yrLatest (2025): $1,235 · -0.4% YoY. Source: county tax records.
Cash-flow waterfall
monthlySold comps — $/sqft
last 12 mo · ≤1 miLoading sold comps…