 🌊 Lakefront
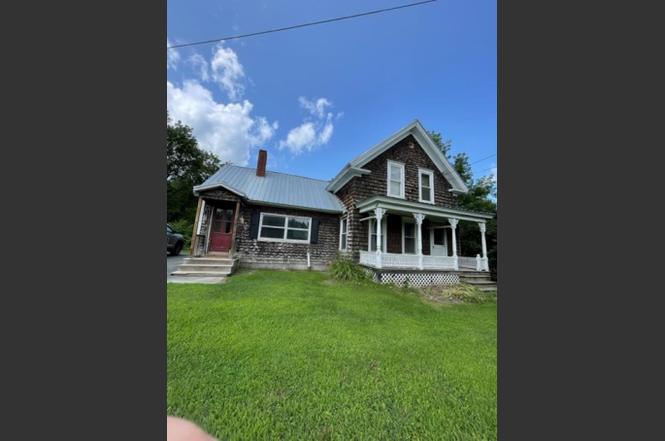
1957 Memorial Dr · St. Johnsbury, VT
Flood risk No data
- FEMA flood zone
- —
- Chance of flooding over 30 yrs
- —
- Est. flood insurance / yr
- —
Fire risk No data
- Est. fire insurance / yr
- —
Heat risk 2/10 · Minimal
- Hot days now (above threshold)
- 7 days/yr
- Hot days in 30 yrs
- 17 days/yr
Wind risk No data
- Chance of severe wind over 30 yrs
- —
Air-quality risk 2/10 · Minimal
- Unhealthy air days now
- 1 days/yr
- Unhealthy air days in 30 yrs
- 1 days/yr
Risk factors via First Street. Map © Google.
Why this score? — see what drove the C- grade
The composite is a weighted blend of 9 inputs, each scored 0–100. Each bar is that input's sub-score; the figure is the points it added to the 100-point composite (weight × sub-score).
- Cash flow +17.7/30.0
- ARV discount +7.5/15.0
- DSCR +5.5/10.0
- Schools +5.0/10.0
- 1% rule +4.8/10.0
- Appreciation +3.8/10.0
- Rent growth +2.5/5.0
- Livability +2.5/5.0
- Condition / age +2.5/5.0
$167,900
🖨 Deal sheet (PDF) 📄 Offer letter ✓ Due diligence
Listing remarks
A real sweet Circa 1850's village house with major upgrades in last year! TOTAL ELECTRICAL UPGRADE COMPLETE! NEW OIL HOT AIR FURNACE INSTALLED IN FALL 2024. NEW HOT WATER TANK . AND NEW FUEL TANK AND CONCRETE SLAB IN BASEMENT. PLUMBING UPGRADE. Move-in ready property suitable for residential or commercial use. Beautiful softwood floors. First floor laundry. Spacious eat-in kitchen with a "pass-thru" to the formal dining room. Large livingroom with open stairway. First floor bedroom or large den. TWO Large walk-in closets on second floor. Ample storage. Additional 2nd floor space waiting for your finish. 2025 taxes $2929.30.
Key facts
- Walk-in cedar closet
- Curved wall feature
- 7,840 sq ft lot
Tags
Property features AI
Exterior
- Parking: Plenty of parking and turnaround space (shared drive access)
- Utilities: Public water on-site; Shared septic system; Circuit breaker electrical panel; served by GMP; High-speed internet available; cable and telephone available; Fuel provider: Fred's Energy
- Home design: Farmhouse style; Existing structure; Brown exterior color; Metal roof
- Construction: Originally built in 1850; Exterior materials include asphalt, cedar, shingle siding and wood; Foundation and basement details include concrete and dirt floors
- Exterior features: Level lot; River frontage on the Passumpsic River (directly adjoining); Neighboring businesses nearby; In town, near shopping, public transportation, and hospital; Shared/semi-private paved driveway with right-of-way access; Road frontage on a paved public road (66 ft)
Interior
- Kitchen: Eat-in kitchen; Dishwasher; Refrigerator; Electric stove
- Bedrooms: Main-level bedroom; Two bedrooms on the second level
- Flooring: Softwood flooring; Vinyl flooring; Other flooring types
- Bathrooms: 1 full bathroom
- Heating & cooling: Oil heat with forced air
- Interior features: 9 total rooms; Crawl space and unfinished basement with interior access, concrete and dirt floors, interior stairs, and a sump pump
- Laundry & utility: Laundry area located in the bathroom; Electric water heater (owned)
Neighborhood map
What this means for you Summary
Snapshot
- This is a 3-bed/1.0-bath single-family listed at $168k.
Deal economics
- At list price, monthly cash flow is $136 ($2k/yr) — positive.
- The deal already cash-flows at list — no discount required.
- To meet the 1% rule (rent ≥ 1% of price), the offer needs to be $164k (2.3% below list).
- Recommended offer: $148k (12.0% below list) — sets the bar for market timing.
- Cap rate 7.3% vs local median 3.4% in St. Johnsbury — top-decile yield for the area; either an underpriced asset or a hidden risk that comps aren't pricing in. Stress-test before assuming the spread holds.
Location & tenants
- Location reads: area grade C — affects rentability + tenant quality, not the cash-flow math above.
- Zoned schools: St. Johnsbury School (math 19% / reading 37%, grade F, #149 of 192 statewide, top 78%, 702 students, 52% FRL).
- Market conditions: 66 active listings in the ZIP; 112 units permitted in Caledonia County in 2024 (15 in 5+ unit buildings).
Forward outlook
- Local home prices are declining (-2.4%/yr); year-one equity from $1k of loan paydown is wiped out by about $4k of value loss. Plan a longer hold.
- Caledonia County population projected at -20% by 2050 — secular population decline; favor cash flow + early exit over multi-decade hold.
Negotiation context
- It's been on market 658 days — a 12% lower offer ($148k) is reasonable based on typical stale-listing flexibility.
- 2 sale attempts since 2y ago; this cycle's ask has dropped $97k (37%) from the opening price — seller is motivated, your offer sets the floor, not the list.
Risks & watch-outs
- Watch-outs: built in 1850 — expect roof / HVAC / electrical / plumbing capex.
Questions for the listing agent
- It's been on market 658 days. Have you received any prior offers? Is the seller open to a 12% concession, seller financing, or rate buy-down credit?
- Built in 1850 — when were the roof, HVAC, electrical panel, plumbing, and water heater last replaced?
- Why hasn't it sold? Are there any deal-killer items the seller is aware of (foundation, flood, title, zoning, code violations)?
- Is there a deadline driving the sale (1031 exchange, divorce, estate, relocation)? That informs how much negotiation room exists.
- This sits on a lake — are riparian / water-frontage rights deeded with the parcel? Any dock permits, shoreline easements, or HOA water-use restrictions?
- What's the documented flood / surge / shoreline-erosion history here (FEMA AND non-FEMA — e.g., storm surge, creek backup, septic-field saturation)?
- Any water-quality or seasonal algae-bloom issues that affect tenant satisfaction or short-term-rental demand?
- What's the average days-on-market for RENTAL listings here right now (not sales)? A rising rental-DOM trend means longer vacancies and softer asking-rent achievability than the comps imply.
- What's the recent tenant-quality profile in this submarket — average credit score on applications, eviction rate, late-payment / NSF rate, and stable-employment percentage? A property-management company in the area should have these aggregated.
- How much new for-sale + rental construction is in the pipeline within 1–3 miles? Heavy new supply typically softens prices + rents 12–24 months out; constrained supply supports both.
Investment metrics
- 1% rule
- 0.98% ✗
- Cap rate
- 7.26%
- Cash-on-cash
- 3.47%
- DSCR
- 1.15
- GRM
- 8.5
CMA / ARV
- ARV (on-the-fly)
- $341,312
- Comps found
- 4
Show comp detail 4 sales within ~0.75 mi
| Address | Dist | Beds/Ba | Sqft | Sold | Price | $/sf | Match |
|---|---|---|---|---|---|---|---|
| 86 Sanger Cir | 0.28mi | 4/1.0 (+1) | 1,274 (-6%) | 12mo | $287,500 | $226 | 62 |
| 96 Stetson Ter | 0.54mi | 2/1.0 (-1) | 1,283 (-5%) | 6mo | $199,000 | $155 | 56 |
| 178 Sanger Cir | 0.31mi | 3/1.5 | 1,495 (+11%) | 19mo | $280,000 | $187 | 51 |
| 1695 Breezy Hill Rd | 0.42mi | 3/1.5 | 1,551 (+15%) | 19mo | $245,000 | $158 | 38 |
Match score weights: distance 35% · size 25% · config 20% · recency 20%. Top-matched comps best support the ARV.
Projected returns pro-forma
-2.41% appreciation · 3.0% rent growth · sell at horizon
- IRR
- -7.9%
- Equity multiple
- 0.69×
- Total profit
- $-14,355
- Equity at exit
- $29,471
- IRR
- 0.7%
- Equity multiple
- 1.05×
- Total profit
- $2,390
- Equity at exit
- $22,255
Cash invested: $47,012 (down + closing). Projections, not guarantees.
Landlord ↔ Tenant lean methodology
- Overall (STATE)
- 41 Moderately Tenant-Leaning
- State Vermont
- 41 Moderately Tenant-Leaning · D+15
- County
- — inherits STATE
- City
- — inherits STATE
ZIP-level market 05819
- Home prices YoY
- -0.8%
- Active inventory
- 66
- Price-to-rent
- 8.5×
Monthly cashflow live
- Estimated rent
- $1,641 medium interval (Pro) →
- Mortgage (P&I)
- −$880
- Tax est. 1.5%
- −$210 /mo · $2,518/yr
- Insurance
- −$70
- HOA
- −$0
- Vacancy / Maint / Mgmt
- −$345
- Net cashflow
- $136
Break-even live
Sensitivity live
| Price | -10% $252 | -5% $194 | +0% $136 | +5% $78 | +10% $20 |
|---|---|---|---|---|---|
| Rent | -10% $6 | -5% $71 | +0% $136 | +5% $201 | +10% $266 |
| Rate | -1.0pp $220 | -0.5pp $179 | base $136 | +0.5pp $92 | +1.0pp $48 |
UW: 25.0% down · 7.5% · 30yr · 1.5% tax · 5.0% vac · 8.0% maint · 8.0% mgmt
Financing live
Cash to close
- Down payment
- $41,975
- Closing costs
- $5,037
- Reserves months
- —
- Total cash needed
- —
Loan-product check · same deal, 3 products live
Conventional
25% down · 7.5% · 30yr
- Down + closing
- —
- Monthly P&I
- —
- Monthly cashflow
- —
- DSCR
- —
- Eligible?
- —
Personal DTI + credit; lowest rate.
DSCR
20% down · 8.5% · 30yr
- Down + closing
- —
- Monthly P&I
- —
- Monthly cashflow
- —
- DSCR
- —
- Eligible?
- —
No personal income docs; deal must DSCR.
Hard money
10% down · 12.0% · 12mo
- Down + closing
- —
- Monthly P&I
- —
- Monthly cashflow
- —
- DSCR
- —
- Eligible?
- —
Short-term bridge; refi at stabilization.
Listing history 29 events
-
2026-06-21days on market $167,900 Active 658 DOM
-
2026-06-21days on market $167,900 Active 657 DOM
-
2026-06-18days on market $167,900 Active 655 DOM
-
2026-06-17days on market $167,900 Active 654 DOM
-
2026-06-16days on market $167,900 Active 653 DOM
-
2026-06-15days on market $167,900 Active 652 DOM
-
2026-06-15days on market $167,900 Active 651 DOM
-
2026-06-13days on market $167,900 Active 650 DOM
-
2026-06-12days on market $167,900 Active 649 DOM
-
2026-06-09days on market $167,900 Active 646 DOM
-
2026-06-08days on market $167,900 Active 645 DOM
-
2026-06-08days on market $167,900 Active 644 DOM
-
2026-06-07days on market $167,900 Active 643 DOM
-
2026-06-03days on market $167,900 Active 640 DOM
-
2026-06-02days on market $167,900 Active 639 DOM
-
2026-06-01days on market $167,900 Active 638 DOM
-
2026-05-31days on market $167,900 Active 637 DOM
-
2026-03-01status Active
-
2026-02-28historical
-
2025-08-29price $167,900
-
2025-08-16price $159,900
-
2025-08-03price $179,200
-
2025-05-02price $182,500
-
2025-02-08price $164,500
-
2025-01-08price $179,900
-
2024-12-05price $199,900
-
2024-11-11price $214,900
-
2024-09-27price $244,900
-
2024-08-29$264,900 Active
ⓘ Source: listings_history table (triggers on properties + properties_extension) + one-shot
backfill from property_details.listing_events for pre-trigger history.
Climate risk First Street
- Heat 2/10 Low
- Air quality 2/10 Low 1 unhealthy d/yr today · 1 by 30 yrs out
Nearby sold comps map
Loading sold comps map…
Walkable amenities ~0.75 mi
Loading nearby amenities…
Taxation est. · year 1
- Rental income
- $19,690
- − Mortgage interest
- −$9,405
- − Property taxes
- −$2,518
- − Insurance
- −$840
- − Repairs & maintenance
- −$1,575
- − Management
- −$1,575
- − Depreciation
- −$4,884
- Taxable loss
- −$1,108
- Est. tax savings @ 24.0%
- +$266
- After-tax cash flow
- $1,897/yr
For passive investors: Depreciation is non-cash, so a rental often shows a tax loss while cash-flowing — sheltering income. Rental losses are passive: they offset passive income freely, and up to $25,000/yr can offset ordinary (W-2) income if you actively participate and your MAGI is under $100k (phasing out to $0 by $150k); unused losses carry forward. On sale, claimed depreciation is recaptured at up to 25%, and gains may owe capital-gains tax (a 1031 exchange can defer both). Figures are a year-1 estimate at your 24.0% rate — not tax advice; consult a CPA.
Schools (NCES district)
No district data.
Livability — St. Johnsbury
No livability data for this city. (Only ~50 U.S. cities are tracked.)
Census & demographics
- Census place
- St. Johnsbury, VT
- Population (ZIP)
- 9,323
Population outlook (Caledonia County) Hauer SSP2
- Today (2025)
- 29,828 people
- By 2030
- 28,820 · -3.4%
- By 2040
- 26,262 · -12.0%
- By 2050
- 23,780 · -20.3%
- By 2075
- 18,516 · -37.9%
- By 2100
- 13,647 · -54.2%
Race, ethnicity, and origin ACS 2023
- Neighborhood character
- Predominantly White (92%)
- Race & ethnicity
- White 92% Two or more races 5% Hispanic / Latino 2%
- Common ancestry
- Lithuanian 11% Slovak 6% Serbian 3%
- Foreign-born
- 2% · Canada
- Languages at home
- 93% English-only · French/Haitian/Cajun 3% Other Asian/Pacific 2% Spanish 1%
Political lean MEDSL · Caledonia
- 2024 margin
- D (+12.4) · D 54.5% · R 42.0% · Other 3.5%
- 2008→2024 swing
- -10.8pp toward R · 2008: 23.3pp · 2024: 12.4pp
- All cycles
- 2024: D+12.4 2020: D+15.2 2016: D+7.0 2012: D+22.9 2008: D+23.3
Not yet ingested
- Civics
- —
Market trends
- HPI YoY
- ▼ -2.41%
- Current HPI
- 291.8894
- Rent YoY
- —
- Metro
- —
- State GDP YoY
- —
- F500 in state
- 0
Price history
-36.6% since first listed12 events — show timeline
- 2026-03-01 Relisted — PrimeMLS
- 2026-02-28 Delisted — PrimeMLS
- 2025-08-29 Price Changed $167,900 PrimeMLS
- 2025-08-16 Price Changed $159,900 PrimeMLS
- 2025-08-03 Price Changed $179,200 PrimeMLS
- 2025-05-02 Price Changed $182,500 PrimeMLS
- 2025-02-08 Price Changed $164,500 PrimeMLS
- 2025-01-08 Price Changed $179,900 PrimeMLS
- 2024-12-05 Price Changed $199,900 PrimeMLS
- 2024-11-11 Price Changed $214,900 PrimeMLS
- 2024-09-27 Price Changed $244,900 PrimeMLS
- 2024-08-29 Listed $264,900 PrimeMLS
Cash-flow waterfall
monthlySold comps — $/sqft
last 12 mo · ≤1 miLoading sold comps…