113 Fawnwood Dr · Lake Wallenpaupack Estates, PA
Flood risk 1/10 · Minimal
- FEMA flood zone
- X (unshaded)
- Chance of flooding over 30 yrs
- 0.0%
- Est. flood insurance / yr
- $473 – $860
Fire risk 2/10 · Minimal
- Est. fire insurance / yr
- $511 – $949
Heat risk 2/10 · Minimal
- Hot days now (above 91°F)
- 7 days/yr
- Hot days in 30 yrs
- 16 days/yr
Wind risk 3/10 · Minor
- Chance of severe wind over 30 yrs
- 5.0%
Air-quality risk 2/10 · Minimal
- Unhealthy air days now
- 1 days/yr
- Unhealthy air days in 30 yrs
- 2 days/yr
Risk factors via First Street. Map © Google.
Why this score? — see what drove the C+ grade
The composite is a weighted blend of 9 inputs, each scored 0–100. Each bar is that input's sub-score; the figure is the points it added to the 100-point composite (weight × sub-score).
- Cash flow +17.1/30.0
- ARV discount +15.0/15.0
- Appreciation +6.6/10.0
- DSCR +5.3/10.0
- 1% rule +4.6/10.0
- Schools +4.2/10.0
- Rent growth +2.5/5.0
- Livability +2.5/5.0
- Condition / age +2.5/5.0
$239,750
🖨 Deal sheet 📄 Offer letter ✓ Due diligence
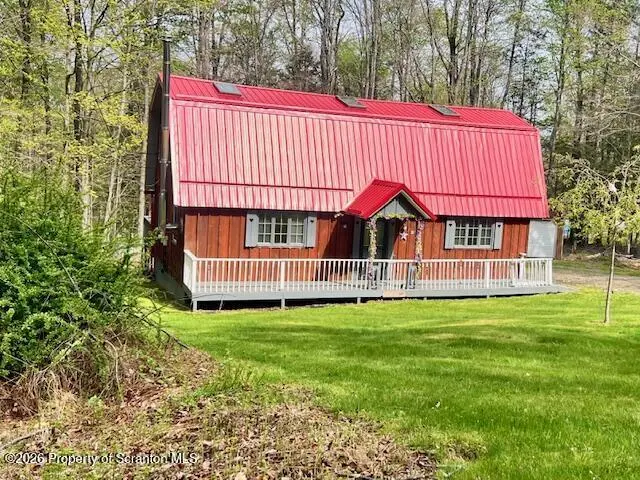
Listing remarks
Charming Chalet style home with great potential for updates. Tucked in a wooded, rustic community by Lake Wallenpaupack and wallenpaupack River. Perfect weekend escape or year round haven. This home offers 4 bedrooms, 2 bathrooms, wood fireplace, open concept with living and dining room combo, skylights on 2nd floor to brighten the area, nice size loft off of 2nd floor bedrooms, one bedroom on the main floor with full bathroom, front and back decks for enjoying nature and relaxing, peach and apple trees in back yard, shed for toys & tools, newer metal roof on home with warranty transfer, propane heat and wood burning stove for back up, boat docking in the community and boat slip a
Key facts
- Double lot
- Front and back decks
- Newer metal roof
Tags
Property features AI
Finance
- Other: Private paved road with road maintenance agreement; Wooded lot
- HOA & community: Homeowners association (annual fee); Annual association fee of $1,200; Association provides trash service; Community clubhouse; Community pool
Exterior
- Parking: Gravel parking; Other parking surface
- Utilities: Well water; Septic tank; Propane available; Electricity available (200+ amp service); Cable available
- Home design: Single family residence; Bi-level / 1.5 to 2 stories; Slab foundation; Built in 1976
- Construction: T1-11 siding; Composition and wood roof
- Exterior features: Private yard; Storage shed(s); Deck; Indoor pool
Interior
- Kitchen: Electric range; Electric oven; Refrigerator
- Bedrooms: 4 bedrooms total; Primary bedroom with skylight; Two additional bedrooms with skylights/standard lighting; Bonus loft set up as workout/office
- Flooring: Carpet; Laminate; Dirt flooring in some area(s)
- Bathrooms: 2 full bathrooms
- Heating & cooling: Baseboard heating; Electric heating; Wood stove; Ceiling fans for cooling
- Interior features: Ceiling fans; High ceilings; Open floor plan; Skylights; Wood burning freestanding fireplace
- Laundry & utility: Washer; Dryer; Laundry room
Neighborhood map
What this means for you Summary
Snapshot
- This is a 3-bed/1.0-bath single-family listed at $240k.
Deal economics
- At list price, monthly cash flow is $167 ($2k/yr) — positive.
- The deal already cash-flows at list — no discount required.
- To meet the 1% rule (rent ≥ 1% of price), the offer needs to be $230k (4.1% below list).
- Recommended offer: $230k (4.1% below list) — sets the bar for 1% rule.
Location & tenants
- Location reads: area grade C — affects rentability + tenant quality, not the cash-flow math above.
- Wallenpaupack Area SD (rural): math 39% / reading 59% proficiency, ranked #192 of 539 in PA (top 36%) — families likely to look elsewhere, expect single-tenant / working-renter base with shorter leases.
- Market conditions: 143 active listings in the ZIP; 1 comparable units currently listed for rent nearby; 213 units permitted in Pike County in 2024 (0 in 5+ unit buildings).
Forward outlook
- In year one you build about $9k of equity ($2k loan paydown + $8k appreciation (3.2% local appreciation)).
- Pike County population projected at -25% by 2050 — secular population decline; favor cash flow + early exit over multi-decade hold.
- At projected returns (3.2% appreciation + 3.0% rent growth), your $67k cash investment doubles in ~6 years — after that, you're playing with house money.
- By year 4, paydown + projected appreciation supports a ~$32k cash-out refi (75% LTV) — recoverable capital for the next deal without selling this one.
Negotiation context
- It's been on market 41 days — a 3% lower offer ($233k) is reasonable based on typical stale-listing flexibility.
- 4 sale attempts since 15y ago; this cycle's ask has dropped $29k (11%) from the opening price — seller is motivated, your offer sets the floor, not the list.
- Current owner paid $60k; list at $240k implies a 300% gain — meaningful room to come down on a strong offer.
Questions for the listing agent
- It's been on market 41 days. Have you received any prior offers? Is the seller open to a 4% concession, seller financing, or rate buy-down credit?
- Built in 1976 — when were the roof, HVAC, electrical panel, plumbing, and water heater last replaced?
- What does the HOA fee cover, when was the last increase, and are there any pending special assessments or reserve-fund shortfalls?
- Is there a deadline driving the sale (1031 exchange, divorce, estate, relocation)? That informs how much negotiation room exists.
- What's the average days-on-market for RENTAL listings here right now (not sales)? A rising rental-DOM trend means longer vacancies and softer asking-rent achievability than the comps imply.
- What's the recent tenant-quality profile in this submarket — average credit score on applications, eviction rate, late-payment / NSF rate, and stable-employment percentage? A property-management company in the area should have these aggregated.
- How much new for-sale + rental construction is in the pipeline within 1–3 miles? Heavy new supply typically softens prices + rents 12–24 months out; constrained supply supports both.
Investment metrics
- 1% rule
- 0.96% ✗
- Cap rate
- 7.13%
- Cash-on-cash
- 2.98%
- DSCR
- 1.13
- GRM
- 8.7
CMA / ARV
- ARV (median comp)
- $312,744
- List price
- $239,750
- Delta
- -23.34%
- Verdict
- UNDERPRICED
- Comps
- 20 within 1.0 mi
Show comp detail 5 sales within ~0.75 mi
| Address | Dist | Beds/Ba | Sqft | Sold | Price | $/sf | Match |
|---|---|---|---|---|---|---|---|
| 117 Pickerel Ln | 0.41mi | 3/2.5 | 1,362 (-0%) | 2mo | $330,000 | $242 | 73 |
| 198 Lake Front Dr | 0.42mi | 3/1.0 | 1,377 (+1%) | 20mo | $279,900 | $203 | 63 |
| 102 Hillcrest Dr | 0.39mi | 3/1.0 | 1,280 (-6%) | 22mo | $325,000 | $254 | 53 |
| 141 River Rd | 0.54mi | 3/2.0 | 1,355 (-1%) | 23mo | $550,000 | $406 | 50 |
| 40 Honey Bear Rd | 0.61mi | 3/2.0 | 1,296 (-5%) | 11mo | $269,900 | $208 | 50 |
Match score weights: distance 35% · size 25% · config 20% · recency 20%. Top-matched comps best support the ARV.
Projected returns pro-forma
3.25% appreciation · 3.0% rent growth · sell at horizon
- IRR
- 11.0%
- Equity multiple
- 1.64×
- Total profit
- $42,755
- Equity at exit
- $111,215
- IRR
- 13.0%
- Equity multiple
- 2.99×
- Total profit
- $133,441
- Equity at exit
- $174,097
Cash invested: $67,130 (down + closing). Projections, not guarantees.
Landlord ↔ Tenant lean methodology
- Overall (STATE)
- 62 Landlord-Friendly
- State Pennsylvania
- 62 Landlord-Friendly · EVEN
- County
- — inherits STATE
- City
- — inherits STATE
ZIP-level market 18426
- Home prices YoY
- 1.4%
- Active inventory
- 143
- Price-to-rent
- 8.7×
Monthly cashflow live
- Estimated rent
- $2,300 medium interval (Pro) →
- Mortgage (P&I)
- −$1,257
- Tax from tax record
- −$193 /mo · $2,314/yr
- Insurance
- −$100
- HOA
- −$100
- Vacancy / Maint / Mgmt
- −$483
- Net cashflow
- $167
Break-even live
UW: 25.0% down · 7.5% · 30yr · 1.5% tax · 5.0% vac · 8.0% maint · 8.0% mgmt
Financing live
Cash to close
- Down payment
- $59,938
- Closing costs
- $7,192
- Reserves months
- —
- Total cash needed
- —
Loan-product check · same deal, 3 products live
Conventional
25% down · 7.5% · 30yr
- Down + closing
- —
- Monthly P&I
- —
- Monthly cashflow
- —
- DSCR
- —
- Eligible?
- —
Personal DTI + credit; lowest rate.
DSCR
20% down · 8.5% · 30yr
- Down + closing
- —
- Monthly P&I
- —
- Monthly cashflow
- —
- DSCR
- —
- Eligible?
- —
No personal income docs; deal must DSCR.
Hard money
10% down · 12.0% · 12mo
- Down + closing
- —
- Monthly P&I
- —
- Monthly cashflow
- —
- DSCR
- —
- Eligible?
- —
Short-term bridge; refi at stabilization.
Rent comps 1 comps
| Address | Beds | Baths | Sqft | Rent | $/sqft | DOM | Units | Dist |
|---|---|---|---|---|---|---|---|---|
| 12 Dogwood Ln Lake Ariel, PA | 3.0 | 2.0 | 1832 | $2,300 | $1.26 | 13d | 1 | 0.71mi |
HOA detail
- Monthly dues
- $100 · $1,200/yr
Listing history 22 events
-
2026-06-18days on market $239,750 Active 41 DOM
-
2026-06-17days on market $239,750 Active 40 DOM
-
2026-06-16days on market $239,750 Active 39 DOM
-
2026-06-15days on market $239,750 Active 38 DOM
-
2026-06-13days on market $239,750 Active 36 DOM
-
2026-06-13pricedays on market $239,750 Active 35 DOM
-
2026-06-09days on market $259,775 Active 32 DOM
-
2026-06-08days on market $259,775 Active 31 DOM
-
2026-06-07days on market $259,775 Active 30 DOM
-
2026-06-04days on market $259,775 Active 27 DOM
-
2026-06-03days on market $259,775 Active 26 DOM
-
2026-06-02days on market $259,775 Active 25 DOM
-
2026-06-01days on market $259,775 Active 24 DOM
-
2026-05-31days on market $259,775 Active 23 DOM
-
2026-05-08$268,500 Active 1150-char remark
-
2025-11-28price $270,000
-
2025-11-03status Active
-
2025-10-07price $300,000
-
2025-06-13price $315,000
-
2025-05-03$340,000 Active
-
2011-05-17$149,700
-
2000-06-16soldstatus $60,000
ⓘ Source: listings_history table (triggers on properties + properties_extension) + one-shot
backfill from property_details.listing_events for pre-trigger history.
Tax reassessment forecast PA · Partial reset (capped growth)
- Current annual tax
- $2,314 · $193/mo
- Projected year-2 tax
- $3,051 · $254/mo
- Expected delta
- +$737/yr (+$61/mo · 31.8%)
ⓘ Screening estimate from a state-policy table — verify with the county assessor before closing.
Climate risk First Street
- Flood 1/10 Low FEMA zone X (unshaded) · 0% chance over 30 yrs
- Wildfire 2/10 Low
- Heat 2/10 Low 7 d/yr ≥91°F today · 16 d/yr by 30 yrs out
- Wind 3/10 Moderate 5% chance of damaging wind over 30 yrs
- Air quality 2/10 Low 1 unhealthy d/yr today · 2 by 30 yrs out
Nearby sold comps map
Loading sold comps map…
Walkable amenities ~0.75 mi
Loading nearby amenities…
Taxation est. · year 1
- Rental income
- $27,600
- − Mortgage interest
- −$13,430
- − Property taxes
- −$2,314
- − Insurance
- −$1,199
- − Repairs & maintenance
- −$2,208
- − Management
- −$2,208
- − HOA
- −$1,200
- − Depreciation
- −$6,975
- Taxable loss
- −$1,933
- Est. tax savings @ 24.0%
- +$464
- After-tax cash flow
- $2,468/yr
For passive investors: Depreciation is non-cash, so a rental often shows a tax loss while cash-flowing — sheltering income. Rental losses are passive: they offset passive income freely, and up to $25,000/yr can offset ordinary (W-2) income if you actively participate and your MAGI is under $100k (phasing out to $0 by $150k); unused losses carry forward. On sale, claimed depreciation is recaptured at up to 25%, and gains may owe capital-gains tax (a 1031 exchange can defer both). Figures are a year-1 estimate at your 24.0% rate — not tax advice; consult a CPA.
Schools (NCES district)
- District
- Wallenpaupack Area SD
- NCES district ID
- 4224750
- Math proficiency
- 39% ▼ -10.00%
- Reading proficiency
- 59% ▼ -5.00%
- Median HH income
- $51,027
- Composite
- 41.97/100
- National rank
- #3345
- State rank
- #192 of 539 in PA
Livability — Lake Wallenpaupack Estates
No livability data for this city. (Only ~50 U.S. cities are tracked.)
Census & demographics
- Census place
- Lake Wallenpaupack Estates, PA
- Population (ZIP)
- 3,426
Population outlook (Pike County) Hauer SSP2
- Today (2025)
- 53,548 people
- By 2030
- 51,622 · -3.6%
- By 2040
- 46,490 · -13.2%
- By 2050
- 40,372 · -24.6%
- By 2075
- 31,951 · -40.3%
- By 2100
- 26,821 · -49.9%
Race, ethnicity, and origin ACS 2023
- Neighborhood character
- Predominantly White (79%)
- Race & ethnicity
- White 79% Two or more races 12% Hispanic / Latino 11% Asian 3% Black 2%
- Hispanic origin (detail)
- Mexican 1% Puerto Rican 3% Dominican 6%
- Common ancestry
- Romanian 12% Italian 2% Slovak 2%
- Foreign-born
- 4%
- Languages at home
- 89% English-only · Spanish 4% Tagalog/Filipino 2% French/Haitian/Cajun 1%
Political lean MEDSL · Pike
- 2024 margin
- Strong R (+24.1) · D 37.6% · R 61.6%
- 2008→2024 swing
- -19.8pp toward R · 2008: -4.2pp · 2024: -24.1pp
- All cycles
- 2024: R+24.1 2020: R+19.0 2016: R+26.0 2012: R+11.0 2008: R+4.2
Not yet ingested
- Civics
- —
Market trends
- HPI YoY
- ▲ 3.25%
- Current HPI
- 236.763
- Rent YoY
- —
- Metro
- —
- State GDP YoY
- ▲ 1.68%
- F500 in state
- 34
Industry mix (Fortune 500 HQ in PA)
| Industry | F500 HQs | Revenue |
|---|---|---|
| Healthcare | 2 | $309B |
|
||
| Insurance | 2 | $27B |
|
||
| Telecommunications / Media | 1 | $124B |
|
||
| Industrial Distribution | 1 | $22B |
|
||
| Financial Services | 1 | $20B |
|
||
| Chemicals / Materials | 1 | $18B |
|
||
Price history
+299.6% since first listed10 events — show timeline
- 2026-06-10 Price Changed $239,750 GSBR as distributed by MLS GRID
- 2026-05-30 Price Changed $259,775 GSBR as distributed by MLS GRID
- 2026-05-08 Listed $268,500 GSBR as distributed by MLS GRID
- 2025-11-28 Price Changed $270,000 PWMLS
- 2025-11-03 Relisted — PWMLS
- 2025-10-07 Price Changed $300,000 PWMLS
- 2025-06-13 Price Changed $315,000 PWMLS
- 2025-05-03 Listed $340,000 PWMLS
- 2011-05-17 Listed $149,700 GSBR as distributed by MLS GRID
- 2000-06-16 Sold (Public Records) $60,000 Public Records
Property tax history
+2.7%/yrLatest (2026): $2,314 · +3.0% YoY. Source: county tax records.
Cash-flow waterfall
monthlySold comps — $/sqft
last 12 mo · ≤1 miLoading sold comps…