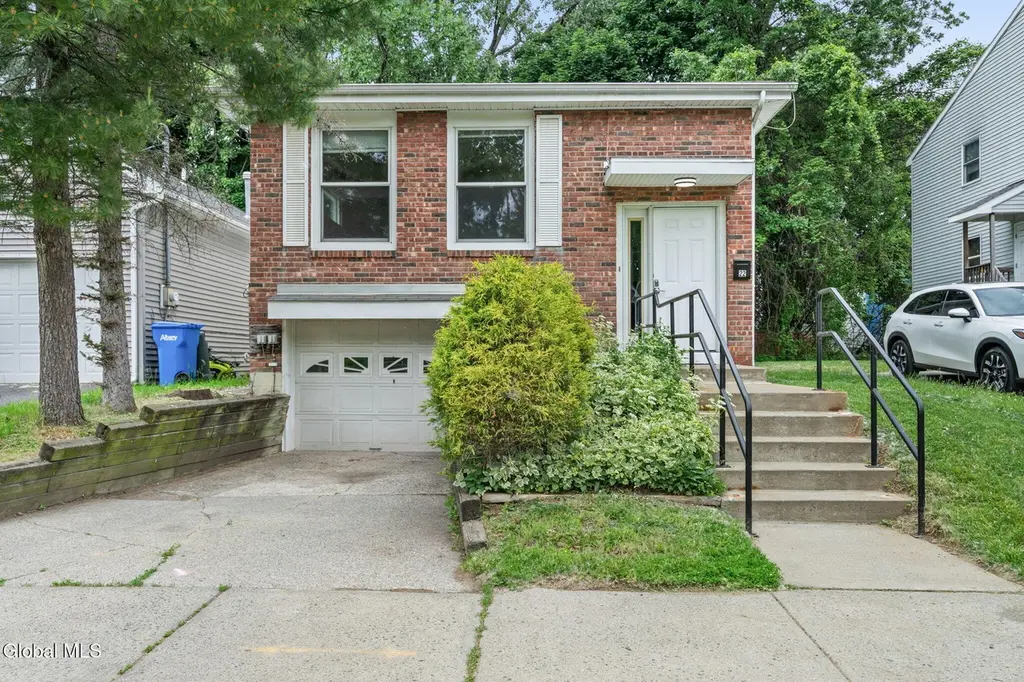
22 View Ave · Albany, NY
Flood risk 1/10 · Minimal
- FEMA flood zone
- X (unshaded)
- Chance of flooding over 30 yrs
- 0.0%
- Est. flood insurance / yr
- $473 – $860
Fire risk 3/10 · Minor
- Est. fire insurance / yr
- $691 – $1,283
Heat risk 4/10 · Minor
- Hot days now (above 99°F)
- 7 days/yr
- Hot days in 30 yrs
- 16 days/yr
Wind risk 3/10 · Minor
- Chance of severe wind over 30 yrs
- 6.0%
Air-quality risk 1/10 · Minimal
- Unhealthy air days now
- 0 days/yr
- Unhealthy air days in 30 yrs
- 0 days/yr
Risk factors via First Street. Map © Google.
Why this score? — see what drove the D+ grade
The composite is a weighted blend of 9 inputs, each scored 0–100. Each bar is that input's sub-score; the figure is the points it added to the 100-point composite (weight × sub-score).
- Cash flow +15.3/30.0
- ARV discount +11.5/15.0
- DSCR +4.7/10.0
- 1% rule +4.2/10.0
- Livability +4.0/5.0
- Schools +3.2/10.0
- Rent growth +2.5/5.0
- Condition / age +2.5/5.0
- Appreciation +0.0/10.0
$239,900
🖨 Deal sheet (PDF) 📄 Offer letter ✓ Due diligence
Listing remarks
Move right into this updated raised ranch featuring recent flooring and fresh interior paint throughout. The flexible layout offers comfortable living space, while the backyard gazebo provides the perfect setting for relaxing or entertaining family and friends. Conveniently located near shopping, dining, and major highways. Retaining wall sold as-is. Don't miss this great opportunity! 3D tour attached. Showings start Saturday 6/6.
Key facts
- Recent flooring
- Flexible layout
- Fresh interior paint
Tags
Property features AI
Exterior
- Parking: Attached garage (1 car); Off-street paved parking
- Utilities: Public water; Public sewer
- Home design: Single family residence; Level, landscaped lot (approximately 31 x 100)
- Construction: Brick and vinyl siding exterior; Block foundation; Asphalt roof; Below-grade finished area in basement
- Exterior features: Paved driveway; Driveway lighting; Drive-paved exterior
Interior
- Kitchen: Dishwasher; Gas oven; Refrigerator
- Bedrooms: Primary bedroom on the first floor; Two additional bedrooms on the first floor
- Flooring: Carpet; Ceramic tile; Laminate
- Bathrooms: Two full bathrooms (one on the first floor, one in the basement)
- Heating & cooling: Hot water heating (natural gas); Central air conditioning
- Interior features: High-speed internet; Solid surface counters; Built-in features; 11 total rooms
- Laundry & utility: Laundry in the basement; Basement utility room
Neighborhood map
What this means for you Summary
Snapshot
- This is a 3-bed/2.0-bath single-family listed at $240k.
Deal economics
- At list price, monthly cash flow is $88 ($1k/yr) — positive.
- The deal already cash-flows at list — no discount required.
- To meet the 1% rule (rent ≥ 1% of price), the offer needs to be $221k (7.9% below list).
- Recommended offer: $221k (7.9% below list) — sets the bar for 1% rule.
Location & tenants
- Location reads 79/100 on livability (#129 in NY, #2,083 nationally) — a middle-class / working-renter tenant base. Strengths: amenities A+, commute A+, housing A+; Watch: employment C-, crime F.
- Albany City School District (urban): math 37% / reading 40% proficiency, ranked #543 of 590 in NY (top 92%) — families likely to look elsewhere, expect single-tenant / working-renter base with shorter leases; 66% free/reduced lunch — lower-income household profile, screen leases tightly.
- Zoned schools: Albany High School (math 74% / reading 67%, grade B+, #710 of 1,100 statewide, top 65%, 2,676 students, 69% FRL) — zoned schools at 69% FRL track the district average.
- Zoned-school proficiency averages 70% at this address vs 38% district-wide (+32 pts) — the actual schools serving this property are materially stronger than the Albany City School District average implies; a family-tenant draw the district grade alone would hide.
- Market conditions: 47 active listings in the ZIP; 26 comparable units currently listed for rent nearby; rentals at typical pace (median 25d on market — plan ~3-4 weeks tenant-placement turnaround); 42% of comp listings sitting > 30 days — soft ceiling on asking rent; 675 units permitted in Albany County in 2024 (451 in 5+ unit buildings).
Forward outlook
- Local home prices are declining (-3.0%/yr); year-one equity from $2k of loan paydown is wiped out by about $7k of value loss. Plan a longer hold.
- Albany County population projected at +9% by 2050 — modest demand growth; plan on rents tracking national, not racing it.
Negotiation context
- Only 13 days on market — expect competitive offers; lowballing is unlikely to land.
Risks & watch-outs
- Watch-outs: built in 1950 — expect roof / HVAC / electrical / plumbing capex.
Questions for the listing agent
- Built in 1950 — when were the roof, HVAC, electrical panel, plumbing, and water heater last replaced?
- Is there a deadline driving the sale (1031 exchange, divorce, estate, relocation)? That informs how much negotiation room exists.
- Crime grade is F in this area — have there been break-ins, vandalism, or insurance claims at this property in the last 3 years? What carrier currently insures it and at what premium?
- The area grade is low — what's the realistic commute time and amenity access for the typical tenant pool here? Any planned neighborhood developments (good or bad) we should know about?
- What's the average days-on-market for RENTAL listings here right now (not sales)? A rising rental-DOM trend means longer vacancies and softer asking-rent achievability than the comps imply.
- What's the recent tenant-quality profile in this submarket — average credit score on applications, eviction rate, late-payment / NSF rate, and stable-employment percentage? A property-management company in the area should have these aggregated.
- How much new for-sale + rental construction is in the pipeline within 1–3 miles? Heavy new supply typically softens prices + rents 12–24 months out; constrained supply supports both.
Investment metrics
- 1% rule
- 0.92% ✗
- Cap rate
- 6.73%
- Cash-on-cash
- 1.57%
- DSCR
- 1.07
- GRM
- 9.0
CMA / ARV
- ARV (on-the-fly)
- $263,314
- Comps found
- 8
Show comp detail 8 sales within ~0.75 mi
| Address | Dist | Beds/Ba | Sqft | Sold | Price | $/sf | Match |
|---|---|---|---|---|---|---|---|
| 24 Summit Ave | 0.30mi | 4/1.5 (+1) | 1,820 (-5%) | 8mo | $173,000 | $95 | 64 |
| 36 Osborne St | 0.55mi | 3/1.5 | 1,788 (-7%) | 10mo | $135,500 | $76 | 53 |
| 339A Madison Ave | 0.66mi | 3/3.0 | 1,890 (-2%) | 13mo | $365,000 | $193 | 51 |
| 16 Regent St | 0.41mi | 3/1.5 | 1,640 (-15%) | 5mo | $205,000 | $125 | 50 |
| 34 Magnolia Ter | 0.19mi | 4/2.0 (+1) | 2,142 (+11%) | 22mo | $292,500 | $137 | 48 |
| 79 Academy Rd | 0.72mi | 3/1.5 | 1,774 (-8%) | 8mo | $305,000 | $172 | 45 |
| 19 Bleecker Pl | 0.71mi | 4/2.0 (+1) | 2,070 (+8%) | 13mo | $195,000 | $94 | 38 |
| 17 Kenosha St | 0.69mi | 4/2.0 (+1) | 1,700 (-12%) | 10mo | $325,000 | $191 | 35 |
Match score weights: distance 35% · size 25% · config 20% · recency 20%. Top-matched comps best support the ARV.
Projected returns pro-forma
-3.0% appreciation · 3.0% rent growth · sell at horizon
- IRR
- -13.8%
- Equity multiple
- 0.51×
- Total profit
- $-33,234
- Equity at exit
- $35,770
- IRR
- -4.9%
- Equity multiple
- 0.68×
- Total profit
- $-21,584
- Equity at exit
- $20,742
Cash invested: $67,172 (down + closing). Projections, not guarantees.
Landlord ↔ Tenant lean methodology
- Overall (STATE)
- 15 Strongly Tenant-Friendly
- State New York
- 15 Strongly Tenant-Friendly · D+10
- County
- — inherits STATE
- City
- — inherits STATE
ZIP-level market 12209
- Home prices YoY
- -7.3%
- Active inventory
- 47
- Price-to-rent
- 9.0×
Monthly cashflow live
- Estimated rent
- $2,210 high interval (Pro) →
- Mortgage (P&I)
- −$1,258
- Tax est. 1.5%
- −$300 /mo · $3,598/yr
- Insurance
- −$100
- HOA
- −$0
- Vacancy / Maint / Mgmt
- −$464
- Net cashflow
- $88
Break-even live
Sensitivity live
| Price | -10% $254 | -5% $171 | +0% $88 | +5% $5 | +10% $-78 |
|---|---|---|---|---|---|
| Rent | -10% $-87 | -5% $1 | +0% $88 | +5% $175 | +10% $263 |
| Rate | -1.0pp $209 | -0.5pp $149 | base $88 | +0.5pp $26 | +1.0pp $-37 |
UW: 25.0% down · 7.5% · 30yr · 1.5% tax · 5.0% vac · 8.0% maint · 8.0% mgmt
Financing live
Cash to close
- Down payment
- $59,975
- Closing costs
- $7,197
- Reserves months
- —
- Total cash needed
- —
Loan-product check · same deal, 3 products live
Conventional
25% down · 7.5% · 30yr
- Down + closing
- —
- Monthly P&I
- —
- Monthly cashflow
- —
- DSCR
- —
- Eligible?
- —
Personal DTI + credit; lowest rate.
DSCR
20% down · 8.5% · 30yr
- Down + closing
- —
- Monthly P&I
- —
- Monthly cashflow
- —
- DSCR
- —
- Eligible?
- —
No personal income docs; deal must DSCR.
Hard money
10% down · 12.0% · 12mo
- Down + closing
- —
- Monthly P&I
- —
- Monthly cashflow
- —
- DSCR
- —
- Eligible?
- —
Short-term bridge; refi at stabilization.
Rent comps 26 comps
| Address | Beds | Baths | Sqft | Rent | $/sqft | DOM | Units | Dist |
|---|---|---|---|---|---|---|---|---|
| 201 Park Ave Unit 10 Albany, NY | 3.0 | 2.0 | 1600 | $2,100 | $1.31 | 45d | 1 | 0.44mi |
| 15 Stanwix St Albany, NY | 4.0 | 1.5 | 1660 | $2,500 | $1.51 | 16d | 1 | 0.51mi |
| 346 Madison Ave Albany, NY | 3.0 | 2.0 | 1500 | $2,495 | $1.66 | 25d | 1 | 0.62mi |
| 88 Willett St Albany, NY | 3.0 | 1.0 | 825 | $2,080 | $2.52 | 16d | 10 | 0.71mi |
| 119 Grand St Albany, NY | 3.0 | 1.0 | 1600 | $1,300 | $0.81 | 45d | 1 | 0.77mi |
| 227 Jay St Albany, NY | 2.0 | 2.0 | 1710 | $2,150 | $1.26 | 45d | 1 | 0.81mi |
| 154 Lancaster St Unit 1 Albany, NY | 2.0 | 1.5 | 1500 | $2,200 | $1.47 | 25d | 1 | 0.81mi |
| 41 Dove St Albany, NY | 2.0 | 2.5 | 2400 | $2,350 | $0.98 | 16d | 1 | 0.88mi |
| 21 Woodlawn Ave Unit 3RDFL Albany, NY | 3.0 | 1.0 | 1300 | $1,500 | $1.15 | 45d | 1 | 0.91mi |
| 21 Woodlawn Ave Unit 3rd floor Albany, NY | 3.0 | 1.0 | 1300 | $1,500 | $1.15 | 25d | 1 | 0.91mi |
| 546 Mercer St Unit 1 Albany, NY | 3.0 | 1.0 | 1400 | $1,800 | $1.29 | 25d | 1 | 0.91mi |
| 240 Washington Ave Albany, NY | 2.0 | 2.0 | 1560 | $2,450 | $1.57 | 45d | 1 | 1.01mi |
| 257 Quail St Albany, NY | 4.0 | 2.5 | 2208 | $2,800 | $1.27 | 45d | 1 | 1.15mi |
| 363 Ontario St Albany, NY | 1.0–2.0 | 1.0–2.5 | 1610 | $3,485 | $2.16 | 16d | 1 | 1.18mi |
| 48 N Pearl St Albany, NY | 2.0 | 1.0–2.5 | 1251 | $3,500 | $2.80 | 16d | 17 | 1.19mi |
| 147 Western Ave Albany, NY | 3.0 | 1.0 | 1428 | $1,800 | $1.26 | 16d | 1 | 1.19mi |
| 178 Western Ave Unit 3 Albany, NY | 3.0 | 1.0 | 1500 | $1,725 | $1.15 | 16d | 1 | 1.20mi |
| 58 Elberon Pl Apt 2 Albany, NY | 4.0 | 1.0 | 1250 | $2,200 | $1.76 | 45d | 1 | 1.20mi |
| 38 W Erie St Albany, NY | 4.0 | 2.0 | 1440 | $2,800 | $1.94 | 25d | 1 | 1.34mi |
| 32 1st St Albany, NY | 4.0 | 1.5 | 1773 | $1,850 | $1.04 | 45d | 1 | 1.36mi |
| 154 Spring St Albany, NY | 3.0 | 1.0 | 2500 | $1,695 | $0.68 | 45d | 1 | 1.37mi |
| 15 Ten Broeck St Albany, NY | 2.0 | 1.5 | 1900 | $1,750 | $0.92 | 23d | 1 | 1.38mi |
| 30 Cardinal Ave Albany, NY | 4.0 | 1.0 | 1529 | $2,800 | $1.83 | 46d | 1 | 1.39mi |
| 32 Peyster St Unit 2nd Albany, NY | 3.0 | 2.0 | 1500 | $2,300 | $1.53 | 45d | 1 | 1.45mi |
| 602 Morris St Albany, NY | 3.0 | 1.0 | 1270 | $1,850 | $1.46 | 16d | 1 | 1.46mi |
| 99 New Broadway Rensselaer, NY | 2.0 | 1.0–2.0 | 946 | $2,495 | $2.64 | 16d | 5 | 1.49mi |
Listing history 8 events
-
2026-06-16statusdays on market $239,900 Pending 13 DOM
-
2026-06-15days on market $239,900 Active 12 DOM
-
2026-06-14days on market $239,900 Active 10 DOM
-
2026-06-10days on market $239,900 Active 7 DOM
-
2026-06-08days on market $239,900 Active 5 DOM
-
2026-06-07days on market $239,900 Active 4 DOM
-
2026-06-03remarks 434-char remark
-
2026-06-03$239,900 Active 1 DOM
ⓘ Source: listings_history table (triggers on properties + properties_extension) + one-shot
backfill from property_details.listing_events for pre-trigger history.
Climate risk First Street
- Flood 1/10 Low FEMA zone X (unshaded) · 0% chance over 30 yrs
- Wildfire 3/10 Moderate
- Heat 4/10 Moderate 7 d/yr ≥99°F today · 16 d/yr by 30 yrs out
- Wind 3/10 Moderate 6% chance of damaging wind over 30 yrs
- Air quality 1/10 Low 0 unhealthy d/yr today · 0 by 30 yrs out
Nearby sold comps map
Loading sold comps map…
Walkable amenities ~0.75 mi
Loading nearby amenities…
Taxation est. · year 1
- Rental income
- $26,520
- − Mortgage interest
- −$13,438
- − Property taxes
- −$3,598
- − Insurance
- −$1,200
- − Repairs & maintenance
- −$2,122
- − Management
- −$2,122
- − Depreciation
- −$6,979
- Taxable loss
- −$2,938
- Est. tax savings @ 24.0%
- +$705
- After-tax cash flow
- $1,762/yr
For passive investors: Depreciation is non-cash, so a rental often shows a tax loss while cash-flowing — sheltering income. Rental losses are passive: they offset passive income freely, and up to $25,000/yr can offset ordinary (W-2) income if you actively participate and your MAGI is under $100k (phasing out to $0 by $150k); unused losses carry forward. On sale, claimed depreciation is recaptured at up to 25%, and gains may owe capital-gains tax (a 1031 exchange can defer both). Figures are a year-1 estimate at your 24.0% rate — not tax advice; consult a CPA.
Schools (NCES district)
- District
- Albany City School District
- NCES district ID
- 3602460
- Math proficiency
- 37% ▲ 6.00%
- Reading proficiency
- 40% ▲ 7.00%
- Median HH income
- $40,568
- Composite
- 32.34/100
- National rank
- #5744
- State rank
- #543 of 590 in NY
Livability — Albany
- Score
- 79/100
- State rank
- #129
- US rank
- #2083
Category grades
Schools grade is shown separately in the Schools card above.
Census & demographics
- Census place
- Albany, NY
- City population
- 116,921
- Population (ZIP)
- 10,754
Population outlook (Albany County) Hauer SSP2
- Today (2025)
- 320,794 people
- By 2030
- 327,401 · +2.1%
- By 2040
- 338,218 · +5.4%
- By 2050
- 348,467 · +8.6%
- By 2075
- 381,693 · +19.0%
- By 2100
- 393,809 · +22.8%
Race, ethnicity, and origin ACS 2023
- Neighborhood character
- Diverse neighborhood (Simpson 0.69)
- Race & ethnicity
- White 46% Black 23% Hispanic / Latino 19% Asian 8% Two or more races 7%
- Hispanic origin (detail)
- Puerto Rican 6%
- Common ancestry
- Romanian 4% Lithuanian 3% Serbian 1%
- Foreign-born
- 18% · Canada, Philippines, South Korea
- Languages at home
- 77% English-only · Spanish 13% Other Asian/Pacific 3% Tagalog/Filipino 1%
Political lean MEDSL · Albany
- 2024 margin
- Strong D (+25.8) · D 62.9% · R 37.1%
- 2008→2024 swing
- -3.6pp toward R · 2008: 29.4pp · 2024: 25.8pp
- All cycles
- 2024: D+25.8 2020: D+31.4 2016: D+24.3 2012: D+31.0 2008: D+29.4
Not yet ingested
- Civics
- —
Market trends
- HPI YoY
- ▼ -24.91%
- Current HPI
- 318.0191
- Rent YoY
- —
- Metro
- —
- State GDP YoY
- ▲ 2.60%
- F500 in state
- 92
Industry mix (Fortune 500 HQ in NY)
| Industry | F500 HQs | Revenue |
|---|---|---|
| Financial Services | 10 | $950B |
|
||
| Consumer Goods | 9 | $162B |
|
||
| Insurance | 4 | $225B |
|
||
| Telecommunications | 2 | $144B |
|
||
| Pharmaceuticals | 2 | $112B |
|
||
| Media / Entertainment | 2 | $69B |
|
||
Price history
1 event — show timeline
- 2026-06-03 Listed $239,900 Global MLS
Property tax history
-27.6%/yrLatest (2025): $180 · +100.0% YoY. Source: county tax records.
Cash-flow waterfall
monthlySold comps — $/sqft
last 12 mo · ≤1 miLoading sold comps…