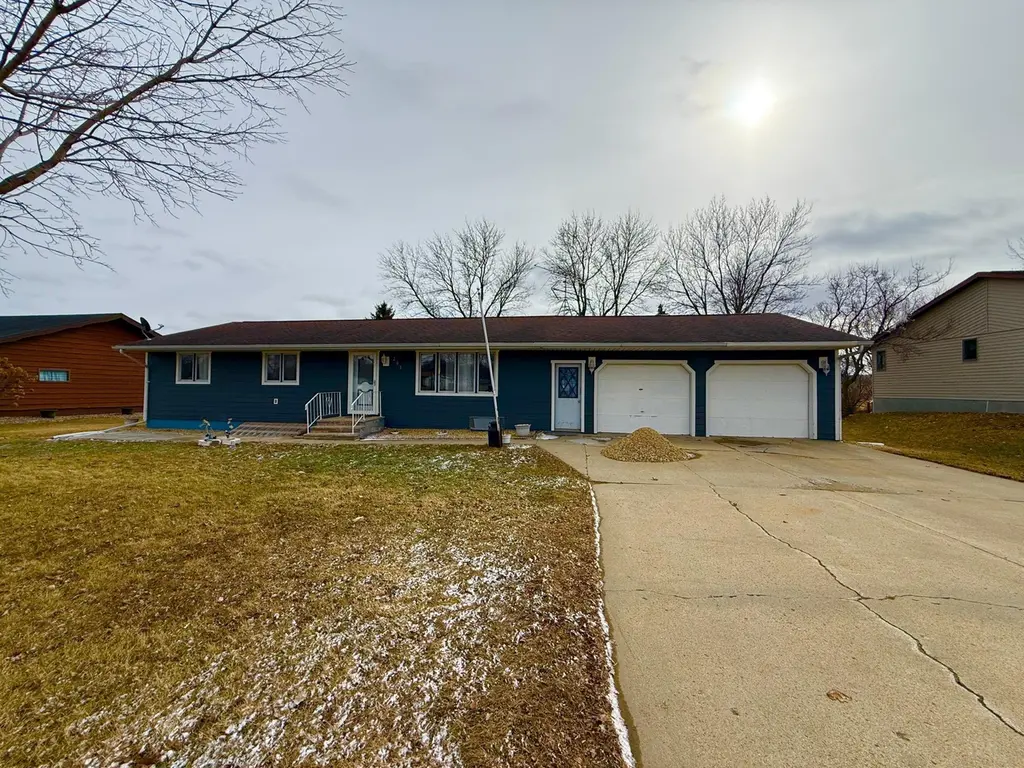
201 Main Ave · Chandler, MN
Flood risk No data
- FEMA flood zone
- —
- Chance of flooding over 30 yrs
- —
- Est. flood insurance / yr
- —
Fire risk No data
- Est. fire insurance / yr
- —
Heat risk No data
- Hot days now (above threshold)
- —
- Hot days in 30 yrs
- —
Wind risk No data
- Chance of severe wind over 30 yrs
- —
Air-quality risk No data
- Unhealthy air days now
- —
- Unhealthy air days in 30 yrs
- —
Risk factors via First Street. Map © Google.
Why this score? — see what drove the D grade
The composite is a weighted blend of 9 inputs, each scored 0–100. Each bar is that input's sub-score; the figure is the points it added to the 100-point composite (weight × sub-score).
- Cash flow +10.6/30.0
- ARV discount +7.5/15.0
- Schools +5.5/10.0
- Appreciation +5.0/10.0
- Livability +3.1/5.0
- DSCR +3.0/10.0
- Rent growth +2.5/5.0
- Condition / age +2.5/5.0
- 1% rule +2.2/10.0
$170,000
🖨 Deal sheet (PDF) 📄 Offer letter ✓ Due diligence
Listing remarks
Do you like rural or small town living? This is the best of both worlds. This home is located in the charming little town of Chandler. It features 3 bedrooms, all located on the main floor and 3 bathrooms. The basement has a large family room with a large window that lets in some great natural lighting. Use the bonus room as an in home office or gaming room. Recently updated siding in 2023. New central AC and water heater in 2025. Basement flooring all re-done with epoxy finish. You will enjoy the large backyard with a spacious deck for those summer backyard bbq's or simply to enjoy the sunset. Call to schedule your private showing today!
Key facts
- Central ac
- Large family room
- Updated siding
Tags
Property features AI
Exterior
- Parking: Attached garage (concrete); 2-car garage, approximately 26x26
- Utilities: City water (in street); City sewer (in street); 200+ amp electrical service with circuit breakers; Propane fuel
- Home design: Residential property; One level; Main level primary bedroom; Above- and below-grade finished living areas
- Construction: Block construction; Asphalt roof (age over 8 years); Block foundation; Foundation dimensions approximately 26x48; Built with finished areas above and below grade
- Exterior features: Deck; Storage shed; Irregular lot with light tree coverage; City street frontage; Publicly maintained road
Interior
- Kitchen: Range; Microwave; Refrigerator; Freezer; Exhaust fan
- Bedrooms: 3 bedrooms (all on main level)
- Bathrooms: 1 full bathroom; 2 half bathrooms; Basement half bath; Main floor half bath; Main floor full bath
- Heating & cooling: Forced air heating; Central air conditioning
- Interior features: Ceiling fan(s); Kitchen window; Main floor primary bedroom; Water softener (owned)
- Laundry & utility: Washer/dryer hookup; Main level laundry; Humidifier
Neighborhood map
What this means for you Summary
Snapshot
- This is a 3-bed/3.0-bath single-family listed at $170k.
Deal economics
- At list price, monthly cash flow is $-85 ($-1k/yr) — negative.
- To cash-flow at today's rent, offer at most $155k (8.8% below list).
- To meet the 1% rule (rent ≥ 1% of price), the offer needs to be $122k (28.0% below list).
- Recommended offer: $122k (28.0% below list) — sets the bar for 1% rule.
Location & tenants
- Location reads 62/100 on livability (#705 in MN) — a middle-class / working-renter tenant base. Strengths: cost of living A+, employment B+, housing B; Watch: health & safety D+, crime D, amenities F.
- Murray County Central School District (rural): math 68% / reading 60% proficiency, ranked #28 of 301 in MN (top 9%) — acceptable for families but not a draw, mixed tenant base, ~2y average lease.
- Zoned schools: Murray Co. Central Elementary (math 76% / reading 57%, grade B+, #113 of 857 statewide, top 14%, 386 students, 43% FRL); Murray County Central Secondary (math 57% / reading 62%, grade C+, #46 of 471 statewide, top 11%, 335 students, 35% FRL) — zoned schools average 39% FRL vs 22% district-wide (17 pts higher); higher-poverty schools than district average — tighter screening recommended.
- Market conditions: 1 active listings in the ZIP; 21 units permitted in Murray County in 2024 (0 in 5+ unit buildings).
Forward outlook
- In year one you build about $6k of equity ($1k loan paydown + $5k appreciation (3.0% local appreciation)).
- Murray County population projected at -14% by 2050 — secular population decline; favor cash flow + early exit over multi-decade hold.
- By year 6, paydown + projected appreciation supports a ~$33k cash-out refi (75% LTV) — recoverable capital for the next deal without selling this one.
Negotiation context
- It's been on market 122 days — a 12% lower offer ($150k) is reasonable based on typical stale-listing flexibility.
Questions for the listing agent
- What do current leases actually rent for vs. the listed asking? Can we see a recent rent roll and the last 12 months of T-12 income?
- It's been on market 122 days. Have you received any prior offers? Is the seller open to a 28% concession, seller financing, or rate buy-down credit?
- Built in 1976 — when were the roof, HVAC, electrical panel, plumbing, and water heater last replaced?
- Why hasn't it sold? Are there any deal-killer items the seller is aware of (foundation, flood, title, zoning, code violations)?
- Is there a deadline driving the sale (1031 exchange, divorce, estate, relocation)? That informs how much negotiation room exists.
- Schools are F-rated, which usually means shorter tenancies and higher turnover. Who's the typical renter profile here, and what's been the actual vacancy rate?
- Crime grade is D in this area — have there been break-ins, vandalism, or insurance claims at this property in the last 3 years? What carrier currently insures it and at what premium?
- The area grade is low — what's the realistic commute time and amenity access for the typical tenant pool here? Any planned neighborhood developments (good or bad) we should know about?
- What's the average days-on-market for RENTAL listings here right now (not sales)? A rising rental-DOM trend means longer vacancies and softer asking-rent achievability than the comps imply.
- What's the recent tenant-quality profile in this submarket — average credit score on applications, eviction rate, late-payment / NSF rate, and stable-employment percentage? A property-management company in the area should have these aggregated.
- How much new for-sale + rental construction is in the pipeline within 1–3 miles? Heavy new supply typically softens prices + rents 12–24 months out; constrained supply supports both.
Investment metrics
- 1% rule
- 0.72% ✗
- Cap rate
- 5.70%
- Cash-on-cash
- -2.14%
- DSCR
- 0.90
- GRM
- 11.6
CMA / ARV
No comps found within radius.
Projected returns pro-forma
3.0% appreciation · 3.0% rent growth · sell at horizon
- IRR
- 5.5%
- Equity multiple
- 1.32×
- Total profit
- $15,028
- Equity at exit
- $76,439
- IRR
- 8.5%
- Equity multiple
- 2.28×
- Total profit
- $61,006
- Equity at exit
- $117,802
Cash invested: $47,600 (down + closing). Projections, not guarantees.
Landlord ↔ Tenant lean methodology
- Overall (STATE)
- 46 Balanced
- State Minnesota
- 46 Balanced · D+2
- County
- — inherits STATE
- City
- — inherits STATE
ZIP-level market 56122
- Active inventory
- 1
- Price-to-rent
- 11.6×
Monthly cashflow live
- Estimated rent
- $1,225 medium interval (Pro) →
- Mortgage (P&I)
- −$891
- Tax from tax record
- −$90 /mo · $1,080/yr
- Insurance
- −$71
- HOA
- −$0
- Vacancy / Maint / Mgmt
- −$257
- Net cashflow
- $-85
Break-even live
Sensitivity live
| Price | -10% $12 | -5% $-37 | +0% $-85 | +5% $-133 | +10% $-181 |
|---|---|---|---|---|---|
| Rent | -10% $-181 | -5% $-133 | +0% $-85 | +5% $-36 | +10% $12 |
| Rate | -1.0pp $1 | -0.5pp $-41 | base $-85 | +0.5pp $-129 | +1.0pp $-174 |
UW: 25.0% down · 7.5% · 30yr · 1.5% tax · 5.0% vac · 8.0% maint · 8.0% mgmt
Financing live
Cash to close
- Down payment
- $42,500
- Closing costs
- $5,100
- Reserves months
- —
- Total cash needed
- —
Loan-product check · same deal, 3 products live
Conventional
25% down · 7.5% · 30yr
- Down + closing
- —
- Monthly P&I
- —
- Monthly cashflow
- —
- DSCR
- —
- Eligible?
- —
Personal DTI + credit; lowest rate.
DSCR
20% down · 8.5% · 30yr
- Down + closing
- —
- Monthly P&I
- —
- Monthly cashflow
- —
- DSCR
- —
- Eligible?
- —
No personal income docs; deal must DSCR.
Hard money
10% down · 12.0% · 12mo
- Down + closing
- —
- Monthly P&I
- —
- Monthly cashflow
- —
- DSCR
- —
- Eligible?
- —
Short-term bridge; refi at stabilization.
Listing history 20 events
-
2026-06-22days on market $170,000 Active 122 DOM
-
2026-06-21days on market $170,000 Active 121 DOM
-
2026-06-21days on market $170,000 Active 120 DOM
-
2026-06-18days on market $170,000 Active 118 DOM
-
2026-06-17days on market $170,000 Active 117 DOM
-
2026-06-16days on market $170,000 Active 116 DOM
-
2026-06-15days on market $170,000 Active 115 DOM
-
2026-06-13days on market $170,000 Active 113 DOM
-
2026-06-12days on market $170,000 Active 112 DOM
-
2026-06-09statusdays on market $170,000 Active 109 DOM
-
2026-06-08days on market $170,000 Contingent - Sale of Another Property 108 DOM
-
2026-06-07days on market $170,000 Contingent - Sale of Another Property 107 DOM
-
2026-06-07days on market $170,000 Contingent - Sale of Another Property 106 DOM
-
2026-06-04pricedays on market $170,000 Contingent - Sale of Another Property 103 DOM
-
2026-06-02days on market $175,000 Contingent - Sale of Another Property 102 DOM
-
2026-06-01days on market $175,000 Contingent - Sale of Another Property 101 DOM
-
2026-05-31days on market $175,000 Contingent - Sale of Another Property 100 DOM
-
2026-05-31days on market $175,000 Contingent - Sale of Another Property 99 DOM
-
2026-03-24historical Contingent - Sale of Another Property
-
2026-02-18$175,000 Active
ⓘ Source: listings_history table (triggers on properties + properties_extension) + one-shot
backfill from property_details.listing_events for pre-trigger history.
Tax reassessment forecast MN · Partial reset (capped growth)
- Current annual tax
- $1,080 · $90/mo
- Projected year-2 tax
- $1,492 · $124/mo
- Expected delta
- +$412/yr (+$34/mo · 38.1%)
ⓘ Screening estimate from a state-policy table — verify with the county assessor before closing.
Nearby sold comps map
Loading sold comps map…
Walkable amenities ~0.75 mi
Loading nearby amenities…
Taxation est. · year 1
- Rental income
- $14,698
- − Mortgage interest
- −$9,523
- − Property taxes
- −$1,080
- − Insurance
- −$850
- − Repairs & maintenance
- −$1,176
- − Management
- −$1,176
- − Depreciation
- −$4,945
- Taxable loss
- −$4,052
- Est. tax savings @ 24.0%
- +$972
- After-tax cash flow
- $-44/yr
For passive investors: Depreciation is non-cash, so a rental often shows a tax loss while cash-flowing — sheltering income. Rental losses are passive: they offset passive income freely, and up to $25,000/yr can offset ordinary (W-2) income if you actively participate and your MAGI is under $100k (phasing out to $0 by $150k); unused losses carry forward. On sale, claimed depreciation is recaptured at up to 25%, and gains may owe capital-gains tax (a 1031 exchange can defer both). Figures are a year-1 estimate at your 24.0% rate — not tax advice; consult a CPA.
Schools (NCES district)
- District
- Murray County Central School District
- NCES district ID
- 2700090
- Math proficiency
- 68% ▲ 8.00%
- Reading proficiency
- 60% ▼ -6.00%
- Median HH income
- $50,848
- Composite
- 54.52/100
- National rank
- #1344
- State rank
- #28 of 301 in MN
Livability — Chandler
- Score
- 62/100
- State rank
- #705
- US rank
- #16990
Category grades
Schools grade is shown separately in the Schools card above.
Census & demographics
- Census place
- Chandler, MN
- Population (ZIP)
- 621
Population outlook (Murray County) Hauer SSP2
- Today (2025)
- 7,978 people
- By 2030
- 7,715 · -3.3%
- By 2040
- 7,213 · -9.6%
- By 2050
- 6,820 · -14.5%
- By 2075
- 6,371 · -20.1%
- By 2100
- 5,729 · -28.2%
Race, ethnicity, and origin ACS 2023
- Neighborhood character
- Predominantly White (75%)
- Race & ethnicity
- White 75% Hispanic / Latino 22% Two or more races 4%
- Hispanic origin (detail)
- Mexican 11% Puerto Rican 3%
- Common ancestry
- Iranian 38% Portuguese 5% Lithuanian 2%
- Foreign-born
- 13% · Canada
- Languages at home
- 80% English-only · Spanish 20% German/W. Germanic 1%
Political lean MEDSL · Murray
- 2024 margin
- Solid R (+42.4) · D 27.9% · R 70.4% · Other 1.7%
- 2008→2024 swing
- -42.9pp toward R · 2008: 0.5pp · 2024: -42.4pp
- All cycles
- 2024: R+42.4 2020: R+39.1 2016: R+36.2 2012: R+7.2 2008: D+0.5
Not yet ingested
- Civics
- —
Market trends
- HPI YoY
- —
- Current HPI
- —
- Rent YoY
- —
- Metro
- —
- State GDP YoY
- ▲ 2.41%
- F500 in state
- 34
Industry mix (Fortune 500 HQ in MN)
| Industry | F500 HQs | Revenue |
|---|---|---|
| Healthcare | 2 | $407B |
|
||
| Retail | 2 | $150B |
|
||
| Consumer Goods | 2 | $32B |
|
||
| Industrial Machinery | 2 | $6B |
|
||
| Agriculture | 1 | $40B |
|
||
| Healthcare / Medical Devices | 1 | $32B |
|
||
Price history
2 events — show timeline
- 2026-03-24 Contingent — NORTHSTARMLS as Distributed by MLS Grid
- 2026-02-18 Listed $175,000 NORTHSTARMLS as Distributed by MLS Grid
Property tax history
+5.6%/yrLatest (2026): $1,080 · +45.9% YoY. Source: county tax records.
Cash-flow waterfall
monthlySold comps — $/sqft
last 12 mo · ≤1 miLoading sold comps…