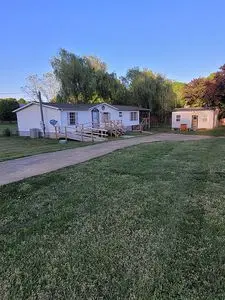
127 County Road 77 · Riceville, TN
Flood risk 1/10 · Minimal
- FEMA flood zone
- X (unshaded)
- Chance of flooding over 30 yrs
- 0.0%
- Est. flood insurance / yr
- $473 – $860
Fire risk 4/10 · Minor
- Est. fire insurance / yr
- $949 – $1,763
Heat risk 6/10 · Moderate
- Hot days now (above 106°F)
- 7 days/yr
- Hot days in 30 yrs
- 19 days/yr
Wind risk 2/10 · Minimal
- Chance of severe wind over 30 yrs
- 4.0%
Air-quality risk 3/10 · Minor
- Unhealthy air days now
- 2 days/yr
- Unhealthy air days in 30 yrs
- 3 days/yr
Risk factors via First Street. Map © Google.
Why this score? — see what drove the C grade
The composite is a weighted blend of 9 inputs, each scored 0–100. Each bar is that input's sub-score; the figure is the points it added to the 100-point composite (weight × sub-score).
- Cash flow +24.8/30.0
- DSCR +8.0/10.0
- ARV discount +7.5/15.0
- 1% rule +6.4/10.0
- Livability +3.1/5.0
- Rent growth +2.5/5.0
- Condition / age +2.5/5.0
- Schools +2.2/10.0
- Appreciation +0.0/10.0
$136,000
🖨 Deal sheet (PDF) 📄 Offer letter ✓ Due diligence
Listing remarks
3 bedroom 2 bath home With fireplace on permanent foundation. 12x28 cover Deck . Need some TLC. Has stove, HVAC is in good working order. Wheelchair ramp. 10x20 workshop. Partial fenced in yard. Country setting, but still close to Shopping, restaurants and hospitals. On Level a lot. Call Beth for details
Key facts
- Country setting
- Partial fenced yard
- Workshop
Tags
Neighborhood map
What this means for you Summary
Snapshot
- This is a 3-bed/2.0-bath manufactured listed at $136k.
Deal economics
- At list price, monthly cash flow is $289 ($3k/yr) — positive.
- The deal already cash-flows at list — no discount required.
- Meets the 1% rule at list price ($2k rent vs $136k).
- Recommended offer: $132k (3.0% below list) — sets the bar for market timing.
- Cap rate 8.8% vs local median 1.9% in Riceville — top-decile yield for the area; either an underpriced asset or a hidden risk that comps aren't pricing in. Stress-test before assuming the spread holds.
Location & tenants
- Location reads 62/100 on livability (#217 in TN) — a middle-class / working-renter tenant base. Strengths: cost of living A+, housing A+; Watch: health & safety C-, schools F, crime F.
- Mcminn County (rural): math 24% / reading 29% proficiency, ranked #77 of 139 in TN (top 55%) — low school quality limits family demand, transient renter base, plan for 1-2y turnover.
- Market conditions: 77 active listings in the ZIP; 45 units permitted in McMinn County in 2024 (6 in 5+ unit buildings).
Forward outlook
- Local home prices are declining (-3.0%/yr); year-one equity from $940 of loan paydown is wiped out by about $4k of value loss. Plan a longer hold.
Negotiation context
- It's been on market 40 days — a 3% lower offer ($132k) is reasonable based on typical stale-listing flexibility.
- 3 sale attempts with the ask held roughly flat each time — persistent listings suggest the price (not the market) is what's stuck; bring a comps-based counter.
- Current owner paid $82k; list at $136k implies a 66% gain — meaningful room to come down on a strong offer.
Risks & watch-outs
- Climate carrying-cost: extreme-heat days projected 7→19/yr by 2055 (HVAC capex compounding) — expect insurance premiums to compound above CPI over the hold.
Questions for the listing agent
- It's been on market 40 days. Have you received any prior offers? Is the seller open to a 3% concession, seller financing, or rate buy-down credit?
- Is there a deadline driving the sale (1031 exchange, divorce, estate, relocation)? That informs how much negotiation room exists.
- Schools are F-rated, which usually means shorter tenancies and higher turnover. Who's the typical renter profile here, and what's been the actual vacancy rate?
- Crime grade is F in this area — have there been break-ins, vandalism, or insurance claims at this property in the last 3 years? What carrier currently insures it and at what premium?
- What's the average days-on-market for RENTAL listings here right now (not sales)? A rising rental-DOM trend means longer vacancies and softer asking-rent achievability than the comps imply.
- What's the recent tenant-quality profile in this submarket — average credit score on applications, eviction rate, late-payment / NSF rate, and stable-employment percentage? A property-management company in the area should have these aggregated.
- How much new for-sale + rental construction is in the pipeline within 1–3 miles? Heavy new supply typically softens prices + rents 12–24 months out; constrained supply supports both.
Investment metrics
- 1% rule
- 1.14% ✓
- Cap rate
- 8.84%
- Cash-on-cash
- 9.10%
- DSCR
- 1.40
- GRM
- 7.3
CMA / ARV
No comps found within radius.
Projected returns pro-forma
-3.0% appreciation · 3.0% rent growth · sell at horizon
- IRR
- -2.5%
- Equity multiple
- 0.90×
- Total profit
- $-3,624
- Equity at exit
- $20,278
- IRR
- 7.2%
- Equity multiple
- 1.54×
- Total profit
- $20,621
- Equity at exit
- $11,759
Cash invested: $38,080 (down + closing). Projections, not guarantees.
Landlord ↔ Tenant lean methodology
- Overall (STATE)
- 87 Strongly Landlord-Friendly
- State Tennessee
- 87 Strongly Landlord-Friendly · R+13
- County
- — inherits STATE
- City
- — inherits STATE
ZIP-level market 37370
- Home prices YoY
- -10.3%
- Active inventory
- 77
- Price-to-rent
- 7.3×
Monthly cashflow live
- Estimated rent
- $1,555 medium interval (Pro) →
- Mortgage (P&I)
- −$713
- Tax est. 1.5%
- −$170 /mo · $2,040/yr
- Insurance
- −$57
- HOA
- −$0
- Vacancy / Maint / Mgmt
- −$327
- Net cashflow
- $289
Break-even live
Sensitivity live
| Price | -10% $383 | -5% $336 | +0% $289 | +5% $242 | +10% $195 |
|---|---|---|---|---|---|
| Rent | -10% $166 | -5% $227 | +0% $289 | +5% $350 | +10% $412 |
| Rate | -1.0pp $357 | -0.5pp $323 | base $289 | +0.5pp $254 | +1.0pp $218 |
UW: 25.0% down · 7.5% · 30yr · 1.5% tax · 5.0% vac · 8.0% maint · 8.0% mgmt
Financing live
Cash to close
- Down payment
- $34,000
- Closing costs
- $4,080
- Reserves months
- —
- Total cash needed
- —
Loan-product check · same deal, 3 products live
Conventional
25% down · 7.5% · 30yr
- Down + closing
- —
- Monthly P&I
- —
- Monthly cashflow
- —
- DSCR
- —
- Eligible?
- —
Personal DTI + credit; lowest rate.
DSCR
20% down · 8.5% · 30yr
- Down + closing
- —
- Monthly P&I
- —
- Monthly cashflow
- —
- DSCR
- —
- Eligible?
- —
No personal income docs; deal must DSCR.
Hard money
10% down · 12.0% · 12mo
- Down + closing
- —
- Monthly P&I
- —
- Monthly cashflow
- —
- DSCR
- —
- Eligible?
- —
Short-term bridge; refi at stabilization.
Listing history 24 events
-
2026-06-21days on market $136,000 Active 40 DOM
-
2026-06-19days on market $136,000 Active 38 DOM
-
2026-06-18days on market $136,000 Active 37 DOM
-
2026-06-17days on market $136,000 Active 36 DOM
-
2026-06-16days on market $136,000 Active 35 DOM
-
2026-06-15days on market $136,000 Active 34 DOM
-
2026-06-14days on market $136,000 Active 32 DOM
-
2026-06-12days on market $136,000 Active 31 DOM
-
2026-06-09days on market $136,000 Active 28 DOM
-
2026-06-08days on market $136,000 Active 27 DOM
-
2026-06-07days on market $136,000 Active 26 DOM
-
2026-06-07days on market $136,000 Active 25 DOM
-
2026-06-03days on market $136,000 Active 22 DOM
-
2026-06-02days on market $136,000 Active 21 DOM
-
2026-06-01days on market $136,000 Active 20 DOM
-
2026-05-31days on market $136,000 Active 19 DOM
-
2026-05-30days on market $136,000 Active 18 DOM
-
2026-05-12$136,000 Active 305-char remark
-
2026-03-12soldstatus $82,000
-
2026-02-24historical
-
2025-12-29historical Pending - Continue to Show
-
2025-12-29historical
-
2025-12-29$89,900
-
2025-12-29$89,900 Active
ⓘ Source: listings_history table (triggers on properties + properties_extension) + one-shot
backfill from property_details.listing_events for pre-trigger history.
Climate risk First Street
- Flood 1/10 Low FEMA zone X (unshaded) · 0% chance over 30 yrs
- Wildfire 4/10 Moderate
- Heat 6/10 Major 7 d/yr ≥106°F today · 19 d/yr by 30 yrs out
- Wind 2/10 Low 4% chance of damaging wind over 30 yrs
- Air quality 3/10 Moderate 2 unhealthy d/yr today · 3 by 30 yrs out
Nearby sold comps map
Loading sold comps map…
Walkable amenities ~0.75 mi
Loading nearby amenities…
Taxation est. · year 1
- Rental income
- $18,663
- − Mortgage interest
- −$7,618
- − Property taxes
- −$2,040
- − Insurance
- −$680
- − Repairs & maintenance
- −$1,493
- − Management
- −$1,493
- − Depreciation
- −$3,956
- Taxable income
- $1,382
- Est. tax owed @ 24.0%
- −$332
- After-tax cash flow
- $3,133/yr
For passive investors: Depreciation is non-cash, so a rental often shows a tax loss while cash-flowing — sheltering income. Rental losses are passive: they offset passive income freely, and up to $25,000/yr can offset ordinary (W-2) income if you actively participate and your MAGI is under $100k (phasing out to $0 by $150k); unused losses carry forward. On sale, claimed depreciation is recaptured at up to 25%, and gains may owe capital-gains tax (a 1031 exchange can defer both). Figures are a year-1 estimate at your 24.0% rate — not tax advice; consult a CPA.
Schools (NCES district)
- District
- Mcminn County
- NCES district ID
- 4702820
- Math proficiency
- 24% ▼ -11.00%
- Reading proficiency
- 29% ▼ -4.00%
- Median HH income
- $41,622
- Composite
- 22.49/100
- National rank
- #8099
- State rank
- #77 of 139 in TN
Livability — Riceville
- Score
- 62/100
- State rank
- #217
- US rank
- #16490
Category grades
Schools grade is shown separately in the Schools card above.
Census & demographics
- Census place
- Riceville, TN
- Population (ZIP)
- 5,244
Population outlook (McMinn County) Hauer SSP2
- Today (2025)
- 53,766 people
- By 2030
- 54,098 · +0.6%
- By 2040
- 54,450 · +1.3%
- By 2050
- 54,202 · +0.8%
- By 2075
- 55,241 · +2.7%
- By 2100
- 56,399 · +4.9%
Race, ethnicity, and origin ACS 2023
- Neighborhood character
- Predominantly White (88%)
- Race & ethnicity
- White 88% Two or more races 8% Hispanic / Latino 7% Asian 2%
- Hispanic origin (detail)
- Mexican 2% Dominican 3%
- Common ancestry
- Slovak 2% Italian 1% Serbian 1%
- Foreign-born
- 5% · Canada, China
- Languages at home
- 95% English-only · Spanish 5%
Political lean MEDSL · McMinn
- 2024 margin
- Solid R (+64.2) · D 17.5% · R 81.7%
- 2008→2024 swing
- -22.3pp toward R · 2008: -41.9pp · 2024: -64.2pp
- All cycles
- 2024: R+64.2 2020: R+60.6 2016: R+59.7 2012: R+46.9 2008: R+41.9
Not yet ingested
- Civics
- —
Market trends
- HPI YoY
- ▼ -29.19%
- Current HPI
- 253.5229
- Rent YoY
- —
- Metro
- —
- State GDP YoY
- ▲ 2.78%
- F500 in state
- 22
Industry mix (Fortune 500 HQ in TN)
| Industry | F500 HQs | Revenue |
|---|---|---|
| Healthcare | 3 | $91B |
|
||
| Retail | 3 | $72B |
|
||
| Transportation / Logistics | 1 | $88B |
|
||
| Paper / Packaging | 1 | $19B |
|
||
| Insurance | 1 | $13B |
|
||
| Energy | 1 | $12B |
|
||
Price history
+51.3% since first listed7 events — show timeline
- 2026-05-12 Listed $136,000 FSBO.com
- 2026-03-12 Sold (Public Records) $82,000 Public Records
- 2026-02-24 Listing Removed — REALTRACS as Distributed by MLS Grid
- 2025-12-29 Contingent — Knoxville MLS
- 2025-12-29 Listing Removed — Knoxville MLS
- 2025-12-29 Listed $89,900 REALTRACS as Distributed by MLS Grid
- 2025-12-29 Listed $89,900 Knoxville MLS
Property tax history
+0.1%/yrLatest (2025): $152 · +0.0% YoY. Source: county tax records.
Cash-flow waterfall
monthlySold comps — $/sqft
last 12 mo · ≤1 miLoading sold comps…