2351 Cherry Creek East Dr · Shepherd, TX
Flood risk No data
- FEMA flood zone
- —
- Chance of flooding over 30 yrs
- —
- Est. flood insurance / yr
- —
Fire risk No data
- Est. fire insurance / yr
- —
Heat risk No data
- Hot days now (above threshold)
- —
- Hot days in 30 yrs
- —
Wind risk No data
- Chance of severe wind over 30 yrs
- —
Air-quality risk No data
- Unhealthy air days now
- —
- Unhealthy air days in 30 yrs
- —
Risk factors via First Street. Map © Google.
Why this score? — see what drove the B- grade
The composite is a weighted blend of 9 inputs, each scored 0–100. Each bar is that input's sub-score; the figure is the points it added to the 100-point composite (weight × sub-score).
- Cash flow +30.0/30.0
- DSCR +10.0/10.0
- 1% rule +7.5/10.0
- ARV discount +7.5/15.0
- Appreciation +5.1/10.0
- Livability +3.0/5.0
- Rent growth +2.5/5.0
- Condition / age +2.5/5.0
- Schools +1.8/10.0
$120,000
🖨 Deal sheet 📄 Offer letter ✓ Due diligence
Listing remarks
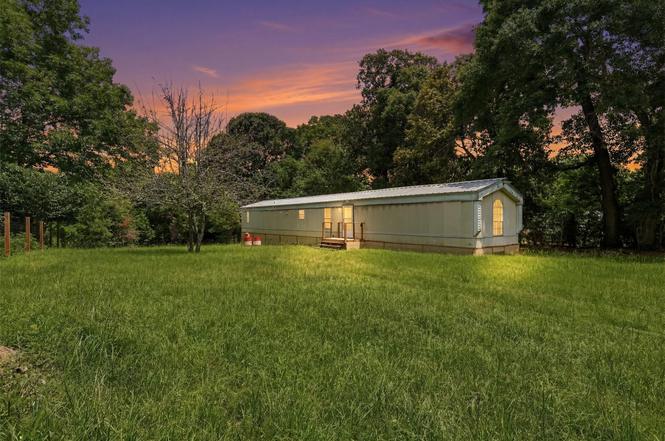
Escape to the peace and privacy of country living on 1.22 fully fenced acres in Shepherd. This 3-bedroom, 2-bath home offers 1,176 square feet of living space on a deep, wooded lot approximately 529 feet in depth, creating a private retreat with room to relax, garden, entertain, or simply enjoy nature. Features include a gated entry, metal roof, 2026 heating and cooling wall unit, new stove and refrigerator, and a spacious primary suite with an oversized soaking tub. Enjoy morning coffee on the newly built front deck or unwind on the large rear deck overlooking the peaceful yard. Connected to public water and sewer, this property offers an affordable opportunity to own acreage without sacri
Key facts
- New stove
- Metal roof
- Fully fenced acres
Tags
Property features AI
Exterior
- Parking: Paved driveway
- Security: Security gate
- Utilities: Public water; Public sewer; Power available (standard)
- Home design: Residential property; Full ownership; Single-story entry (First floor primary living areas); Facing direction not specified
- Construction: Aluminum siding; Metal roof; Pillar/post/pier foundation; Built in 2006
- Exterior features: Deck; Patio; Porch; Fully fenced yard; Back yard fencing; Paved driveway; Cleared lot; Backs to greenbelt/park
Interior
- Kitchen: Electric oven; Electric range; Refrigerator
- Bedrooms: Primary bedroom (First floor); Bedroom (First floor); Bedroom (First floor)
- Flooring: Plank; Vinyl
- Bathrooms: 2 full bathrooms; Primary bathroom (First floor)
- Heating & cooling: Wall furnace (heating)
- Interior features: Kitchen/family room combo; Kitchen/dining combo; Soaking tub; Separate shower; Tub/shower; Vanity
- Laundry & utility: Washer hookup; Electric dryer hookup; Washer; Dryer
Neighborhood map
What this means for you Summary
Snapshot
- This is a 3-bed/2.0-bath other listed at $120k.
Deal economics
- At list price, monthly cash flow is $454 ($5k/yr) — positive.
- The deal already cash-flows at list — no discount required.
- Meets the 1% rule at list price ($1k rent vs $120k).
- Cap rate 10.8% vs local median 4.4% in Shepherd — top-decile yield for the area; either an underpriced asset or a hidden risk that comps aren't pricing in. Stress-test before assuming the spread holds.
Location & tenants
- Location reads 59/100 on livability (#1,112 in TX) — a working-class tenant base; expect higher turnover. Strengths: crime A+, cost of living A+, housing A+; Watch: amenities F, commute F, employment D-.
- Shepherd ISD (rural): math 20% / reading 22% proficiency, ranked #770 of 826 in TX (top 93%) — low school quality limits family demand, transient renter base, plan for 1-2y turnover; 64% free/reduced lunch — lower-income household profile, screen leases tightly.
- Zoned schools: Shepherd Pri (499 students, 85% FRL); Shepherd Middle (math 22% / reading 24%, grade F, #1,327 of 1,662 statewide, top 81%, 458 students, 84% FRL); Shepherd H S (math 27% / reading 32%, grade F, #1,112 of 1,632 statewide, top 70%, 601 students, 77% FRL) — zoned schools average 82% FRL vs 64% district-wide (18 pts higher); higher-poverty schools than district average — tighter screening recommended.
- Market conditions: 146 active listings in the ZIP; 575 units permitted in San Jacinto County in 2024 (0 in 5+ unit buildings).
Forward outlook
- In year one you build about $1k of equity ($830 loan paydown + $198 appreciation (0.2% local appreciation)).
- San Jacinto County population projected at +7% by 2050 — modest demand growth; plan on rents tracking national, not racing it.
- At projected returns (0.2% appreciation + 3.0% rent growth), your $34k cash investment doubles in ~5 years — after that, you're playing with house money.
Negotiation context
- Only 3 days on market — expect competitive offers; lowballing is unlikely to land.
Questions for the listing agent
- Is there a deadline driving the sale (1031 exchange, divorce, estate, relocation)? That informs how much negotiation room exists.
- Schools are F-rated, which usually means shorter tenancies and higher turnover. Who's the typical renter profile here, and what's been the actual vacancy rate?
- What's the average days-on-market for RENTAL listings here right now (not sales)? A rising rental-DOM trend means longer vacancies and softer asking-rent achievability than the comps imply.
- What's the recent tenant-quality profile in this submarket — average credit score on applications, eviction rate, late-payment / NSF rate, and stable-employment percentage? A property-management company in the area should have these aggregated.
- How much new for-sale + rental construction is in the pipeline within 1–3 miles? Heavy new supply typically softens prices + rents 12–24 months out; constrained supply supports both.
Investment metrics
- 1% rule
- 1.25% ✓
- Cap rate
- 10.83%
- Cash-on-cash
- 16.22%
- DSCR
- 1.72
- GRM
- 6.7
CMA / ARV
No comps found within radius.
Projected returns pro-forma
0.17% appreciation · 3.0% rent growth · sell at horizon
- IRR
- 16.1%
- Equity multiple
- 1.78×
- Total profit
- $26,310
- Equity at exit
- $35,839
- IRR
- 20.4%
- Equity multiple
- 3.29×
- Total profit
- $76,804
- Equity at exit
- $43,882
Cash invested: $33,600 (down + closing). Projections, not guarantees.
Landlord ↔ Tenant lean methodology
- Overall (STATE)
- 87 Strongly Landlord-Friendly
- State Texas
- 87 Strongly Landlord-Friendly · R+5
- County
- — inherits STATE
- City
- — inherits STATE
ZIP-level market 77371
- Home prices YoY
- 0.1%
- Active inventory
- 146
- Price-to-rent
- 6.7×
Monthly cashflow live
- Estimated rent
- $1,498 medium interval (Pro) →
- Mortgage (P&I)
- −$629
- Tax from tax record
- −$50 /mo · $600/yr
- Insurance
- −$50
- HOA
- −$0
- Vacancy / Maint / Mgmt
- −$315
- Net cashflow
- $454
Break-even live
UW: 25.0% down · 7.5% · 30yr · 1.5% tax · 5.0% vac · 8.0% maint · 8.0% mgmt
Financing live
Cash to close
- Down payment
- $30,000
- Closing costs
- $3,600
- Reserves months
- —
- Total cash needed
- —
Loan-product check · same deal, 3 products live
Conventional
25% down · 7.5% · 30yr
- Down + closing
- —
- Monthly P&I
- —
- Monthly cashflow
- —
- DSCR
- —
- Eligible?
- —
Personal DTI + credit; lowest rate.
DSCR
20% down · 8.5% · 30yr
- Down + closing
- —
- Monthly P&I
- —
- Monthly cashflow
- —
- DSCR
- —
- Eligible?
- —
No personal income docs; deal must DSCR.
Hard money
10% down · 12.0% · 12mo
- Down + closing
- —
- Monthly P&I
- —
- Monthly cashflow
- —
- DSCR
- —
- Eligible?
- —
Short-term bridge; refi at stabilization.
Listing history 4 events
-
2026-06-18days on market $120,000 Active 3 DOM
-
2026-06-17days on market $120,000 Active 2 DOM
-
2026-06-15remarks 699-char remark
-
2026-06-15$120,000 Active 1 DOM
ⓘ Source: listings_history table (triggers on properties + properties_extension) + one-shot
backfill from property_details.listing_events for pre-trigger history.
Tax reassessment forecast TX · Resets to sale price
- Current annual tax
- $600 · $50/mo
- Projected year-2 tax
- $2,196 · $183/mo
- Expected delta
- +$1,596/yr (+$133/mo · 266.1%)
ⓘ Screening estimate from a state-policy table — verify with the county assessor before closing.
Nearby sold comps map
Loading sold comps map…
Walkable amenities ~0.75 mi
Loading nearby amenities…
Taxation est. · year 1
- Rental income
- $17,976
- − Mortgage interest
- −$6,722
- − Property taxes
- −$600
- − Insurance
- −$600
- − Repairs & maintenance
- −$1,438
- − Management
- −$1,438
- − Depreciation
- −$3,491
- Taxable income
- $3,687
- Est. tax owed @ 24.0%
- −$885
- After-tax cash flow
- $4,565/yr
For passive investors: Depreciation is non-cash, so a rental often shows a tax loss while cash-flowing — sheltering income. Rental losses are passive: they offset passive income freely, and up to $25,000/yr can offset ordinary (W-2) income if you actively participate and your MAGI is under $100k (phasing out to $0 by $150k); unused losses carry forward. On sale, claimed depreciation is recaptured at up to 25%, and gains may owe capital-gains tax (a 1031 exchange can defer both). Figures are a year-1 estimate at your 24.0% rate — not tax advice; consult a CPA.
Schools (NCES district)
- District
- Shepherd ISD
- NCES district ID
- 4840020
- Math proficiency
- 20% ▼ -8.00%
- Reading proficiency
- 22% ▼ -1.00%
- Median HH income
- $39,857
- Composite
- 17.77/100
- National rank
- #9016
- State rank
- #770 of 826 in TX
Livability — Shepherd
- Score
- 59/100
- State rank
- #1112
- US rank
- #19716
Category grades
Schools grade is shown separately in the Schools card above.
Census & demographics
- Population (ZIP)
- 7,548
Population outlook (San Jacinto County) Hauer SSP2
- Today (2025)
- 29,069 people
- By 2030
- 29,750 · +2.3%
- By 2040
- 30,714 · +5.7%
- By 2050
- 31,010 · +6.7%
- By 2075
- 31,616 · +8.8%
- By 2100
- 29,874 · +2.8%
Race, ethnicity, and origin ACS 2023
- Neighborhood character
- Diverse neighborhood (Simpson 0.56)
- Race & ethnicity
- White 61% Hispanic / Latino 26% Black 12% Two or more races 10%
- Hispanic origin (detail)
- Mexican 18% Puerto Rican 1%
- Common ancestry
- Lithuanian 3% Slovak 3% Romanian 2%
- Foreign-born
- 8% · Canada, Jamaica
- Languages at home
- 78% English-only · Spanish 22%
Political lean MEDSL · San Jacinto
- 2024 margin
- Solid R (+65.3) · D 17.0% · R 82.3%
- 2008→2024 swing
- -27.0pp toward R · 2008: -38.3pp · 2024: -65.3pp
- All cycles
- 2024: R+65.3 2020: R+61.9 2016: R+58.4 2012: R+48.9 2008: R+38.3
Not yet ingested
- Civics
- —
Market trends
- HPI YoY
- ▲ 0.17%
- Current HPI
- 201.6618
- Rent YoY
- —
- Metro
- —
- State GDP YoY
- ▲ 3.95%
- F500 in state
- 110
Industry mix (Fortune 500 HQ in TX)
| Industry | F500 HQs | Revenue |
|---|---|---|
| Energy | 16 | $1,198B |
|
||
| Technology | 5 | $198B |
|
||
| Engineering / Construction | 4 | $72B |
|
||
| Energy Services | 3 | $60B |
|
||
| Utilities | 3 | $41B |
|
||
| Healthcare | 2 | $330B |
|
||
Price history
2 events — show timeline
- 2026-06-15 Listed $120,000 HARMLS
- 2024-11-06 Sold (Public Records) — Public Records
Property tax history
+19.1%/yrLatest (2025): $600 · +19.1% YoY. Source: county tax records.
Cash-flow waterfall
monthlySold comps — $/sqft
last 12 mo · ≤1 miLoading sold comps…