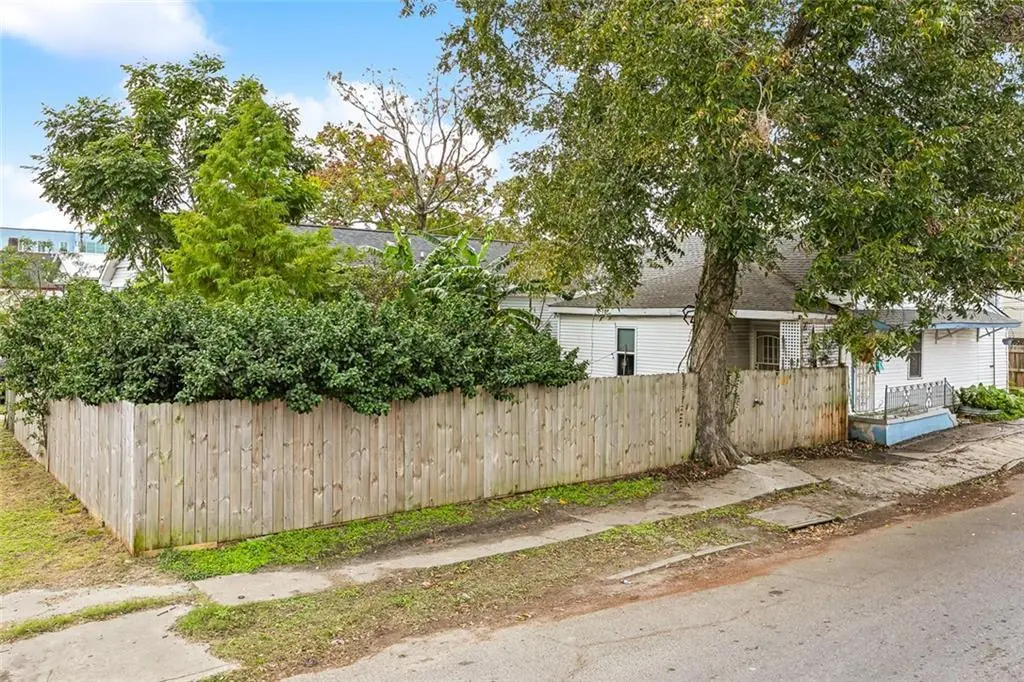
2230 N Roman St · New Orleans, LA
Flood risk 8/10 · Major
- FEMA flood zone
- X (shaded)
- Chance of flooding over 30 yrs
- 0.6%
- Est. flood insurance / yr
- $507 – $1,088
Fire risk 1/10 · Minimal
- Est. fire insurance / yr
- $1,269 – $2,357
Heat risk 10/10 · Severe
- Hot days now (above 108°F)
- 7 days/yr
- Hot days in 30 yrs
- 21 days/yr
Wind risk 10/10 · Severe
- Chance of severe wind over 30 yrs
- 99.0%
Air-quality risk 4/10 · Minor
- Unhealthy air days now
- 4 days/yr
- Unhealthy air days in 30 yrs
- 4 days/yr
Risk factors via First Street. Map © Google.
Why this score? — see what drove the C- grade
The composite is a weighted blend of 9 inputs, each scored 0–100. Each bar is that input's sub-score; the figure is the points it added to the 100-point composite (weight × sub-score).
- Cash flow +17.2/30.0
- ARV discount +15.0/15.0
- DSCR +5.4/10.0
- 1% rule +4.0/10.0
- Livability +4.0/5.0
- Rent growth +3.1/5.0
- Condition / age +2.5/5.0
- Schools +1.6/10.0
- Appreciation +0.0/10.0
$159,500
🖨 Deal sheet (PDF) 📄 Offer letter ✓ Due diligence
Listing remarks MLS
**Corner Property with Parking & 2023 Roof!** Welcome to 2230 N. Roman Street, a charming single-family home on an extra-large 100' x 30' corner lot in the heart of New Orleans. Featuring a new roof (2023) and new pilings (2018), this property offers peace of mind along with classic New Orleans living. Property Highlights: Two full bedrooms & one full bath, Convenient driveway parking on a corner lot, Private courtyard for outdoor living, Washer/dryer hookups for added functionality, Well-maintained and move-in ready. With its combination of updates, space and location, this home is an excellent opportunity to own a solid property in a growing neighborhood. **Property currently leased, Please allow Notice to Show** Make Every Move Wurth It!
Key facts
- New pilings
- Washer dryer hookups
- Move in ready
Tags
Neighborhood map
What this means for you Summary
Snapshot
- This is a 1-bed/1.0-bath single-family listed at $160k.
Deal economics
- At list price, monthly cash flow is $49 ($584/yr) — positive.
- The deal already cash-flows at list — no discount required.
- To meet the 1% rule (rent ≥ 1% of price), the offer needs to be $144k (10.0% below list).
- Recommended offer: $144k (10.0% below list) — sets the bar for 1% rule.
- Cap rate 7.2% vs local median 4.3% in New Orleans — top-decile yield for the area; either an underpriced asset or a hidden risk that comps aren't pricing in. Stress-test before assuming the spread holds.
Location & tenants
- Location reads 81/100 on livability (#3 in LA, #1,383 nationally) — a professional / high-income tenant draw. Strengths: amenities A+, commute A+, health & safety A+; Watch: crime C-, employment D.
- Orleans Parish (urban): math 11% / reading 27% proficiency, ranked #69 of 98 in LA (top 70%) — low school quality limits family demand, transient renter base, plan for 1-2y turnover; 68% free/reduced lunch — lower-income household profile, screen leases tightly.
- Zoned schools: Benjamin Franklin Elem. Math And Science (math 12% / reading 23%, grade F, #479 of 646 statewide, top 75%, 747 students, 98% FRL, charter) — zoned schools average 98% FRL vs 68% district-wide (30 pts higher); higher-poverty schools than district average — tighter screening recommended.
- Market conditions: Rents rising (+2.5%/yr); 588 active listings in the ZIP; 40 comparable units currently listed for rent nearby; rentals at typical pace (median 26d on market — plan ~3-4 weeks tenant-placement turnaround); 710 units permitted in Orleans Parish in 2024 (244 in 5+ unit buildings).
- This rent runs 38% of the median local income ($46k/yr) — at the standard rent-burdened threshold; future hikes will face affordability resistance.
Forward outlook
- Local home prices are declining (-3.0%/yr); year-one equity from $1k of loan paydown is wiped out by about $5k of value loss. Plan a longer hold.
- Orleans County population projected at +61% by 2050 — long-run rental-demand tailwind backs the buy-and-hold thesis.
Negotiation context
- It's been on market 118 days — a 9% lower offer ($145k) is reasonable based on typical stale-listing flexibility.
- 11 sale attempts since 8y ago with the ask held roughly flat each time — persistent listings suggest the price (not the market) is what's stuck; bring a comps-based counter.
- Current owner paid $85k; list at $160k implies a 88% gain — meaningful room to come down on a strong offer.
Risks & watch-outs
- Watch-outs: flood insurance adds $66/mo; built in 1950 — expect roof / HVAC / electrical / plumbing capex.
- Climate carrying-cost: severe flood risk; severe wind risk, 99% chance of damaging wind over 30y; extreme-heat days projected 7→21/yr by 2055 (HVAC capex compounding) — expect insurance premiums to compound above CPI over the hold.
Questions for the listing agent
- It's been on market 118 days. Have you received any prior offers? Is the seller open to a 10% concession, seller financing, or rate buy-down credit?
- Built in 1950 — when were the roof, HVAC, electrical panel, plumbing, and water heater last replaced?
- What's the actual annual flood-insurance premium (NFIP or private), and is the property in a SFHA with mandatory coverage?
- Why hasn't it sold? Are there any deal-killer items the seller is aware of (foundation, flood, title, zoning, code violations)?
- Is there a deadline driving the sale (1031 exchange, divorce, estate, relocation)? That informs how much negotiation room exists.
- What's the average days-on-market for RENTAL listings here right now (not sales)? A rising rental-DOM trend means longer vacancies and softer asking-rent achievability than the comps imply.
- What's the recent tenant-quality profile in this submarket — average credit score on applications, eviction rate, late-payment / NSF rate, and stable-employment percentage? A property-management company in the area should have these aggregated.
- How much new for-sale + rental construction is in the pipeline within 1–3 miles? Heavy new supply typically softens prices + rents 12–24 months out; constrained supply supports both.
Investment metrics
- 1% rule
- 0.90% ✗
- Cap rate
- 7.16%
- Cash-on-cash
- 3.09%
- DSCR
- 1.14
- GRM
- 9.3
CMA / ARV
- ARV (median comp)
- $197,881
- List price
- $159,500
- Delta
- -19.40%
- Verdict
- UNDERPRICED
- Comps
- 20 within 1.0 mi
Show comp detail 12 sales within ~0.75 mi
| Address | Dist | Beds/Ba | Sqft | Sold | Price | $/sf | Match |
|---|---|---|---|---|---|---|---|
| 1313 Marigny St | 0.32mi | 2/1.0 (+1) | 1,000 (-2%) | 14mo | $90,000 | $90 | 66 |
| 2037 Saint Anthony St | 0.39mi | 2/1.0 (+1) | 960 (-5%) | 4mo | $126,000 | $131 | 64 |
| 2308 Burgundy St | 0.64mi | 1/1.0 | 1,042 (+3%) | 8mo | $242,000 | $232 | 59 |
| 2623 N Villere | 0.53mi | 2/1.0 (+1) | 1,078 (+6%) | 6mo | $95,000 | $88 | 55 |
| 1821 Urquhart St | 0.46mi | 2/1.0 (+1) | 1,105 (+9%) | 9mo | $285,000 | $258 | 52 |
| 1329 Music St | 0.42mi | 2/1.0 (+1) | 1,100 (+8%) | 14mo | $70,000 | $64 | 50 |
| 1207 Marigny St | 0.40mi | 2/1.0 (+1) | 1,154 (+14%) | 14mo | $280,000 | $243 | 42 |
| 2423 Arts St | 0.60mi | 2/1.0 (+1) | 896 (-12%) | 13mo | $95,000 | $106 | 37 |
| 2719 N Roman St | 0.59mi | 2/1.0 (+1) | 898 (-12%) | 21mo | $110,210 | $123 | 31 |
| 1548 N Roman St | 0.72mi | 2/2.0 (+1) | 940 (-7%) | 21mo | $225,000 | $239 | 28 |
| 2116 New Orleans St | 0.62mi | 2/2.0 (+1) | 1,156 (+14%) | 15mo | $90,000 | $78 | 26 |
| 912 Frenchmen St | 0.62mi | 2/1.5 (+1) | 1,166 (+15%) | 23mo | $350,000 | $300 | 20 |
Match score weights: distance 35% · size 25% · config 20% · recency 20%. Top-matched comps best support the ARV.
Projected returns pro-forma
-3.0% appreciation · 2.49% rent growth · sell at horizon
- IRR
- -14.8%
- Equity multiple
- 0.47×
- Total profit
- $-23,468
- Equity at exit
- $23,782
- IRR
- -7.0%
- Equity multiple
- 0.57×
- Total profit
- $-19,376
- Equity at exit
- $13,791
Cash invested: $44,660 (down + closing). Projections, not guarantees.
Landlord ↔ Tenant lean methodology
- Overall (STATE)
- 90 Strongly Landlord-Friendly
- State Louisiana
- 90 Strongly Landlord-Friendly · R+12
- County
- — inherits STATE
- City
- — inherits STATE
ZIP-level market 70117
- Rents YoY
- 2.5%
- Active inventory
- 588
- Price-to-rent
- 9.3×
Monthly cashflow live
- Estimated rent
- $1,436 high interval (Pro) →
- Mortgage (P&I)
- −$836
- Tax from tax record
- −$116 /mo · $1,394/yr
- Insurance
- −$66
- Flood insurance flood zone
- −$66 /mo · $798/yr
- HOA
- −$0
- Lot rent
- −$0
- Vacancy / Maint / Mgmt
- −$301
- Net cashflow
- $49
Break-even live
Sensitivity live
| Price | -10% $139 | -5% $94 | +0% $49 | +5% $4 | +10% $-42 |
|---|---|---|---|---|---|
| Rent | -10% $-65 | -5% $-8 | +0% $49 | +5% $105 | +10% $162 |
| Rate | -1.0pp $129 | -0.5pp $89 | base $49 | +0.5pp $7 | +1.0pp $-35 |
UW: 25.0% down · 7.5% · 30yr · 1.5% tax · 5.0% vac · 8.0% maint · 8.0% mgmt
Financing live
Cash to close
- Down payment
- $39,875
- Closing costs
- $4,785
- Reserves months
- —
- Total cash needed
- —
Loan-product check · same deal, 3 products live
Conventional
25% down · 7.5% · 30yr
- Down + closing
- —
- Monthly P&I
- —
- Monthly cashflow
- —
- DSCR
- —
- Eligible?
- —
Personal DTI + credit; lowest rate.
DSCR
20% down · 8.5% · 30yr
- Down + closing
- —
- Monthly P&I
- —
- Monthly cashflow
- —
- DSCR
- —
- Eligible?
- —
No personal income docs; deal must DSCR.
Hard money
10% down · 12.0% · 12mo
- Down + closing
- —
- Monthly P&I
- —
- Monthly cashflow
- —
- DSCR
- —
- Eligible?
- —
Short-term bridge; refi at stabilization.
Rent comps 40 comps
| Address | Beds | Baths | Sqft | Rent | $/sqft | DOM | Units | Dist |
|---|---|---|---|---|---|---|---|---|
| 1726 Mandeville St New Orleans, LA | 2.0 | 1.0 | 920 | $1,300 | $1.41 | 26d | 1 | 0.06mi |
| 2269 N Prieur St New Orleans, LA | 2.0 | 1.0 | 756 | $1,250 | $1.65 | 26d | 1 | 0.08mi |
| 2269 N Derbigny St New Orleans, LA | 2.0 | 2.0 | 1000 | $1,665 | $1.67 | 19d | 1 | 0.08mi |
| 2269 N Derbigny St New Orleans, LA | 2.0 | 2.0 | 1000 | $1,675 | $1.68 | 21d | 1 | 0.08mi |
| 2271 N Derbigny St New Orleans, LA | 2.0 | 2.0 | 1000 | $1,585 | $1.58 | 19d | 1 | 0.09mi |
| 2024 Mandeville St New Orleans, LA | 2.0 | 2.0 | 1072 | $1,950 | $1.82 | 26d | 1 | 0.17mi |
| 2123 Marigny St New Orleans, LA | 1.0 | 1.0 | 700 | $1,000 | $1.43 | 5d | 1 | 0.23mi |
| 1810 Touro St New Orleans, LA | 2.0 | 1.0 | 700 | $1,140 | $1.63 | 26d | 1 | 0.25mi |
| 1638 Music St New Orleans, LA | 2.0 | 1.0 | 900 | $1,085 | $1.21 | 17d | 1 | 0.27mi |
| 2129 Spain St New Orleans, LA | 2.0 | 1.0 | 861 | $1,500 | $1.74 | 26d | 1 | 0.28mi |
| 2120 Saint Roch Ave Unit 2120 New Orleans, LA | 2.0 | 1.0 | 1000 | $1,650 | $1.65 | 26d | 1 | 0.29mi |
| 2134 Saint Roch Ave New Orleans, LA | 2.0 | 2.0 | 850 | $1,500 | $1.76 | 19d | 1 | 0.31mi |
| 1327 Frenchmen St Unit B New Orleans, LA | 2.0 | 2.5 | 1175 | $1,900 | $1.62 | 26d | 1 | 0.36mi |
| 2516 N Roman St Unit 2518 New Orleans, LA | 2.0 | 1.0 | 800 | $1,500 | $1.88 | 5d | 1 | 0.37mi |
| 2229 Saint Roch Ave New Orleans, LA | 2.0 | 1.5 | 1200 | $1,600 | $1.33 | 22d | 1 | 0.38mi |
| 2103 Urquhart St New Orleans, LA | 2.0 | 1.0 | 940 | $1,299 | $1.38 | 26d | 1 | 0.39mi |
| 1301 Frenchmen St Unit 2B New Orleans, LA | 2.0 | 1.0 | 940 | $1,299 | $1.38 | 26d | 1 | 0.39mi |
| 1239 Saint Roch Ave New Orleans, LA | 2.0 | 2.0 | 1500 | $2,150 | $1.43 | 5d | 1 | 0.44mi |
| 2406 Saint Roch Ave New Orleans, LA | 2.0 | 1.0 | 1000 | $1,600 | $1.60 | 19d | 1 | 0.46mi |
| 2104 Marais St Unit 2106 New Orleans, LA | 2.0 | 2.0 | 936 | $2,000 | $2.14 | 26d | 1 | 0.48mi |
| 1136 Frenchmen St New Orleans, LA | 2.0 | 1.0 | 1000 | $1,550 | $1.55 | 5d | 1 | 0.48mi |
| 1136 Frenchmen St New Orleans, LA | 2.0 | 1.0 | 1000 | $1,550 | $1.55 | 5d | 1 | 0.48mi |
| 2239 Saint Anthony St New Orleans, LA | 2.0 | 1.0 | 900 | $1,100 | $1.22 | 26d | 1 | 0.49mi |
| 1134 Frenchmen St New Orleans, LA | 2.0 | 1.0 | 900 | $1,550 | $1.72 | 5d | 1 | 0.49mi |
| 1134 Frenchmen St New Orleans, LA | 2.0 | 1.0 | 900 | $1,550 | $1.72 | 5d | 1 | 0.49mi |
| 2423 Saint Roch Ave New Orleans, LA | 2.0 | 1.0 | 925 | $1,350 | $1.46 | 26d | 1 | 0.49mi |
| 2311 Saint Anthony St Unit 1A New Orleans, LA | 2.0 | 1.0 | 1100 | $1,450 | $1.32 | 26d | 1 | 0.49mi |
| 2311 Saint Anthony St Unit 1B New Orleans, LA | 2.0 | 1.0 | 750 | $1,350 | $1.80 | 26d | 1 | 0.49mi |
| 2551 N Tonti St New Orleans, LA | 2.0 | 2.0 | 800 | $1,450 | $1.81 | 26d | 1 | 0.50mi |
| 2238 Painters St New Orleans, LA | 2.0 | 1.0 | 896 | $1,300 | $1.45 | 26d | 1 | 0.51mi |
| 2512 Elysian Fields Ave Unit C New Orleans, LA | 2.0 | 1.0 | 800 | $1,300 | $1.62 | 5d | 1 | 0.51mi |
| 2512 Elysian Fields Ave Unit 1 New Orleans, LA | 2.0 | 1.0 | 879 | $1,400 | $1.59 | 19d | 1 | 0.51mi |
| 2512 Elysian Fields Ave Unit C New Orleans, LA | 2.0 | 1.0 | 800 | $1,300 | $1.62 | 5d | 1 | 0.51mi |
| 1909 Pauger St New Orleans, LA | 2.0 | 1.0 | 868 | $1,300 | $1.50 | 26d | 1 | 0.51mi |
| 3110 Pauger St New Orleans, LA | 2.0 | 2.0 | 992 | $1,300 | $1.31 | 26d | 1 | 0.53mi |
| 1730 Allen St New Orleans, LA | 2.0 | 1.0 | 920 | $1,650 | $1.79 | 26d | 1 | 0.53mi |
| 2649 N Rocheblave St New Orleans, LA | 2.0 | 2.0 | 806 | $1,200 | $1.49 | 26d | 1 | 0.53mi |
| 2625 Urquhart St New Orleans, LA | 2.0 | 1.0 | 810 | $1,100 | $1.36 | 19d | 1 | 0.55mi |
| 1811 New Orleans St New Orleans, LA | 2.0 | 2.0 | 900 | $1,700 | $1.89 | 5d | 1 | 0.56mi |
| 2434 Saint Anthony St New Orleans, LA | 2.0 | 1.0 | 768 | $1,300 | $1.69 | 17d | 1 | 0.59mi |
Listing history 38 events
-
2026-06-22days on market $159,500 Active 118 DOM
-
2026-06-21days on market $159,500 Active 117 DOM
-
2026-06-18days on market $159,500 Active 114 DOM
-
2026-06-17days on market $159,500 Active 113 DOM
-
2026-06-16days on market $159,500 Active 112 DOM
-
2026-06-15days on market $159,500 Active 111 DOM
-
2026-06-13days on market $159,500 Active 109 DOM
-
2026-06-10days on market $159,500 Active 106 DOM
-
2026-06-09days on market $159,500 Active 105 DOM
-
2026-06-08days on market $159,500 Active 104 DOM
-
2026-06-07days on market $159,500 Active 103 DOM
-
2026-06-05days on market $159,500 Active 100 DOM
-
2026-06-03days on market $159,500 Active 99 DOM
-
2026-06-02days on market $159,500 Active 98 DOM
-
2026-06-01days on market $159,500 Active 97 DOM
-
2026-05-31days on market $159,500 Active 96 DOM
-
2026-02-24$159,500 Active 758-char remark
Show marketing remark (777 chars)
* * Corner Property with Parking & 2023 Roof! * * Welcome to 2230 N. Roman Street, a charming single-family home on an extra-large 100' x 30' corner lot in the heart of New Orleans. Featuring a new roof (2023) and new pilings (2018), this property offers peace of mind along with classic New Orleans living. Property Highlights: Two full bedrooms & one full bath, Convenient driveway parking on a corner lot, Private courtyard for outdoor living, Washer/dryer hookups for added functionality, Well-maintained and move-in ready. With its combination of updates, space and location, this home is an excellent opportunity to own a solid property in a growing neighborhood. * * Property currently leased, Please allow Notice to Show * * Make Every Move Wurth It!
-
2026-02-24$159,500 Active 777-char remark
Show marketing remark (777 chars)
* * Corner Property with Parking & 2023 Roof! * * Welcome to 2230 N. Roman Street, a charming single-family home on an extra-large 100' x 30' corner lot in the heart of New Orleans. Featuring a new roof (2023) and new pilings (2018), this property offers peace of mind along with classic New Orleans living. Property Highlights: Two full bedrooms & one full bath, Convenient driveway parking on a corner lot, Private courtyard for outdoor living, Washer/dryer hookups for added functionality, Well-maintained and move-in ready. With its combination of updates, space and location, this home is an excellent opportunity to own a solid property in a growing neighborhood. * * Property currently leased, Please allow Notice to Show * * Make Every Move Wurth It!
-
2025-09-02historical $1,350
-
2025-07-11$1,350
-
2025-07-10$159,500 Active
-
2025-07-05historical $1,350
-
2025-06-26$1,350
-
2025-06-13historical $1,350
-
2025-06-06$159,500 Active
-
2025-05-28$1,350
-
2025-01-28price $159,500
-
2025-01-28price $159,500
-
2024-12-05$175,500 Active
-
2018-09-07soldstatus $85,000
-
2018-09-06soldstatus $85,000 Sold
-
2018-08-27status Under Contract
-
2018-07-20price $95,000
-
2018-06-08status Active
-
2018-05-13historical Pending Continue to Show
-
2018-04-18$120,000 Active
-
2018-04-18$95,000
-
2007-03-30soldstatus $40,000
ⓘ Source: listings_history table (triggers on properties + properties_extension) + one-shot
backfill from property_details.listing_events for pre-trigger history.
Tax reassessment forecast LA · Resets to sale price
- Current annual tax
- $1,394 · $116/mo
- Projected year-2 tax
- $1,394 · $116/mo
- Expected delta
- $0/yr ($0/mo · 0.0%)
ⓘ Screening estimate from a state-policy table — verify with the county assessor before closing.
Climate risk First Street
- Flood 8/10 Severe FEMA zone X (shaded) · 60% chance over 30 yrs
- Wildfire 1/10 Low
- Heat 10/10 Extreme 7 d/yr ≥108°F today · 21 d/yr by 30 yrs out
- Wind 10/10 Extreme 99% chance of damaging wind over 30 yrs
- Air quality 4/10 Moderate 4 unhealthy d/yr today · 4 by 30 yrs out
Nearby sold comps map
Loading sold comps map…
Walkable amenities ~0.75 mi
Loading nearby amenities…
Taxation est. · year 1
- Rental income
- $17,227
- − Mortgage interest
- −$8,934
- − Property taxes
- −$1,394
- − Insurance
- −$1,595
- − Repairs & maintenance
- −$1,378
- − Management
- −$1,378
- − Depreciation
- −$4,640
- Taxable loss
- −$2,092
- Est. tax savings @ 24.0%
- +$502
- After-tax cash flow
- $1,086/yr
For passive investors: Depreciation is non-cash, so a rental often shows a tax loss while cash-flowing — sheltering income. Rental losses are passive: they offset passive income freely, and up to $25,000/yr can offset ordinary (W-2) income if you actively participate and your MAGI is under $100k (phasing out to $0 by $150k); unused losses carry forward. On sale, claimed depreciation is recaptured at up to 25%, and gains may owe capital-gains tax (a 1031 exchange can defer both). Figures are a year-1 estimate at your 24.0% rate — not tax advice; consult a CPA.
Schools (NCES district)
- District
- Orleans Parish
- NCES district ID
- 2201170
- Math proficiency
- 11% ▼ -52.00%
- Reading proficiency
- 27% ▼ -46.00%
- Median HH income
- $37,011
- Composite
- 15.78/100
- National rank
- #9271
- State rank
- #69 of 98 in LA
Livability — New Orleans
- Score
- 81/100
- State rank
- #3
- US rank
- #1383
Category grades
Schools grade is shown separately in the Schools card above.
Census & demographics
- Census place
- New Orleans, LA
- County
- Orleans Parish · 338,817 people
- City population
- 338,817
- Metro
- New Orleans-Metairie, LA
- Population (ZIP)
- 25,652
- Household income
- $45,764
- Rent vs Own
- Severe rent burden
- 1988.0
Population outlook (Orleans County) Hauer SSP2
- Today (2025)
- 513,025 people
- By 2030
- 575,781 · +12.2%
- By 2040
- 700,174 · +36.5%
- By 2050
- 826,541 · +61.1%
- By 2075
- 1,123,374 · +119.0%
- By 2100
- 1,355,609 · +164.2%
Race, ethnicity, and origin ACS 2023
- Neighborhood character
- Majority Black (60%)
- Race & ethnicity
- Black 60% White 30% Two or more races 6% Hispanic / Latino 5%
- Common ancestry
- Lithuanian 5% Italian 1% Romanian 1%
- Foreign-born
- 5% · Canada, South Korea
- Languages at home
- 93% English-only · Spanish 3% Other Indo-European 1% French/Haitian/Cajun 1%
Political lean MEDSL · Orleans
- 2024 margin
- Solid D (+67.0) · D 82.2% · R 15.2% · Other 2.7%
- 2008→2024 swing
- +6.7pp toward D · 2008: 60.3pp · 2024: 67.0pp
- All cycles
- 2024: D+67.0 2020: D+68.2 2016: D+66.2 2012: D+62.5 2008: D+60.3
Not yet ingested
- Civics
- —
Market trends
- HPI YoY
- ▼ -177.22%
- Current HPI
- 184.6061
- Rent YoY
- ▲ 2.49%
- Metro
- New Orleans-Metairie, LA
- State GDP YoY
- ▲ 3.29%
- F500 in state
- 10
Industry mix (Fortune 500 HQ in LA)
| Industry | F500 HQs | Revenue |
|---|---|---|
| Telecommunications | 2 | $23B |
|
||
| Utilities | 1 | $12B |
|
||
| Wholesale / Distribution | 1 | $5B |
|
||
| Advertising | 1 | $2B |
|
||
Price history
+298.8% since first listed22 events — show timeline
- 2026-02-24 Listed $159,500 GSREIN
- 2026-02-24 Listed $159,500 AcadianaMLS
- 2025-09-02 Rental Removed $1,350 GSREIN
- 2025-07-11 Listed for Rent $1,350 GSREIN
- 2025-07-10 Listed $159,500 AcadianaMLS
- 2025-07-05 Rental Removed $1,350 GSREIN
- 2025-06-26 Listed for Rent $1,350 GSREIN
- 2025-06-13 Rental Removed $1,350 GSREIN
- 2025-06-06 Listed $159,500 AcadianaMLS
- 2025-05-28 Listed for Rent $1,350 GSREIN
- 2025-01-28 Price Changed $159,500 AcadianaMLS
- 2025-01-28 Price Changed $159,500 GSREIN
- 2024-12-05 Listed $175,500 AcadianaMLS
- 2018-09-07 Sold (Public Records) $85,000 Public Records
- 2018-09-06 Sold (MLS) $85,000 GSREIN
- 2018-08-27 Pending — GSREIN
- 2018-07-20 Price Changed $95,000 GSREIN
- 2018-06-08 Relisted — GSREIN
- 2018-05-13 Contingent — GSREIN
- 2018-04-18 Listed $95,000 AcadianaMLS
- 2018-04-18 Listed $120,000 GSREIN
- 2007-03-30 Sold (Public Records) $40,000 Public Records
Property tax history
+4.1%/yrLatest (2026): $1,394 · +1.1% YoY. Source: county tax records.
Cash-flow waterfall
monthlySold comps — $/sqft
last 12 mo · ≤1 miLoading sold comps…