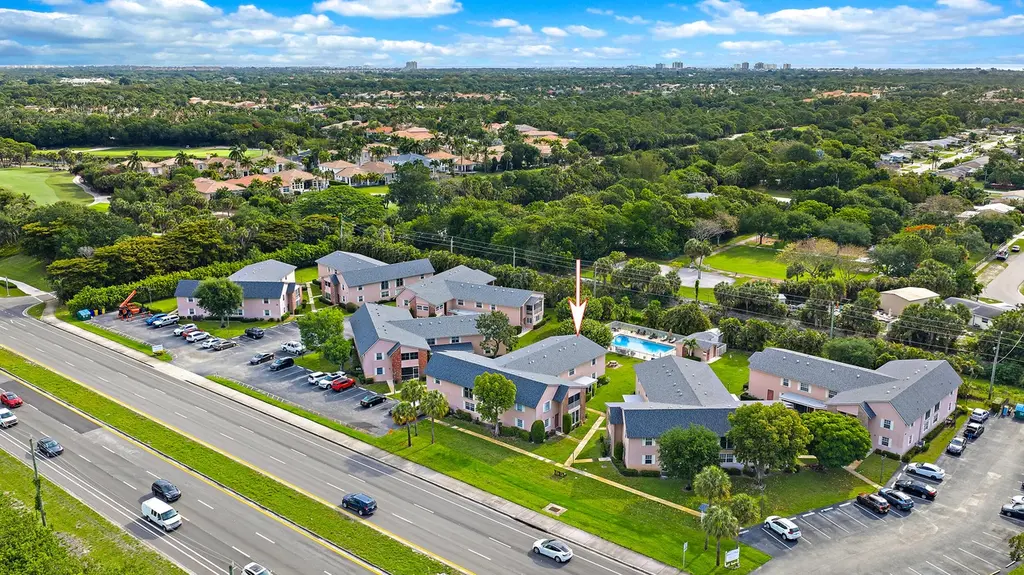
12386 Alternate A1a Unit N7 · Cabana Colony, FL
Flood risk 1/10 · Minimal
- FEMA flood zone
- X (unshaded)
- Chance of flooding over 30 yrs
- 0.0%
- Est. flood insurance / yr
- $507 – $1,088
Fire risk 1/10 · Minimal
- Est. fire insurance / yr
- $947 – $1,759
Heat risk 10/10 · Severe
- Hot days now (above 106°F)
- 7 days/yr
- Hot days in 30 yrs
- 25 days/yr
Wind risk 10/10 · Severe
- Chance of severe wind over 30 yrs
- 99.0%
Air-quality risk 2/10 · Minimal
- Unhealthy air days now
- 1 days/yr
- Unhealthy air days in 30 yrs
- 2 days/yr
Risk factors via First Street. Map © Google.
Why this score? — see what drove the D grade
The composite is a weighted blend of 9 inputs, each scored 0–100. Each bar is that input's sub-score; the figure is the points it added to the 100-point composite (weight × sub-score).
- Cash flow +11.0/30.0
- ARV discount +7.5/15.0
- 1% rule +7.3/10.0
- Schools +4.3/10.0
- Livability +3.6/5.0
- DSCR +3.2/10.0
- Rent growth +3.1/5.0
- Condition / age +2.5/5.0
- Appreciation +0.0/10.0
$180,000
🖨 Deal sheet (PDF) 📄 Offer letter ✓ Due diligence
Listing remarks
Great Deal, Professional Appraisal for $190,000. Fully renovated ground-floor condo overlooking the pool in a park-like setting with picnic areas, barbecue spaces, and open green lawns. One large bedroom, large oversized living room, total sq ft 1298, prime location just minutes to beaches, top restaurants, golf, and shopping including Trader Joe's, Whole Foods Market, Publix, and The Gardens Mall. Located in a low-rise building with only one unit above, this home features a new electrical panel, stainless steel appliances, recessed lighting, shaker cabinets, quartz countertops, a custom tile shower, new water heater, new A/C, Enjoy a heated community pool and an ideal Palm Beach Gardens l
Key facts
- Barbecue spaces
- Overlooking the pool
- Park-like setting
Tags
Property features AI
Finance
- HOA & community: HOA with monthly fee of $628; HOA covers cable TV, common areas, and pool service
Exterior
- Parking: 2 parking spaces; Common area parking; Concrete parking; Guest parking
- Utilities: Public water; Public sewer; Cable available; Water connected
- Home design: Condominium; One story; Faces east; Resale condition; Building name: Gardenway
- Construction: Built with CBS (concrete block); Concrete block (no stucco) construction; 1,298 total building area (owner reported)
- Exterior features: Shingle roof; Not waterfront
Interior
- Kitchen: Dishwasher; Refrigerator; Electric cooktop; Freezer
- Bedrooms: 1 bedroom on the main level
- Flooring: Laminate flooring
- Bathrooms: 1 full bathroom
- Heating & cooling: Central heating; Central air conditioning
- Interior features: Built-in features; Closet cabinetry
Neighborhood map
What this means for you Summary
Snapshot
- This is a 1-bed/1.0-bath condo listed at $180k.
Deal economics
- At list price, monthly cash flow is $-77 ($-921/yr) — negative.
- To cash-flow at today's rent, offer at most $166k (7.5% below list).
- Meets the 1% rule at list price ($2k rent vs $180k).
- Recommended offer: $166k (7.5% below list) — sets the bar for cash-flow.
Location & tenants
- Location reads 72/100 on livability (#346 in FL) — a middle-class / working-renter tenant base. Strengths: crime A+, housing A+, employment A-; Watch: amenities F, commute F, health & safety D-.
- Palm Beach (suburban): math 46% / reading 53% proficiency, ranked #34 of 73 in FL (top 47%) — families likely to look elsewhere, expect single-tenant / working-renter base with shorter leases.
- Zoned schools: Dwight D. Eisenhower Elementary School (math 52% / reading 52%, grade C-, #990 of 2,144 statewide, top 48%, 432 students, 56% FRL); Howell L. Watkins Middle School (math 18% / reading 33%, grade F, #512 of 571 statewide, top 90%, 794 students, 76% FRL); William T. Dwyer High School (math 36% / reading 58%, grade D-, #207 of 667 statewide, top 32%, 2,206 students, 37% FRL) — zoned schools at 57% FRL track the district average.
- Market conditions: Rents rising (+2.5%/yr); 309 active listings in the ZIP; 4 comparable units currently listed for rent nearby; rentals leasing fast (median 2d on market — plan ~1-2 weeks tenant-placement turnaround); solid renter incomes; 3,974 units permitted in Palm Beach County in 2024 (1,012 in 5+ unit buildings).
Forward outlook
- Local home prices are declining (-3.0%/yr); year-one equity from $1k of loan paydown is wiped out by about $5k of value loss. Plan a longer hold.
- Palm Beach County population projected at +30% by 2050 — long-run rental-demand tailwind backs the buy-and-hold thesis.
Negotiation context
- It's been on market 55 days — a 3% lower offer ($175k) is reasonable based on typical stale-listing flexibility.
- 4 sale attempts since 23y ago; this cycle's ask has dropped $19k (10%) from the opening price — seller is motivated, your offer sets the floor, not the list.
- Current owner paid $84k; list at $180k implies a 114% gain — meaningful room to come down on a strong offer.
Risks & watch-outs
- Watch-outs: HOA is 28% of rent.
- Climate carrying-cost: severe wind risk, 99% chance of damaging wind over 30y; extreme-heat days projected 7→25/yr by 2055 (HVAC capex compounding) — expect insurance premiums to compound above CPI over the hold.
Questions for the listing agent
- What do current leases actually rent for vs. the listed asking? Can we see a recent rent roll and the last 12 months of T-12 income?
- It's been on market 55 days. Have you received any prior offers? Is the seller open to a 8% concession, seller financing, or rate buy-down credit?
- Built in 1978 — when were the roof, HVAC, electrical panel, plumbing, and water heater last replaced?
- What does the HOA fee cover, when was the last increase, and are there any pending special assessments or reserve-fund shortfalls?
- Any open or pending special assessments — roof, HVAC, plumbing, elevator, façade? What's the per-unit balance and payoff schedule, and is the seller paying it off at close or rolling it to the buyer?
- Is there a deadline driving the sale (1031 exchange, divorce, estate, relocation)? That informs how much negotiation room exists.
- Schools are D-rated, which usually means shorter tenancies and higher turnover. Who's the typical renter profile here, and what's been the actual vacancy rate?
- The area grade is low — what's the realistic commute time and amenity access for the typical tenant pool here? Any planned neighborhood developments (good or bad) we should know about?
- What's the average days-on-market for RENTAL listings here right now (not sales)? A rising rental-DOM trend means longer vacancies and softer asking-rent achievability than the comps imply.
- What's the recent tenant-quality profile in this submarket — average credit score on applications, eviction rate, late-payment / NSF rate, and stable-employment percentage? A property-management company in the area should have these aggregated.
- How much new apartment / multifamily construction is in the pipeline within 1–3 miles? Heavy new supply (>2% of stock underway) typically softens rents 12–24 months out; light construction supports rent growth.
Investment metrics
- 1% rule
- 1.23% ✓
- Cap rate
- 5.78%
- Cash-on-cash
- -1.83%
- DSCR
- 0.92
- GRM
- 6.8
CMA / ARV
No comps found within radius.
Projected returns pro-forma
-3.0% appreciation · 2.49% rent growth · sell at horizon
- IRR
- -19.9%
- Equity multiple
- 0.31×
- Total profit
- $-34,795
- Equity at exit
- $26,839
- IRR
- -13.9%
- Equity multiple
- 0.21×
- Total profit
- $-39,596
- Equity at exit
- $15,563
Cash invested: $50,400 (down + closing). Projections, not guarantees.
Landlord ↔ Tenant lean methodology
- Overall (STATE)
- 87 Strongly Landlord-Friendly
- State Florida
- 87 Strongly Landlord-Friendly · R+3
- County
- — inherits STATE
- City
- — inherits STATE
ZIP-level market 33410
- Rents YoY
- 2.5%
- Active inventory
- 309
- Price-to-rent
- 6.8×
Monthly cashflow live
- Estimated rent
- $2,216 medium interval (Pro) →
- Mortgage (P&I)
- −$944
- Tax from tax record
- −$181 /mo · $2,168/yr
- Insurance
- −$75
- HOA
- −$628
- Vacancy / Maint / Mgmt
- −$465
- Net cashflow
- $-77
Break-even live
Sensitivity live
| Price | -10% $25 | -5% $-26 | +0% $-77 | +5% $-128 | +10% $-179 |
|---|---|---|---|---|---|
| Rent | -10% $-252 | -5% $-164 | +0% $-77 | +5% $11 | +10% $98 |
| Rate | -1.0pp $14 | -0.5pp $-31 | base $-77 | +0.5pp $-123 | +1.0pp $-171 |
UW: 25.0% down · 7.5% · 30yr · 1.5% tax · 5.0% vac · 8.0% maint · 8.0% mgmt
Financing live
Cash to close
- Down payment
- $45,000
- Closing costs
- $5,400
- Reserves months
- —
- Total cash needed
- —
Loan-product check · same deal, 3 products live
Conventional
25% down · 7.5% · 30yr
- Down + closing
- —
- Monthly P&I
- —
- Monthly cashflow
- —
- DSCR
- —
- Eligible?
- —
Personal DTI + credit; lowest rate.
DSCR
20% down · 8.5% · 30yr
- Down + closing
- —
- Monthly P&I
- —
- Monthly cashflow
- —
- DSCR
- —
- Eligible?
- —
No personal income docs; deal must DSCR.
Hard money
10% down · 12.0% · 12mo
- Down + closing
- —
- Monthly P&I
- —
- Monthly cashflow
- —
- DSCR
- —
- Eligible?
- —
Short-term bridge; refi at stabilization.
Rent comps 4 comps
| Address | Beds | Baths | Sqft | Rent | $/sqft | DOM | Units | Dist |
|---|---|---|---|---|---|---|---|---|
| 11900 Valencia Gardens Ave Palm Beach Gardens, FL | 1.0–3.0 | 1.0–2.0 | 980 | $2,180 | $2.22 | 1d | 18 | 0.48mi |
| 2304 Myrtlewood Cir E Palm Beach Gardens, FL | 1.0 | 1.0 | 604 | $2,200 | $3.64 | 7d | 1 | 1.23mi |
| 2210 Myrtlewood Cir E Palm Beach Gardens, FL | 1.0 | 1.0 | 604 | $1,995 | $3.30 | 1d | 1 | 1.23mi |
| 3955 Design Center Dr Palm Beach Gardens, FL | 3.0 | 1.0–2.0 | 996 | $2,927 | $2.94 | 0d | 21 | 1.27mi |
HOA detail condo
- Monthly dues
- $628 · $7,536/yr
- Likely covers
- waterelectricpool
- Assessments
- None detected in remarks — confirm with the listing agent.
Listing history 27 events
-
2026-06-21days on market $180,000 Active 55 DOM
-
2026-06-18days on market $180,000 Active 52 DOM
-
2026-06-17days on market $180,000 Active 51 DOM
-
2026-06-16days on market $180,000 Active 50 DOM
-
2026-06-15days on market $180,000 Active 49 DOM
-
2026-06-13days on market $180,000 Active 47 DOM
-
2026-06-09days on market $180,000 Active 43 DOM
-
2026-06-08days on market $180,000 Active 42 DOM
-
2026-06-07days on market $180,000 Active 41 DOM
-
2026-06-04days on market $180,000 Active 38 DOM
-
2026-06-03days on market $180,000 Active 37 DOM
-
2026-06-02days on market $180,000 Active 36 DOM
-
2026-06-01days on market $180,000 Active 35 DOM
-
2026-05-31days on market $180,000 Active 34 DOM
-
2026-05-08price $185,000
-
2026-04-24historical
-
2026-04-23$199,000 Active
-
2026-03-24price $200,000
-
2026-03-02$205,000 Active
-
2025-06-20historical
-
2025-06-19$320,000 Active
-
2003-11-21soldstatus $84,000
-
2003-11-21soldstatus $84,000
-
2003-10-28historical
-
2003-10-21$84,900
-
1996-10-22soldstatus $33,500
-
1988-01-01soldstatus $32,000
ⓘ Source: listings_history table (triggers on properties + properties_extension) + one-shot
backfill from property_details.listing_events for pre-trigger history.
Tax reassessment forecast FL · Resets to sale price
- Current annual tax
- $2,168 · $181/mo
- Projected year-2 tax
- $2,168 · $181/mo
- Expected delta
- $0/yr ($0/mo · 0.0%)
ⓘ Screening estimate from a state-policy table — verify with the county assessor before closing.
Climate risk First Street
- Flood 1/10 Low FEMA zone X (unshaded) · 0% chance over 30 yrs
- Wildfire 1/10 Low
- Heat 10/10 Extreme 7 d/yr ≥106°F today · 25 d/yr by 30 yrs out
- Wind 10/10 Extreme 99% chance of damaging wind over 30 yrs
- Air quality 2/10 Low 1 unhealthy d/yr today · 2 by 30 yrs out
Nearby sold comps map
Loading sold comps map…
Walkable amenities ~0.75 mi
Loading nearby amenities…
Taxation est. · year 1
- Rental income
- $26,596
- − Mortgage interest
- −$10,083
- − Property taxes
- −$2,168
- − Insurance
- −$900
- − Repairs & maintenance
- −$2,128
- − Management
- −$2,128
- − HOA
- −$7,536
- − Depreciation
- −$5,236
- Taxable loss
- −$3,583
- Est. tax savings @ 24.0%
- +$860
- After-tax cash flow
- $-61/yr
For passive investors: Depreciation is non-cash, so a rental often shows a tax loss while cash-flowing — sheltering income. Rental losses are passive: they offset passive income freely, and up to $25,000/yr can offset ordinary (W-2) income if you actively participate and your MAGI is under $100k (phasing out to $0 by $150k); unused losses carry forward. On sale, claimed depreciation is recaptured at up to 25%, and gains may owe capital-gains tax (a 1031 exchange can defer both). Figures are a year-1 estimate at your 24.0% rate — not tax advice; consult a CPA.
Schools (NCES district)
- District
- Palm Beach
- NCES district ID
- 1201500
- Math proficiency
- 46% ▼ -16.00%
- Reading proficiency
- 53% ▼ -4.00%
- Median HH income
- $53,943
- Composite
- 42.72/100
- National rank
- #3160
- State rank
- #34 of 73 in FL
Livability — Cabana Colony
- Score
- 72/100
- State rank
- #346
- US rank
- #5999
Category grades
Schools grade is shown separately in the Schools card above.
Census & demographics
- Census place
- Cabana Colony, FL
- County
- Palm Beach County · 1,438,312 people
- Metro
- Miami-Fort Lauderdale-Pompano Beach, FL
- Population (ZIP)
- 36,759
- Household income
- $94,530
- Rent vs Own
- Severe rent burden
- 1429.0
Population outlook (Palm Beach County) Hauer SSP2
- Today (2025)
- 1,637,487 people
- By 2030
- 1,743,255 · +6.5%
- By 2040
- 1,948,712 · +19.0%
- By 2050
- 2,132,979 · +30.3%
- By 2075
- 2,530,027 · +54.5%
- By 2100
- 2,706,979 · +65.3%
Race, ethnicity, and origin ACS 2023
- Neighborhood character
- Predominantly White (70%)
- Race & ethnicity
- White 70% Hispanic / Latino 15% Two or more races 13% Black 5% Asian 4%
- Hispanic origin (detail)
- Mexican 2% Puerto Rican 2% Cuban 3%
- Common ancestry
- Romanian 4% Lithuanian 3% Slovak 2%
- Foreign-born
- 17% · Canada, Jamaica, Vietnam
- Languages at home
- 78% English-only · Spanish 13% French/Haitian/Cajun 3% Other Indo-European 2%
Political lean MEDSL · Palm Beach
- 2024 margin
- Toss-up / Even · D 50.0% · R 49.2%
- 2008→2024 swing
- -22.1pp toward R · 2008: 22.9pp · 2024: 0.8pp
- All cycles
- 2024: D+0.8 2020: D+12.8 2016: D+15.3 2012: D+17.0 2008: D+22.9
Not yet ingested
- Civics
- —
Market trends
- HPI YoY
- ▼ -346.12%
- Current HPI
- 375.5381
- Rent YoY
- ▲ 2.49%
- Metro
- Miami-Fort Lauderdale-Pompano Beach, FL
- State GDP YoY
- ▲ 3.28%
- F500 in state
- 36
Industry mix (Fortune 500 HQ in FL)
| Industry | F500 HQs | Revenue |
|---|---|---|
| Industrial Technology | 2 | $29B |
|
||
| Insurance | 2 | $17B |
|
||
| Retail | 1 | $60B |
|
||
| Technology Distribution | 1 | $58B |
|
||
| Homebuilding | 1 | $35B |
|
||
| Technology Manufacturing | 1 | $35B |
|
||
Price history
+478.1% since first listed13 events — show timeline
- 2026-05-08 Price Changed $185,000 Beaches MLS
- 2026-04-24 Listing Removed — Beaches MLS
- 2026-04-23 Listed $199,000 Beaches MLS
- 2026-03-24 Price Changed $200,000 Beaches MLS
- 2026-03-02 Listed $205,000 Beaches MLS
- 2025-06-20 Listing Removed — MARMLS
- 2025-06-19 Listed $320,000 MARMLS
- 2003-11-21 Sold (Public Records) $84,000 Public Records
- 2003-11-21 Sold (MLS) $84,000 Beaches MLS
- 2003-10-28 Listing Removed — Beaches MLS
- 2003-10-21 Listed $84,900 Beaches MLS
- 1996-10-22 Sold (Public Records) $33,500 Public Records
- 1988-01-01 Sold (Public Records) $32,000 Public Records
Property tax history
+7.5%/yrLatest (2025): $2,168 · +5.7% YoY. Source: county tax records.
Cash-flow waterfall
monthlySold comps — $/sqft
last 12 mo · ≤1 miLoading sold comps…