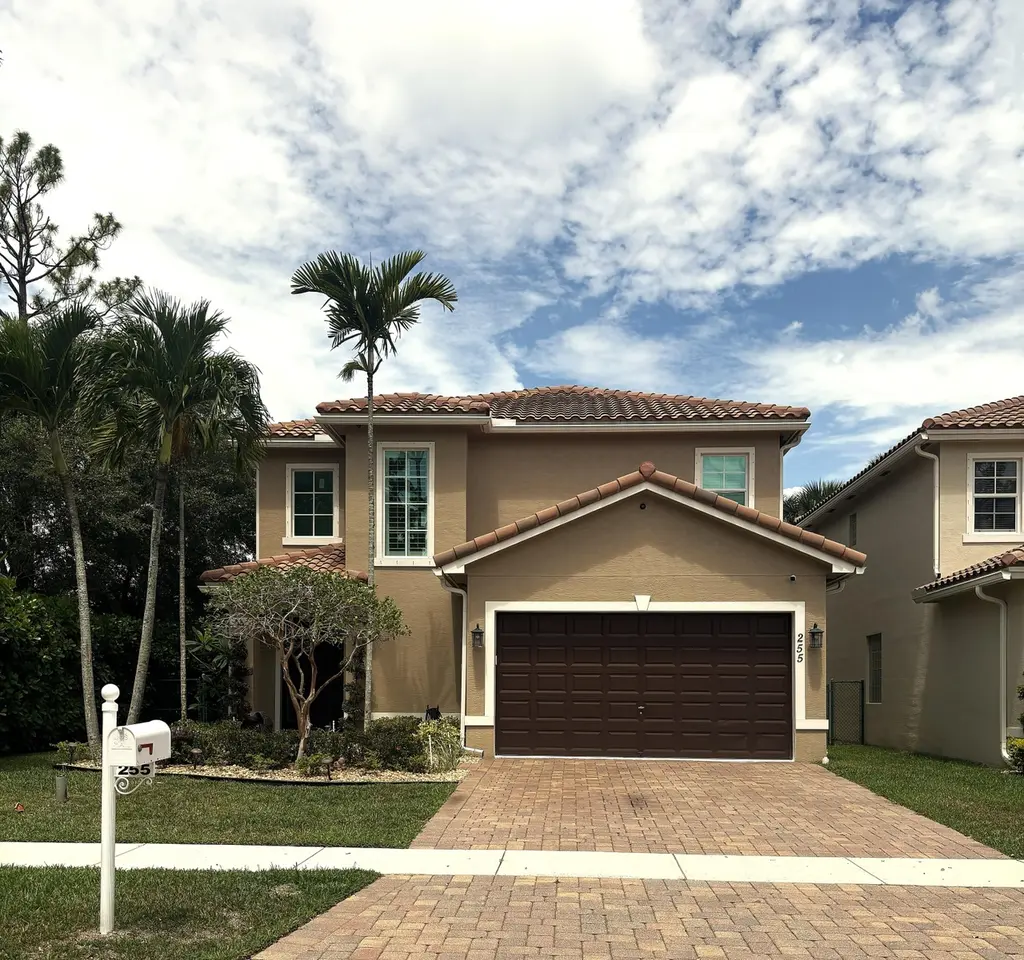
255 Atwell Dr · Greenacres, FL
Flood risk 1/10 · Minimal
- FEMA flood zone
- X (unshaded)
- Chance of flooding over 30 yrs
- 0.0%
- Est. flood insurance / yr
- $507 – $1,088
Fire risk 2/10 · Minimal
- Est. fire insurance / yr
- $947 – $1,759
Heat risk 9/10 · Severe
- Hot days now (above 106°F)
- 7 days/yr
- Hot days in 30 yrs
- 24 days/yr
Wind risk 10/10 · Severe
- Chance of severe wind over 30 yrs
- 99.0%
Air-quality risk 2/10 · Minimal
- Unhealthy air days now
- 0 days/yr
- Unhealthy air days in 30 yrs
- 1 days/yr
Risk factors via First Street. Map © Google.
Why this score? — see what drove the D+ grade
The composite is a weighted blend of 9 inputs, each scored 0–100. Each bar is that input's sub-score; the figure is the points it added to the 100-point composite (weight × sub-score).
- Cash flow +11.0/30.0
- Appreciation +10.0/10.0
- ARV discount +7.5/15.0
- Schools +4.3/10.0
- Livability +3.5/5.0
- DSCR +3.2/10.0
- 1% rule +2.8/10.0
- Rent growth +2.7/5.0
- Condition / age +2.5/5.0
$595,000
🖨 Deal sheet 📄 Offer letter ✓ Due diligence
Listing remarks
This is the selling agents own residence and is an absolute must see. This home includes, impact glass throughout, a private and fenced backyard, surrounded by mature Clusia bushes, and a two car garage with additional custom storage. Inside, this home offers a light and bright open floor plan, with both a formal living room and dining room. The large kitchen overlooks the family room and offers a pantry and plenty of cabinet space. upstairs has three generous size bedrooms, with a primary suite that includes a large walk-in closet with custom shelving and an ensuite bath, which offers a Jacuzzi tub, a large separate shower, and dual vanities. This home is centrally located within minutes
Key facts
- Large outdoor patio
- Oversized kitchen
- Full impact windows
Tags
Property features AI
Finance
- Other: Pets allowed (restrictions possible)
- HOA & community: HOA with monthly fee; HOA amenities include pool, parking, and sidewalks
Exterior
- Parking: Attached 2-car garage; Driveway with guest parking; Garage door opener; 2 covered parking spaces (garage)
- Security: Closed-circuit cameras; Owned security system
- Utilities: Public water; Public sewer; Electricity connected; Water connected; Sewer connected; Cable available
- Home design: Single-family home; Two stories; Resale condition; Faces east
- Construction: Stucco and CBS construction; Tile roof; Slab foundation; Built as a multi-story residence
- Exterior features: Fenced backyard; Landscaped yard; Sidewalks
Interior
- Kitchen: Dishwasher; Electric range; Microwave; Refrigerator; Garbage disposal; Electric water heater
- Bedrooms: No main-level bedrooms
- Flooring: Carpet; Tile
- Bathrooms: 2 full bathrooms; 1 half bathroom (3 total bathrooms)
- Heating & cooling: Central heating; Central air conditioning
- Interior features: Entrance foyer; High ceilings; Walk-in closets; Closet cabinetry; Plantation shutters; Storm windows
- Laundry & utility: Inside laundry on upper level
Neighborhood map
What this means for you Summary
Snapshot
- This is a 3-bed/2.5-bath single-family listed at $595k.
Deal economics
- At list price, monthly cash flow is $-255 ($-3k/yr) — negative.
- To cash-flow at today's rent, offer at most $550k (7.6% below list).
- To meet the 1% rule (rent ≥ 1% of price), the offer needs to be $466k (21.7% below list).
- Recommended offer: $466k (21.7% below list) — sets the bar for 1% rule.
Location & tenants
- Location reads 69/100 on livability (#490 in FL) — a middle-class / working-renter tenant base. Strengths: cost of living A+, housing A+, health & safety A; Watch: employment D, amenities F, commute F.
- Palm Beach (suburban): math 46% / reading 53% proficiency, ranked #34 of 73 in FL (top 47%) — families likely to look elsewhere, expect single-tenant / working-renter base with shorter leases.
- Zoned schools: Everglades Elementary (math 70% / reading 74%, grade A-, #288 of 2,144 statewide, top 15%, 888 students, 34% FRL); Emerald Cove Middle School (math 61% / reading 64%, grade B+, #116 of 571 statewide, top 21%, 1,241 students, 36% FRL); Palm Beach Central High School (math 42% / reading 55%, grade D, #198 of 667 statewide, top 30%, 2,980 students, 40% FRL) — zoned schools average 36% FRL vs 52% district-wide (16 pts lower); this property's tenant base skews higher-income than the district average.
- Market conditions: Rents flat; 574 active listings in the ZIP; 6 comparable units currently listed for rent nearby; rentals at typical pace (median 25d on market — plan ~3-4 weeks tenant-placement turnaround); solid renter incomes; 3,974 units permitted in Palm Beach County in 2024 (1,012 in 5+ unit buildings).
- At $4,660/mo this rent would consume 60% of the median local household income ($93k/yr) (locally 1870% of renters already pay >50% of income on rent) — very limited rent-growth headroom before tenants either downsize or default.
Forward outlook
- In year one you build about $64k of equity ($4k loan paydown + $60k appreciation (10.0% local appreciation)).
- Palm Beach County population projected at +30% by 2050 — long-run rental-demand tailwind backs the buy-and-hold thesis.
- By year 2, paydown + projected appreciation supports a ~$102k cash-out refi (75% LTV) — recoverable capital for the next deal without selling this one.
Negotiation context
- Only 11 days on market — expect competitive offers; lowballing is unlikely to land.
Risks & watch-outs
- Climate carrying-cost: severe wind risk, 99% chance of damaging wind over 30y; extreme-heat days projected 7→24/yr by 2055 (HVAC capex compounding) — expect insurance premiums to compound above CPI over the hold.
Questions for the listing agent
- What do current leases actually rent for vs. the listed asking? Can we see a recent rent roll and the last 12 months of T-12 income?
- What does the HOA fee cover, when was the last increase, and are there any pending special assessments or reserve-fund shortfalls?
- Is there a deadline driving the sale (1031 exchange, divorce, estate, relocation)? That informs how much negotiation room exists.
- Schools are D-rated, which usually means shorter tenancies and higher turnover. Who's the typical renter profile here, and what's been the actual vacancy rate?
- The area grade is low — what's the realistic commute time and amenity access for the typical tenant pool here? Any planned neighborhood developments (good or bad) we should know about?
- What's the average days-on-market for RENTAL listings here right now (not sales)? A rising rental-DOM trend means longer vacancies and softer asking-rent achievability than the comps imply.
- What's the recent tenant-quality profile in this submarket — average credit score on applications, eviction rate, late-payment / NSF rate, and stable-employment percentage? A property-management company in the area should have these aggregated.
- How much new for-sale + rental construction is in the pipeline within 1–3 miles? Heavy new supply typically softens prices + rents 12–24 months out; constrained supply supports both.
Investment metrics
- 1% rule
- 0.78% ✗
- Cap rate
- 5.78%
- Cash-on-cash
- -1.84%
- DSCR
- 0.92
- GRM
- 10.6
CMA / ARV
No comps found within radius.
Projected returns pro-forma
10.0% appreciation · 0.85% rent growth · sell at horizon
- IRR
- 22.3%
- Equity multiple
- 2.79×
- Total profit
- $297,910
- Equity at exit
- $536,023
- IRR
- 19.6%
- Equity multiple
- 6.23×
- Total profit
- $871,669
- Equity at exit
- $1,155,954
Cash invested: $166,600 (down + closing). Projections, not guarantees.
Landlord ↔ Tenant lean methodology
- Overall (STATE)
- 87 Strongly Landlord-Friendly
- State Florida
- 87 Strongly Landlord-Friendly · R+3
- County
- — inherits STATE
- City
- — inherits STATE
ZIP-level market 33411
- Home prices YoY
- 1.9%
- Rents YoY
- 0.8%
- Active inventory
- 574
- Price-to-rent
- 10.6×
Monthly cashflow live
- Estimated rent
- $4,660 high interval (Pro) →
- Mortgage (P&I)
- −$3,120
- Tax from tax record
- −$352 /mo · $4,228/yr
- Insurance
- −$248
- HOA
- −$216
- Vacancy / Maint / Mgmt
- −$979
- Net cashflow
- $-255
Break-even live
UW: 25.0% down · 7.5% · 30yr · 1.5% tax · 5.0% vac · 8.0% maint · 8.0% mgmt
Financing live
Cash to close
- Down payment
- $148,750
- Closing costs
- $17,850
- Reserves months
- —
- Total cash needed
- —
Loan-product check · same deal, 3 products live
Conventional
25% down · 7.5% · 30yr
- Down + closing
- —
- Monthly P&I
- —
- Monthly cashflow
- —
- DSCR
- —
- Eligible?
- —
Personal DTI + credit; lowest rate.
DSCR
20% down · 8.5% · 30yr
- Down + closing
- —
- Monthly P&I
- —
- Monthly cashflow
- —
- DSCR
- —
- Eligible?
- —
No personal income docs; deal must DSCR.
Hard money
10% down · 12.0% · 12mo
- Down + closing
- —
- Monthly P&I
- —
- Monthly cashflow
- —
- DSCR
- —
- Eligible?
- —
Short-term bridge; refi at stabilization.
Rent comps 6 comps
| Address | Beds | Baths | Sqft | Rent | $/sqft | DOM | Units | Dist |
|---|---|---|---|---|---|---|---|---|
| 8421 Pioneer Rd West Palm Beach, FL | 3.0 | 2.0 | 2000 | $2,900 | $1.45 | 7d | 1 | 0.49mi |
| 8152 Butler Greenwood Dr Royal Palm Beach, FL | 3.0 | 3.0 | 2323 | $10,000 | $4.30 | 24d | 1 | 0.61mi |
| 8694 Pioneer Rd West Palm Beach, FL | 4.0 | 3.0 | 2000 | $3,500 | $1.75 | 18d | 1 | 0.78mi |
| 699 Belle Grove Ln Royal Palm Beach, FL | 3.0 | 2.0 | 1849 | $3,500 | $1.89 | 24d | 1 | 0.88mi |
| 851 Edgebrook Ln West Palm Beach, FL | 4.0 | 3.0 | 3038 | $7,200 | $2.37 | 7d | 1 | 1.00mi |
| 625 Whippoorwill Ter West Palm Beach, FL | 3.0 | 2.0 | 1914 | $4,500 | $2.35 | 24d | 1 | 1.43mi |
HOA detail
- Monthly dues
- $216 · $2,592/yr
Listing history 9 events
-
2026-06-18status $595,000 Pending 11 DOM
-
2026-06-18days on market $595,000 Active 11 DOM
-
2026-06-17days on market $595,000 Active 10 DOM
-
2026-06-16days on market $595,000 Active 9 DOM
-
2026-06-15days on market $595,000 Active 8 DOM
-
2026-06-13days on market $595,000 Active 6 DOM
-
2026-06-09days on market $595,000 Active 2 DOM
-
2026-06-08remarks 699-char remark
-
2026-06-08$595,000 Active 1 DOM
ⓘ Source: listings_history table (triggers on properties + properties_extension) + one-shot
backfill from property_details.listing_events for pre-trigger history.
Tax reassessment forecast FL · Resets to sale price
- Current annual tax
- $4,228 · $352/mo
- Projected year-2 tax
- $4,938 · $412/mo
- Expected delta
- +$711/yr (+$59/mo · 16.8%)
ⓘ Screening estimate from a state-policy table — verify with the county assessor before closing.
Climate risk First Street
- Flood 1/10 Low FEMA zone X (unshaded) · 0% chance over 30 yrs
- Wildfire 2/10 Low
- Heat 9/10 Extreme 7 d/yr ≥106°F today · 24 d/yr by 30 yrs out
- Wind 10/10 Extreme 99% chance of damaging wind over 30 yrs
- Air quality 2/10 Low 0 unhealthy d/yr today · 1 by 30 yrs out
Nearby sold comps map
Loading sold comps map…
Walkable amenities ~0.75 mi
Loading nearby amenities…
Taxation est. · year 1
- Rental income
- $55,923
- − Mortgage interest
- −$33,329
- − Property taxes
- −$4,228
- − Insurance
- −$2,975
- − Repairs & maintenance
- −$4,474
- − Management
- −$4,474
- − HOA
- −$2,592
- − Depreciation
- −$17,309
- Taxable loss
- −$13,458
- Est. tax savings @ 24.0%
- +$3,230
- After-tax cash flow
- $171/yr
For passive investors: Depreciation is non-cash, so a rental often shows a tax loss while cash-flowing — sheltering income. Rental losses are passive: they offset passive income freely, and up to $25,000/yr can offset ordinary (W-2) income if you actively participate and your MAGI is under $100k (phasing out to $0 by $150k); unused losses carry forward. On sale, claimed depreciation is recaptured at up to 25%, and gains may owe capital-gains tax (a 1031 exchange can defer both). Figures are a year-1 estimate at your 24.0% rate — not tax advice; consult a CPA.
Schools (NCES district)
- District
- Palm Beach
- NCES district ID
- 1201500
- Math proficiency
- 46% ▼ -16.00%
- Reading proficiency
- 53% ▼ -4.00%
- Median HH income
- $53,943
- Composite
- 42.72/100
- National rank
- #3160
- State rank
- #34 of 73 in FL
Livability — Greenacres
- Score
- 69/100
- State rank
- #490
- US rank
- #9008
Category grades
Schools grade is shown separately in the Schools card above.
Census & demographics
- County
- Palm Beach County · 1,438,312 people
- City population
- 222,012
- Metro
- Miami-Fort Lauderdale-Pompano Beach, FL
- Population (ZIP)
- 76,863
- Household income
- $92,591
- Rent vs Own
- Severe rent burden
- 1870.0
Population outlook (Palm Beach County) Hauer SSP2
- Today (2025)
- 1,637,487 people
- By 2030
- 1,743,255 · +6.5%
- By 2040
- 1,948,712 · +19.0%
- By 2050
- 2,132,979 · +30.3%
- By 2075
- 2,530,027 · +54.5%
- By 2100
- 2,706,979 · +65.3%
Race, ethnicity, and origin ACS 2023
- Neighborhood character
- Diverse neighborhood (Simpson 0.70)
- Race & ethnicity
- White 44% Hispanic / Latino 24% Black 23% Two or more races 16% Asian 5%
- Hispanic origin (detail)
- Mexican 2% Puerto Rican 5% Cuban 4% Dominican 2%
- Common ancestry
- Hispanic 6% Romanian 2% Italian 1%
- Foreign-born
- 26% · Canada, Jamaica, China
- Languages at home
- 73% English-only · Spanish 17% French/Haitian/Cajun 4% Other Indo-European 2%
Political lean MEDSL · Palm Beach
- 2024 margin
- Toss-up / Even · D 50.0% · R 49.2%
- 2008→2024 swing
- -22.1pp toward R · 2008: 22.9pp · 2024: 0.8pp
- All cycles
- 2024: D+0.8 2020: D+12.8 2016: D+15.3 2012: D+17.0 2008: D+22.9
Not yet ingested
- Civics
- —
Market trends
- HPI YoY
- ▲ 17.04%
- Current HPI
- 903.78
- Rent YoY
- ▲ 0.85%
- Metro
- Miami-Fort Lauderdale-Pompano Beach, FL
- State GDP YoY
- ▲ 3.28%
- F500 in state
- 36
Industry mix (Fortune 500 HQ in FL)
| Industry | F500 HQs | Revenue |
|---|---|---|
| Industrial Technology | 2 | $29B |
|
||
| Insurance | 2 | $17B |
|
||
| Retail | 1 | $60B |
|
||
| Technology Distribution | 1 | $58B |
|
||
| Homebuilding | 1 | $35B |
|
||
| Technology Manufacturing | 1 | $35B |
|
||
Price history
1 event — show timeline
- 2026-06-06 Listed $595,000 Beaches MLS
Property tax history
+24.5%/yrLatest (2025): $4,228 · +3.1% YoY. Source: county tax records.
Cash-flow waterfall
monthlySold comps — $/sqft
last 12 mo · ≤1 miLoading sold comps…