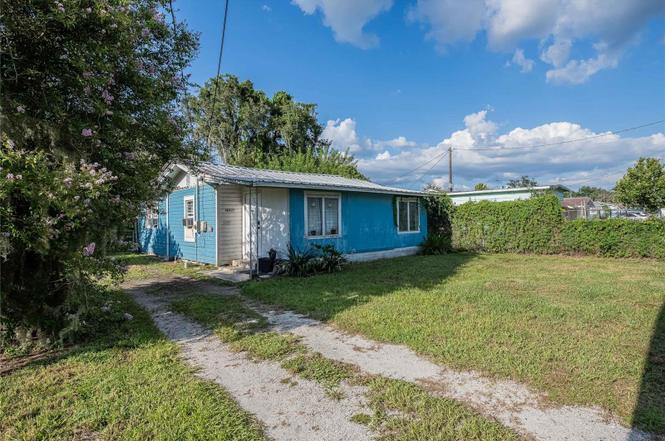
2236 Burns St · Combee Settlement, FL
Flood risk 1/10 · Minimal
- FEMA flood zone
- X (unshaded)
- Chance of flooding over 30 yrs
- 0.0%
- Est. flood insurance / yr
- $507 – $1,088
Fire risk 2/10 · Minimal
- Est. fire insurance / yr
- $947 – $1,759
Heat risk 8/10 · Major
- Hot days now (above 108°F)
- 7 days/yr
- Hot days in 30 yrs
- 24 days/yr
Wind risk 9/10 · Severe
- Chance of severe wind over 30 yrs
- 99.0%
Air-quality risk 2/10 · Minimal
- Unhealthy air days now
- 1 days/yr
- Unhealthy air days in 30 yrs
- 2 days/yr
Risk factors via First Street. Map © Google.
Why this score? — see what drove the C+ grade
The composite is a weighted blend of 9 inputs, each scored 0–100. Each bar is that input's sub-score; the figure is the points it added to the 100-point composite (weight × sub-score).
- Cash flow +25.9/30.0
- DSCR +8.7/10.0
- ARV discount +7.5/15.0
- 1% rule +6.8/10.0
- Schools +3.5/10.0
- Livability +3.5/5.0
- Rent growth +2.8/5.0
- Condition / age +2.5/5.0
- Appreciation +0.0/10.0
$114,000
🖨 Deal sheet 📄 Offer letter ✓ Due diligence
Listing remarks
Great opportunity for an investor, first-time homebuyer, or anyone looking for simple, low-maintenance living! This cozy home features 2 bedrooms plus an office, offering flexibility for remote work or hobbies. The kitchen includes a dedicated eating space, perfect for casual meals. Major updates provide peace of mind, including a metal roof only 5 years old and a recently replaced septic system and drain field. Located just minutes from beautiful Lake Parker and Lake Parker Park, where you’ll find a public boat ramp, fishing dock, playground, and recreational activities. Conveniently close to shopping, dining, and entertainment with easy access to I-4 for a smooth commute. Don’
Key facts
- Fishing dock
- Metal roof
- Public boat ramp
Tags
Property features AI
Finance
- Other: Zoning: R-2
- HOA & community: No association; Pets allowed
Exterior
- Parking: Driveway
- Utilities: Public water; Septic tank; Electricity connected; Water connected
- Home design: Single family residence; One story; South-facing
- Construction: Frame construction with wood siding; Metal roof; Pillar/post/pier foundation; Building area approximately 1,058 sq ft; Living area approximately 754 sq ft; Total lot size about 0.16 acre
- Exterior features: Lighting; Private mailbox; Paved road access; Lot approximately 0.16 acre (50 x 138)
Interior
- Kitchen: Dishwasher; Microwave; Range; Refrigerator; Eat-in kitchen
- Bedrooms: 3 bedrooms
- Flooring: Carpet; Linoleum
- Bathrooms: 1 full bathroom
- Heating & cooling: Ductless heating; Wall/window cooling units
- Interior features: Ceiling fans; Eat-in kitchen; Wood-burning fireplace
- Laundry & utility: Washer; Dryer; Laundry inside
Neighborhood map
What this means for you Summary
Snapshot
- This is a 2-bed/1.0-bath single-family listed at $114k.
Deal economics
- At list price, monthly cash flow is $281 ($3k/yr) — positive.
- The deal already cash-flows at list — no discount required.
- Meets the 1% rule at list price ($1k rent vs $114k).
- Recommended offer: $100k (12.0% below list) — sets the bar for market timing.
Location & tenants
- Location reads 69/100 on livability (#476 in FL) — a middle-class / working-renter tenant base. Strengths: cost of living A+, housing A+, health & safety A+; Watch: employment D, amenities F, commute F.
- Polk (suburban): math 39% / reading 43% proficiency, ranked #62 of 73 in FL (top 85%) — families likely to look elsewhere, expect single-tenant / working-renter base with shorter leases.
- Zoned schools: Philip O'Brien Elementary School (math 31% / reading 30%, grade F, #1,862 of 2,144 statewide, top 88%, 627 students, 61% FRL) — zoned schools at 61% FRL track the district average.
- Market conditions: Rents rising (+1.1%/yr); 253 active listings in the ZIP; 13 comparable units currently listed for rent nearby; rentals at typical pace (median 23d on market — plan ~3-4 weeks tenant-placement turnaround); 10,384 units permitted in Polk County in 2024 (1,716 in 5+ unit buildings).
- This rent runs 30% of the median local income ($53k/yr) — at the standard rent-burdened threshold; future hikes will face affordability resistance.
Forward outlook
- Local home prices are declining (-3.0%/yr); year-one equity from $788 of loan paydown is wiped out by about $3k of value loss. Plan a longer hold.
- Polk County population projected at +33% by 2050 — long-run rental-demand tailwind backs the buy-and-hold thesis.
Negotiation context
- It's been on market 206 days — a 12% lower offer ($100k) is reasonable based on typical stale-listing flexibility.
- 2 sale attempts; this cycle's ask has dropped $15k (12%) from the opening price — seller is motivated, your offer sets the floor, not the list.
- Current owner paid $90k; 27% above their basis — modest negotiation headroom, anchor on the comps not their cost.
Risks & watch-outs
- Watch-outs: built in 1930 — expect roof / HVAC / electrical / plumbing capex.
- Climate carrying-cost: severe wind risk, 99% chance of damaging wind over 30y; extreme-heat days projected 7→24/yr by 2055 (HVAC capex compounding) — expect insurance premiums to compound above CPI over the hold.
Questions for the listing agent
- It's been on market 206 days. Have you received any prior offers? Is the seller open to a 12% concession, seller financing, or rate buy-down credit?
- Built in 1930 — when were the roof, HVAC, electrical panel, plumbing, and water heater last replaced?
- Why hasn't it sold? Are there any deal-killer items the seller is aware of (foundation, flood, title, zoning, code violations)?
- Is there a deadline driving the sale (1031 exchange, divorce, estate, relocation)? That informs how much negotiation room exists.
- What's the average days-on-market for RENTAL listings here right now (not sales)? A rising rental-DOM trend means longer vacancies and softer asking-rent achievability than the comps imply.
- What's the recent tenant-quality profile in this submarket — average credit score on applications, eviction rate, late-payment / NSF rate, and stable-employment percentage? A property-management company in the area should have these aggregated.
- How much new for-sale + rental construction is in the pipeline within 1–3 miles? Heavy new supply typically softens prices + rents 12–24 months out; constrained supply supports both.
Investment metrics
- 1% rule
- 1.18% ✓
- Cap rate
- 9.25%
- Cash-on-cash
- 10.58%
- DSCR
- 1.47
- GRM
- 7.1
CMA / ARV
No comps found within radius.
Projected returns pro-forma
-3.0% appreciation · 1.05% rent growth · sell at horizon
- IRR
- -2.6%
- Equity multiple
- 0.90×
- Total profit
- $-3,119
- Equity at exit
- $16,998
- IRR
- 4.8%
- Equity multiple
- 1.32×
- Total profit
- $10,234
- Equity at exit
- $9,857
Cash invested: $31,920 (down + closing). Projections, not guarantees.
Landlord ↔ Tenant lean methodology
- Overall (STATE)
- 87 Strongly Landlord-Friendly
- State Florida
- 87 Strongly Landlord-Friendly · R+3
- County
- — inherits STATE
- City
- — inherits STATE
ZIP-level market 33801
- Home prices YoY
- -15.9%
- Rents YoY
- 1.1%
- Active inventory
- 253
- Price-to-rent
- 7.1×
Monthly cashflow live
- Estimated rent
- $1,341 high interval (Pro) →
- Mortgage (P&I)
- −$598
- Tax from tax record
- −$133 /mo · $1,591/yr
- Insurance
- −$48
- HOA
- −$0
- Vacancy / Maint / Mgmt
- −$282
- Net cashflow
- $281
Break-even live
UW: 25.0% down · 7.5% · 30yr · 1.5% tax · 5.0% vac · 8.0% maint · 8.0% mgmt
Financing live
Cash to close
- Down payment
- $28,500
- Closing costs
- $3,420
- Reserves months
- —
- Total cash needed
- —
Loan-product check · same deal, 3 products live
Conventional
25% down · 7.5% · 30yr
- Down + closing
- —
- Monthly P&I
- —
- Monthly cashflow
- —
- DSCR
- —
- Eligible?
- —
Personal DTI + credit; lowest rate.
DSCR
20% down · 8.5% · 30yr
- Down + closing
- —
- Monthly P&I
- —
- Monthly cashflow
- —
- DSCR
- —
- Eligible?
- —
No personal income docs; deal must DSCR.
Hard money
10% down · 12.0% · 12mo
- Down + closing
- —
- Monthly P&I
- —
- Monthly cashflow
- —
- DSCR
- —
- Eligible?
- —
Short-term bridge; refi at stabilization.
Rent comps 13 comps
| Address | Beds | Baths | Sqft | Rent | $/sqft | DOM | Units | Dist |
|---|---|---|---|---|---|---|---|---|
| 2248 Weber St Lakeland, FL | 2.0 | 1.0 | 640 | $1,335 | $2.09 | 3d | 1 | 0.06mi |
| 2417 Golfview St Lakeland, FL | 3.0 | 1.0 | 798 | $1,395 | $1.75 | 10d | 1 | 0.24mi |
| 832 N Combee Rd Lakeland, FL | 2.0 | 1.0 | 560 | $1,195 | $2.13 | 23d | 1 | 0.43mi |
| 2625 Kelly Ln Lakeland, FL | 1.0 | 1.0 | 560 | $1,200 | $2.14 | 23d | 1 | 0.65mi |
| 2437 Idlewild St Lakeland, FL | 1.0 | 1.0 | 550 | $1,099 | $2.00 | 14d | 1 | 0.72mi |
| 2437 Idlewild St Lakeland, FL | 1.0 | 1.0 | 550 | $1,099 | $2.00 | 23d | 1 | 0.72mi |
| 2415 Idlewild St Lakeland, FL | 2.0 | 1.0 | 900 | $1,300 | $1.44 | 23d | 1 | 0.73mi |
| 2184 Colonial Ave Lakeland, FL | 3.0 | 2.0 | 1123 | $1,645 | $1.46 | 23d | 1 | 0.89mi |
| 1736 E Fern Rd Lakeland, FL | 2.0 | 1.0 | 820 | $1,325 | $1.62 | 23d | 1 | 0.91mi |
| 3245 E Main St Lakeland, FL | 2.0 | 1.0 | 750 | $1,100 | $1.47 | 23d | 1 | 1.25mi |
| 3245 E Main St Unit 2 Lakeland, FL | 2.0 | 2.0 | 700 | $1,250 | $1.79 | 14d | 1 | 1.25mi |
| 2023 Tennyson St Unit 2025 Lakeland, FL | 2.0 | 1.0 | 884 | $1,095 | $1.24 | 23d | 1 | 1.25mi |
| 1452 Ridge Lake Ct Lakeland, FL | 2.0 | 1.5 | 960 | $1,700 | $1.77 | 21d | 1 | 1.26mi |
Listing history 20 events
-
2026-06-18days on market $114,000 Active 206 DOM
-
2026-06-17days on market $114,000 Active 205 DOM
-
2026-06-16days on market $114,000 Active 204 DOM
-
2026-06-15days on market $114,000 Active 203 DOM
-
2026-06-13days on market $114,000 Active 201 DOM
-
2026-06-10days on market $114,000 Active 198 DOM
-
2026-06-09days on market $114,000 Active 197 DOM
-
2026-06-08days on market $114,000 Active 196 DOM
-
2026-06-07days on market $114,000 Active 195 DOM
-
2026-06-05days on market $114,000 Active 192 DOM
-
2026-06-03days on market $114,000 Active 190 DOM
-
2026-06-01days on market $114,000 Active 189 DOM
-
2026-05-31days on market $114,000 Active 188 DOM
-
2026-05-05price $114,000
-
2026-02-10status Active
-
2025-12-16soldstatus $90,000
-
2025-11-12status Pending
-
2025-09-10price $119,000
-
2025-08-25$129,000 Active
-
1972-01-01soldstatus $7,000
ⓘ Source: listings_history table (triggers on properties + properties_extension) + one-shot
backfill from property_details.listing_events for pre-trigger history.
Tax reassessment forecast FL · Resets to sale price
- Current annual tax
- $1,591 · $133/mo
- Projected year-2 tax
- $1,591 · $133/mo
- Expected delta
- $0/yr ($0/mo · 0.0%)
ⓘ Screening estimate from a state-policy table — verify with the county assessor before closing.
Climate risk First Street
- Flood 1/10 Low FEMA zone X (unshaded) · 0% chance over 30 yrs
- Wildfire 2/10 Low
- Heat 8/10 Severe 7 d/yr ≥108°F today · 24 d/yr by 30 yrs out
- Wind 9/10 Extreme 99% chance of damaging wind over 30 yrs
- Air quality 2/10 Low 1 unhealthy d/yr today · 2 by 30 yrs out
Nearby sold comps map
Loading sold comps map…
Walkable amenities ~0.75 mi
Loading nearby amenities…
Taxation est. · year 1
- Rental income
- $16,090
- − Mortgage interest
- −$6,386
- − Property taxes
- −$1,591
- − Insurance
- −$570
- − Repairs & maintenance
- −$1,287
- − Management
- −$1,287
- − Depreciation
- −$3,316
- Taxable income
- $1,653
- Est. tax owed @ 24.0%
- −$397
- After-tax cash flow
- $2,980/yr
For passive investors: Depreciation is non-cash, so a rental often shows a tax loss while cash-flowing — sheltering income. Rental losses are passive: they offset passive income freely, and up to $25,000/yr can offset ordinary (W-2) income if you actively participate and your MAGI is under $100k (phasing out to $0 by $150k); unused losses carry forward. On sale, claimed depreciation is recaptured at up to 25%, and gains may owe capital-gains tax (a 1031 exchange can defer both). Figures are a year-1 estimate at your 24.0% rate — not tax advice; consult a CPA.
Schools (NCES district)
- District
- Polk
- NCES district ID
- 1201590
- Math proficiency
- 39% ▼ -11.00%
- Reading proficiency
- 43% ▼ -4.00%
- Median HH income
- $43,979
- Composite
- 34.74/100
- National rank
- #5132
- State rank
- #62 of 73 in FL
Livability — Combee Settlement
- Score
- 69/100
- State rank
- #476
- US rank
- #8672
Category grades
Schools grade is shown separately in the Schools card above.
Census & demographics
- Census place
- Combee Settlement, FL
- County
- Polk County · 740,051 people
- Metro
- Lakeland-Winter Haven, FL
- Population (ZIP)
- 35,394
- Household income
- $53,061
- Rent vs Own
- Severe rent burden
- 1291.0
Population outlook (Polk County) Hauer SSP2
- Today (2025)
- 752,975 people
- By 2030
- 804,621 · +6.9%
- By 2040
- 906,117 · +20.3%
- By 2050
- 1,000,476 · +32.9%
- By 2075
- 1,197,520 · +59.0%
- By 2100
- 1,271,518 · +68.9%
Race, ethnicity, and origin ACS 2023
- Neighborhood character
- Diverse neighborhood (Simpson 0.58)
- Race & ethnicity
- White 60% Hispanic / Latino 19% Black 16% Two or more races 8% Asian 1%
- Hispanic origin (detail)
- Mexican 5% Puerto Rican 8% Cuban 3%
- Common ancestry
- Romanian 2% Slovak 2% Lithuanian 1%
- Foreign-born
- 8% · Canada
- Languages at home
- 83% English-only · Spanish 14% French/Haitian/Cajun 1%
Political lean MEDSL · Polk
- 2024 margin
- Strong R (+20.7) · D 39.2% · R 59.9%
- 2008→2024 swing
- -14.6pp toward R · 2008: -6.1pp · 2024: -20.7pp
- All cycles
- 2024: R+20.7 2020: R+14.4 2016: R+14.1 2012: R+6.8 2008: R+6.1
Not yet ingested
- Civics
- —
Market trends
- HPI YoY
- ▼ -70.91%
- Current HPI
- 373.7159
- Rent YoY
- ▲ 1.05%
- Metro
- Lakeland-Winter Haven, FL
- State GDP YoY
- ▲ 3.28%
- F500 in state
- 36
Industry mix (Fortune 500 HQ in FL)
| Industry | F500 HQs | Revenue |
|---|---|---|
| Industrial Technology | 2 | $29B |
|
||
| Insurance | 2 | $17B |
|
||
| Retail | 1 | $60B |
|
||
| Technology Distribution | 1 | $58B |
|
||
| Homebuilding | 1 | $35B |
|
||
| Technology Manufacturing | 1 | $35B |
|
||
Price history
+1528.6% since first listed7 events — show timeline
- 2026-05-05 Price Changed $114,000 Stellar MLS as Distributed by MLS Grid
- 2026-02-10 Relisted — Stellar MLS as Distributed by MLS Grid
- 2025-12-16 Sold (Public Records) $90,000 Public Records
- 2025-11-12 Pending — Stellar MLS as Distributed by MLS Grid
- 2025-09-10 Price Changed $119,000 Stellar MLS as Distributed by MLS Grid
- 2025-08-25 Listed $129,000 Stellar MLS as Distributed by MLS Grid
- 1972-01-01 Sold (Public Records) $7,000 Public Records
Property tax history
+15.6%/yrLatest (2025): $1,591 · +13.6% YoY. Source: county tax records.
Cash-flow waterfall
monthlySold comps — $/sqft
last 12 mo · ≤1 miLoading sold comps…