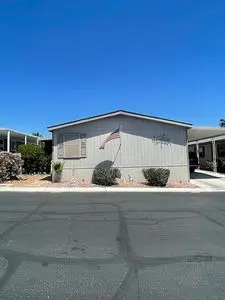
8122 W Flamingo Rd · Spring Valley, NV
Flood risk 1/10 · Minimal
- FEMA flood zone
- X (unshaded)
- Chance of flooding over 30 yrs
- 0.0%
- Est. flood insurance / yr
- $507 – $1,088
Fire risk 7/10 · Major
- Est. fire insurance / yr
- $490 – $910
Heat risk 7/10 · Major
- Hot days now (above 104°F)
- 7 days/yr
- Hot days in 30 yrs
- 17 days/yr
Wind risk 1/10 · Minimal
- Chance of severe wind over 30 yrs
- —
Air-quality risk 2/10 · Minimal
- Unhealthy air days now
- 1 days/yr
- Unhealthy air days in 30 yrs
- 1 days/yr
Risk factors via First Street. Map © Google.
Why this score? — see what drove the B- grade
The composite is a weighted blend of 9 inputs, each scored 0–100. Each bar is that input's sub-score; the figure is the points it added to the 100-point composite (weight × sub-score).
- Cash flow +30.0/30.0
- 1% rule +10.0/10.0
- DSCR +10.0/10.0
- ARV discount +7.5/15.0
- Livability +3.5/5.0
- Rent growth +2.8/5.0
- Schools +2.6/10.0
- Condition / age +2.5/5.0
- Appreciation +0.0/10.0
$105,000
🖨 Deal sheet 📄 Offer letter ✓ Due diligence
Listing remarks MLS
This is what you're looking for! Well-maintained newer home just built in 2016. 4 bedrooms on the low $400k's in a gated community! Open Floor plan with all tiles downstairs, includes a nice Island granite countertop, walk-in pantry, and updated dark cabinetry, Refrigerator washer and dryer included! The spacious primary bedroom has a walk-in closet plus a shower and tub in the master's bath. Good size backyard for your personal architectural design. Great southwest location in a gated community with less than $50 in HOA fee!
Key facts
- New kitchen
- Walk-in closets
- Wood floor
Tags
Neighborhood map
What this means for you Summary
Snapshot
- This is a 3-bed/2.5-bath single-family listed at $105k.
Deal economics
- At list price, monthly cash flow is $756 ($9k/yr) — positive.
- The deal already cash-flows at list — no discount required.
- Meets the 1% rule at list price ($2k rent vs $105k).
- Recommended offer: $103k (1.5% below list) — sets the bar for market timing.
Location & tenants
- Location reads 70/100 on livability (#28 in NV) — a middle-class / working-renter tenant base. Strengths: housing A+, commute A; Watch: crime C-, schools D+, amenities F.
- Clark County School District (urban): math 21% / reading 39% proficiency, ranked #11 of 17 in NV (top 65%) — families likely to look elsewhere, expect single-tenant / working-renter base with shorter leases.
- Market conditions: Rents rising (+1.2%/yr); 282 active listings in the ZIP; 40 comparable units currently listed for rent nearby; rentals at typical pace (median 24d on market — plan ~3-4 weeks tenant-placement turnaround); 14,754 units permitted in Clark County in 2024 (2,301 in 5+ unit buildings).
- This rent runs 34% of the median local income ($75k/yr) — at the standard rent-burdened threshold; future hikes will face affordability resistance.
Forward outlook
- Local home prices are declining (-3.0%/yr); year-one equity from $726 of loan paydown is wiped out by about $3k of value loss. Plan a longer hold.
- Clark County population projected at +36% by 2050 — long-run rental-demand tailwind backs the buy-and-hold thesis.
- At projected returns (-3.0% appreciation + 1.2% rent growth), your $29k cash investment doubles in ~5 years — after that, you're playing with house money.
Negotiation context
- It's been on market 23 days — a 2% lower offer ($103k) is reasonable based on typical stale-listing flexibility.
- 2 sale attempts since 5y ago with the ask held roughly flat each time — persistent listings suggest the price (not the market) is what's stuck; bring a comps-based counter.
Risks & watch-outs
- Watch-outs: property tax is 3.9% of price.
- Climate carrying-cost: major wildfire risk; extreme-heat days projected 7→17/yr by 2055 (HVAC capex compounding) — expect insurance premiums to compound above CPI over the hold.
Questions for the listing agent
- Property tax is high relative to price — has the assessment been appealed recently, and will the sale trigger a re-assessment?
- Is there a deadline driving the sale (1031 exchange, divorce, estate, relocation)? That informs how much negotiation room exists.
- Schools are D-rated, which usually means shorter tenancies and higher turnover. Who's the typical renter profile here, and what's been the actual vacancy rate?
- What's the average days-on-market for RENTAL listings here right now (not sales)? A rising rental-DOM trend means longer vacancies and softer asking-rent achievability than the comps imply.
- What's the recent tenant-quality profile in this submarket — average credit score on applications, eviction rate, late-payment / NSF rate, and stable-employment percentage? A property-management company in the area should have these aggregated.
- How much new for-sale + rental construction is in the pipeline within 1–3 miles? Heavy new supply typically softens prices + rents 12–24 months out; constrained supply supports both.
Investment metrics
- 1% rule
- 2.03% ✓
- Cap rate
- 14.93%
- Cash-on-cash
- 30.84%
- DSCR
- 2.37
- GRM
- 4.1
CMA / ARV
No comps found within radius.
Projected returns pro-forma
-3.0% appreciation · 1.22% rent growth · sell at horizon
- IRR
- 23.4%
- Equity multiple
- 1.94×
- Total profit
- $27,506
- Equity at exit
- $15,656
- IRR
- 30.0%
- Equity multiple
- 3.44×
- Total profit
- $71,677
- Equity at exit
- $9,078
Cash invested: $29,400 (down + closing). Projections, not guarantees.
Landlord ↔ Tenant lean methodology
- Overall (STATE)
- 71 Landlord-Friendly
- State Nevada
- 71 Landlord-Friendly · R+1
- County
- — inherits STATE
- City
- — inherits STATE
ZIP-level market 89147
- Rents YoY
- 1.2%
- Active inventory
- 282
- Price-to-rent
- 4.1×
Monthly cashflow live
- Estimated rent
- $2,137 high interval (Pro) →
- Mortgage (P&I)
- −$551
- Tax from tax record
- −$338 /mo · $4,055/yr
- Insurance
- −$44
- HOA
- −$0
- Vacancy / Maint / Mgmt
- −$449
- Net cashflow
- $756
Break-even live
UW: 25.0% down · 7.5% · 30yr · 1.5% tax · 5.0% vac · 8.0% maint · 8.0% mgmt
Financing live
Cash to close
- Down payment
- $26,250
- Closing costs
- $3,150
- Reserves months
- —
- Total cash needed
- —
Loan-product check · same deal, 3 products live
Conventional
25% down · 7.5% · 30yr
- Down + closing
- —
- Monthly P&I
- —
- Monthly cashflow
- —
- DSCR
- —
- Eligible?
- —
Personal DTI + credit; lowest rate.
DSCR
20% down · 8.5% · 30yr
- Down + closing
- —
- Monthly P&I
- —
- Monthly cashflow
- —
- DSCR
- —
- Eligible?
- —
No personal income docs; deal must DSCR.
Hard money
10% down · 12.0% · 12mo
- Down + closing
- —
- Monthly P&I
- —
- Monthly cashflow
- —
- DSCR
- —
- Eligible?
- —
Short-term bridge; refi at stabilization.
Rent comps 40 comps
| Address | Beds | Baths | Sqft | Rent | $/sqft | DOM | Units | Dist |
|---|---|---|---|---|---|---|---|---|
| 496 Bright Peridot Ave Las Vegas, NV | 3.0 | 3.0 | 2174 | $2,350 | $1.08 | 24d | 1 | 0.10mi |
| 880 Cool Aquamarine St Las Vegas, NV | 3.0 | 2.5 | 1737 | $2,295 | $1.32 | 24d | 1 | 0.13mi |
| 569 Port Talbot Ave Las Vegas, NV | 3.0 | 2.5 | 1546 | $1,850 | $1.20 | 15d | 1 | 0.15mi |
| 750 Iron Bridge St Las Vegas, NV | 3.0 | 2.5 | 1671 | $2,150 | $1.29 | 16d | 1 | 0.18mi |
| 604 Port Talbot Ave Las Vegas, NV | 3.0 | 2.5 | 1732 | $1,800 | $1.04 | 44d | 1 | 0.19mi |
| 628 Wounded Star Ave Las Vegas, NV | 3.0 | 2.5 | 2003 | $2,440 | $1.22 | 44d | 1 | 0.20mi |
| 711 Iron Bridge St Las Vegas, NV | 3.0 | 2.5 | 1732 | $1,875 | $1.08 | 3d | 1 | 0.22mi |
| 734 Thornford St Las Vegas, NV | 3.0 | 3.0 | 1844 | $2,300 | $1.25 | 44d | 1 | 0.24mi |
| 718 Thornford St Las Vegas, NV | 3.0 | 3.5 | 1844 | $1,895 | $1.03 | 3d | 1 | 0.25mi |
| 718 Thornford St Las Vegas, NV | 3.0 | 2.5 | 1844 | $1,998 | $1.08 | 24d | 1 | 0.25mi |
| 652 Shadwell St Las Vegas, NV | 4.0 | 2.5 | 1891 | $2,180 | $1.15 | 44d | 1 | 0.26mi |
| 541 Penzance Ct Las Vegas, NV | 3.0 | 2.5 | 1301 | $1,900 | $1.46 | 44d | 1 | 0.36mi |
| 992 Whitworth Ave Las Vegas, NV | 3.0 | 2.5 | 2177 | $2,395 | $1.10 | 24d | 1 | 0.37mi |
| 600 Belsay Castle Ct Las Vegas, NV | 4.0 | 2.5 | 2034 | $2,050 | $1.01 | 44d | 1 | 0.38mi |
| 779 Proud Waters Ct Las Vegas, NV | 3.0 | 2.5 | 1782 | $2,300 | $1.29 | 4d | 1 | 0.39mi |
| 536 Mayfair Walk Ave Las Vegas, NV | 3.0 | 2.5 | 1611 | $1,895 | $1.18 | 44d | 1 | 0.44mi |
| 570 Swiss Cottage Ave Las Vegas, NV | 3.0 | 2.5 | 1484 | $2,120 | $1.43 | 3d | 1 | 0.47mi |
| 9342 Winebrook Ave Las Vegas, NV | 3.0 | 2.5 | 2103 | $1,950 | $0.93 | 44d | 1 | 0.53mi |
| 711 Quayside Ct Las Vegas, NV | 3.0 | 2.5 | 1725 | $1,950 | $1.13 | 24d | 1 | 0.54mi |
| 715 Quayside Ct Las Vegas, NV | 3.0 | 2.5 | 2000 | $2,050 | $1.02 | 24d | 1 | 0.55mi |
| 715 Quayside Ct Las Vegas, NV | 4.0 | 2.5 | 2000 | $2,050 | $1.02 | 15d | 1 | 0.55mi |
| 9343 Winebrook Ave Las Vegas, NV | 3.0 | 2.5 | 2104 | $1,895 | $0.90 | 44d | 1 | 0.55mi |
| 9560 Greensburg Ave Las Vegas, NV | 3.0 | 2.5 | 2135 | $2,000 | $0.94 | 44d | 1 | 0.55mi |
| 9584 Greensburg Ave Las Vegas, NV | 3.0 | 2.5 | 2145 | $2,050 | $0.96 | 24d | 1 | 0.56mi |
| 9262 William Hill Ave Las Vegas, NV | 3.0 | 2.5 | 1769 | $1,900 | $1.07 | 10d | 1 | 0.59mi |
| 8944 Rutherford Grove St Las Vegas, NV | 3.0 | 2.5 | 1769 | $2,000 | $1.13 | 4d | 1 | 0.59mi |
| 9033 Quintessa Cove St Las Vegas, NV | 3.0 | 2.5 | 1769 | $1,925 | $1.09 | 44d | 1 | 0.60mi |
| 197 Short Ruff Way Las Vegas, NV | 3.0 | 2.5 | 1820 | $1,950 | $1.07 | 44d | 1 | 0.61mi |
| 9183 Vintage Wine Ave Las Vegas, NV | 3.0 | 2.5 | 1935 | $2,101 | $1.09 | 15d | 1 | 0.61mi |
| 80 Island Course Ave Las Vegas, NV | 3.0 | 2.5 | 1536 | $2,050 | $1.33 | 8d | 1 | 0.62mi |
| 9072 Cedar Door Ave Las Vegas, NV | 4.0 | 3.0 | 1775 | $2,200 | $1.24 | 12d | 1 | 0.64mi |
| 232 Garden Trellis Ct Las Vegas, NV | 4.0 | 3.0 | 1838 | $2,500 | $1.36 | 12d | 1 | 0.64mi |
| 232 Garden Trellis Ct Las Vegas, NV | 4.0 | 3.0 | 1849 | $2,500 | $1.35 | 24d | 1 | 0.64mi |
| 9032 Rutherford Grove St Las Vegas, NV | 3.0 | 2.5 | 1935 | $1,955 | $1.01 | 2d | 1 | 0.66mi |
| 254 Botanic Gardens Dr Las Vegas, NV | 4.0 | 3.5 | 2227 | $2,395 | $1.08 | 4d | 1 | 0.66mi |
| 284 Trailing Putt Way Las Vegas, NV | 3.0 | 2.5 | 1714 | $2,600 | $1.52 | 18d | 1 | 0.68mi |
| 446 Center Green Dr Las Vegas, NV | 4.0 | 2.5 | 2119 | $2,450 | $1.16 | 44d | 1 | 0.68mi |
| 9070 Vintage Wine Ave Las Vegas, NV | 4.0 | 2.5 | 2036 | $2,200 | $1.08 | 44d | 1 | 0.70mi |
| 285 Ladies Tee Ct Las Vegas, NV | 3.0 | 2.5 | 1829 | $2,195 | $1.20 | 44d | 1 | 0.70mi |
| 173 Water Hazard Ln Las Vegas, NV | 4.0 | 2.5 | 2119 | $2,450 | $1.16 | 16d | 1 | 0.70mi |
Listing history 19 events
-
2026-06-18days on market $105,000 Active 23 DOM
-
2026-06-17days on market $105,000 Active 22 DOM
-
2026-06-16days on market $105,000 Active 21 DOM
-
2026-06-15days on market $105,000 Active 20 DOM
-
2026-06-13days on market $105,000 Active 18 DOM
-
2026-06-09days on market $105,000 Active 14 DOM
-
2026-06-08days on market $105,000 Active 13 DOM
-
2026-06-08days on market $105,000 Active 12 DOM
-
2026-06-03days on market $105,000 Active 8 DOM
-
2026-06-02days on market $105,000 Active 7 DOM
-
2026-06-01days on market $105,000 Active 6 DOM
-
2026-05-31days on market $105,000 Active 5 DOM
-
2026-05-26$105,000 Active
-
2022-04-22price $2,195
-
2022-01-20soldstatus $435,000 Closed 531-char remark
Show marketing remark (531 chars)
This is what you're looking for! Well-maintained newer home just built in 2016. 4 bedrooms on the low $400k's in a gated community! Open Floor plan with all tiles downstairs, includes a nice Island granite countertop, walk-in pantry, and updated dark cabinetry, Refrigerator washer and dryer included! The spacious primary bedroom has a walk-in closet plus a shower and tub in the master's bath. Good size backyard for your personal architectural design. Great southwest location in a gated community with less than $50 in HOA fee!
-
2022-01-20soldstatus $435,000
Show marketing remark (531 chars)
This is what you're looking for! Well-maintained newer home just built in 2016. 4 bedrooms on the low $400k's in a gated community! Open Floor plan with all tiles downstairs, includes a nice Island granite countertop, walk-in pantry, and updated dark cabinetry, Refrigerator washer and dryer included! The spacious primary bedroom has a walk-in closet plus a shower and tub in the master's bath. Good size backyard for your personal architectural design. Great southwest location in a gated community with less than $50 in HOA fee!
-
2021-12-16status Pending 531-char remark
Show marketing remark (531 chars)
This is what you're looking for! Well-maintained newer home just built in 2016. 4 bedrooms on the low $400k's in a gated community! Open Floor plan with all tiles downstairs, includes a nice Island granite countertop, walk-in pantry, and updated dark cabinetry, Refrigerator washer and dryer included! The spacious primary bedroom has a walk-in closet plus a shower and tub in the master's bath. Good size backyard for your personal architectural design. Great southwest location in a gated community with less than $50 in HOA fee!
-
2021-12-05$415,990 Active 531-char remark
Show marketing remark (531 chars)
This is what you're looking for! Well-maintained newer home just built in 2016. 4 bedrooms on the low $400k's in a gated community! Open Floor plan with all tiles downstairs, includes a nice Island granite countertop, walk-in pantry, and updated dark cabinetry, Refrigerator washer and dryer included! The spacious primary bedroom has a walk-in closet plus a shower and tub in the master's bath. Good size backyard for your personal architectural design. Great southwest location in a gated community with less than $50 in HOA fee!
-
2021-12-05historical $415,990 531-char remark
Show marketing remark (531 chars)
This is what you're looking for! Well-maintained newer home just built in 2016. 4 bedrooms on the low $400k's in a gated community! Open Floor plan with all tiles downstairs, includes a nice Island granite countertop, walk-in pantry, and updated dark cabinetry, Refrigerator washer and dryer included! The spacious primary bedroom has a walk-in closet plus a shower and tub in the master's bath. Good size backyard for your personal architectural design. Great southwest location in a gated community with less than $50 in HOA fee!
ⓘ Source: listings_history table (triggers on properties + properties_extension) + one-shot
backfill from property_details.listing_events for pre-trigger history.
Tax reassessment forecast NV · Resets to sale price
- Current annual tax
- $4,055 · $338/mo
- Projected year-2 tax
- $4,055 · $338/mo
- Expected delta
- $0/yr ($0/mo · -0.0%)
ⓘ Screening estimate from a state-policy table — verify with the county assessor before closing.
Climate risk First Street
- Flood 1/10 Low FEMA zone X (unshaded) · 0% chance over 30 yrs
- Wildfire 7/10 Severe
- Heat 7/10 Severe 7 d/yr ≥104°F today · 17 d/yr by 30 yrs out
- Wind 1/10 Low
- Air quality 2/10 Low 1 unhealthy d/yr today · 1 by 30 yrs out
Nearby sold comps map
Loading sold comps map…
Walkable amenities ~0.75 mi
Loading nearby amenities…
Taxation est. · year 1
- Rental income
- $25,639
- − Mortgage interest
- −$5,882
- − Property taxes
- −$4,055
- − Insurance
- −$525
- − Repairs & maintenance
- −$2,051
- − Management
- −$2,051
- − Depreciation
- −$3,055
- Taxable income
- $8,020
- Est. tax owed @ 24.0%
- −$1,925
- After-tax cash flow
- $7,142/yr
For passive investors: Depreciation is non-cash, so a rental often shows a tax loss while cash-flowing — sheltering income. Rental losses are passive: they offset passive income freely, and up to $25,000/yr can offset ordinary (W-2) income if you actively participate and your MAGI is under $100k (phasing out to $0 by $150k); unused losses carry forward. On sale, claimed depreciation is recaptured at up to 25%, and gains may owe capital-gains tax (a 1031 exchange can defer both). Figures are a year-1 estimate at your 24.0% rate — not tax advice; consult a CPA.
Schools (NCES district)
- District
- Clark County School District
- NCES district ID
- 3200060
- Math proficiency
- 21% ▼ -13.00%
- Reading proficiency
- 39% ▼ -8.00%
- Median HH income
- $53,611
- Composite
- 26.48/100
- National rank
- #7211
- State rank
- #11 of 17 in NV
Livability — Spring Valley
- Score
- 70/100
- State rank
- #28
- US rank
- #8005
Category grades
Schools grade is shown separately in the Schools card above.
Census & demographics
- Census place
- Spring Valley, NV
- County
- Clark County · 2,306,105 people
- City population
- 251,006
- Metro
- Las Vegas-Henderson-Paradise, NV
- Population (ZIP)
- 55,969
- Household income
- $74,985
- Rent vs Own
- Severe rent burden
- 2729.0
Population outlook (Clark County) Hauer SSP2
- Today (2025)
- 2,504,101 people
- By 2030
- 2,693,770 · +7.6%
- By 2040
- 3,061,208 · +22.2%
- By 2050
- 3,400,072 · +35.8%
- By 2075
- 4,139,522 · +65.3%
- By 2100
- 4,596,916 · +83.6%
Race, ethnicity, and origin ACS 2023
- Neighborhood character
- Highly diverse neighborhood (Simpson 0.76)
- Race & ethnicity
- White 35% Hispanic / Latino 24% Asian 19% Black 14% Two or more races 13%
- Hispanic origin (detail)
- Mexican 16% Puerto Rican 1% Cuban 2%
- Common ancestry
- Romanian 2% Slovak 1% Lithuanian 1%
- Foreign-born
- 28% · Canada, China, Vietnam
- Languages at home
- 60% English-only · Spanish 16% Tagalog/Filipino 6% Chinese 5%
Political lean MEDSL · Clark
- 2024 margin
- Toss-up / Even · D 50.4% · R 47.8% · Other 1.7%
- 2008→2024 swing
- -16.5pp toward R · 2008: 19.1pp · 2024: 2.6pp
- All cycles
- 2024: D+2.6 2020: D+9.3 2016: D+10.7 2012: D+14.5 2008: D+19.1
Not yet ingested
- Civics
- —
Market trends
- HPI YoY
- ▼ -162.78%
- Current HPI
- 269.3557
- Rent YoY
- ▲ 1.22%
- Metro
- Las Vegas-Henderson-Paradise, NV
- State GDP YoY
- ▲ 3.08%
- F500 in state
- 6
Industry mix (Fortune 500 HQ in NV)
| Industry | F500 HQs | Revenue |
|---|---|---|
| Hotels / Casinos | 3 | $36B |
|
||
Price history
-74.8% since first listed7 events — show timeline
- 2026-05-26 Listed $105,000 FSBO.com
- 2022-04-22 Price Changed $2,195 RENT.
- 2022-01-20 Sold (Public Records) $435,000 Public Records
- 2022-01-20 Sold (MLS) $435,000 GLVAR
- 2021-12-16 Pending — GLVAR
- 2021-12-05 Listed $415,990 GLVAR
- 2021-12-05 Coming Soon $415,990 GLVAR
Property tax history
+5.7%/yrLatest (2025): $4,055 · +6.1% YoY. Source: county tax records.
Cash-flow waterfall
monthlySold comps — $/sqft
last 12 mo · ≤1 miLoading sold comps…