7393 US Hwy 160 West · Doniphan, MO
Flood risk 1/10 · Minimal
- FEMA flood zone
- X (unshaded)
- Chance of flooding over 30 yrs
- 0.0%
- Est. flood insurance / yr
- $507 – $1,088
Fire risk 5/10 · Moderate
- Est. fire insurance / yr
- $1,054 – $1,958
Heat risk 5/10 · Moderate
- Hot days now (above 108°F)
- 7 days/yr
- Hot days in 30 yrs
- 20 days/yr
Wind risk 2/10 · Minimal
- Chance of severe wind over 30 yrs
- 3.0%
Air-quality risk 1/10 · Minimal
- Unhealthy air days now
- 0 days/yr
- Unhealthy air days in 30 yrs
- 0 days/yr
Risk factors via First Street. Map © Google.
Why this score? — see what drove the D grade
The composite is a weighted blend of 9 inputs, each scored 0–100. Each bar is that input's sub-score; the figure is the points it added to the 100-point composite (weight × sub-score).
- Cash flow +10.2/30.0
- Appreciation +7.6/10.0
- ARV discount +7.4/15.0
- 1% rule +3.0/10.0
- Livability +3.0/5.0
- DSCR +2.9/10.0
- Schools +2.7/10.0
- Rent growth +2.5/5.0
- Condition / age +2.2/5.0
$169,900
🖨 Deal sheet (PDF) 📄 Offer letter ✓ Due diligence
Listing remarks
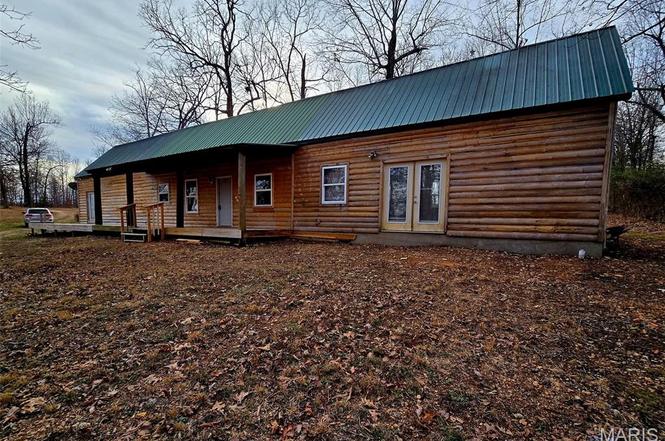
If you have spent hours looking for peace, tranquility, seclusion and privacy and just a solid piece of mind as you sit on that big covered front porch, this is it. Step off the porch of this 2200 sq ft, 4 bedroom, 2 bath large log home and walk off of your awesome 5 acres in to thousands of acres of the Mark Twain National Forest, that is in abundance of wildlife and not too far from the 20 acre Ripley County Lake. Completely surrounded by woods positioned way back from 160 West Hwy right beside the District #1 water tower. Beautiful 5 acre property features County water, nice well, home with all new windows and newer porch, metal roof, 2 hot water heaters inside and all kitchen appliances
Key facts
- Covered front porch
- County water
- Metal roof
Tags
Property features AI
Finance
- Other: Property listed as residential single family; Approximately 2,200 living area (source: appraiser); Lot adjoins government land and wooded area, cleared, gently rolling, interior lot with some trees, suitable for horses, secluded, pasture; paved access; Approximately 5 acres (per public records)
- Financial info: Lease not considered
- HOA & community: No association
Exterior
- Parking: Unpaved parking
- Security: Security features vary by unit
- Utilities: Public and well water sources; Septic tank; 220 volt electric service; Cable available; Electricity available; Phone available; Propane available; Water available
- Home design: Single family residence; One level; Log construction; Metal roof
- Construction: Log construction; Metal roof; Concrete basement
- Exterior features: Covered porch; Private yard; No fencing
Interior
- Kitchen: Electric cooktop; Dishwasher; Refrigerator; Exhaust/vented exhaust fan
- Bedrooms: 5 bedrooms total; 1 bedroom on the main level; 4 bedrooms on main and upper levels; 3 bedrooms on the upper level; 1 bedroom on the lower level
- Flooring: Hardwood; Tile
- Bathrooms: 2 full bathrooms total; 2 full bathrooms on the main level
- Heating & cooling: Space heater; Wall/window air conditioning units
- Interior features: Electric cooktop; Dishwasher; Exhaust/vented exhaust fan; Refrigerator; Concrete basement
- Laundry & utility: 220 volt electric service
Neighborhood map
What this means for you Summary
Snapshot
- This is a 5-bed/2.0-bath single-family listed at $170k. Condition is rated fair.
Deal economics
- At list price, monthly cash flow is $-96 ($-1k/yr) — negative.
- To cash-flow at today's rent, offer at most $156k (8.2% below list).
- To meet the 1% rule (rent ≥ 1% of price), the offer needs to be $136k (19.7% below list).
- Recommended offer: $136k (19.7% below list) — sets the bar for 1% rule.
- Cap rate 5.6% vs local median 2.6% in Doniphan — top-decile yield for the area; either an underpriced asset or a hidden risk that comps aren't pricing in. Stress-test before assuming the spread holds.
Location & tenants
- Location reads 59/100 on livability (#568 in MO) — a working-class tenant base; expect higher turnover. Strengths: cost of living A+, housing A-; Watch: health & safety C-, amenities F, commute F.
- Ripley County R-IV (rural): math 25% / reading 35% proficiency, ranked #470 of 535 in MO (top 88%) — families likely to look elsewhere, expect single-tenant / working-renter base with shorter leases; 70% free/reduced lunch — lower-income household profile, screen leases tightly.
- Zoned schools: Ripley Co. Elem. (math 12% / reading 32%, grade F, #910 of 1,115 statewide, top 83%, 123 students, 71% FRL) — zoned schools at 71% FRL track the district average.
- Market conditions: 128 active listings in the ZIP.
Forward outlook
- In year one you build about $10k of equity ($1k loan paydown + $9k appreciation (5.1% local appreciation)).
- Ripley County population projected at -20% by 2050 — secular population decline; favor cash flow + early exit over multi-decade hold.
- By year 4, paydown + projected appreciation supports a ~$34k cash-out refi (75% LTV) — recoverable capital for the next deal without selling this one.
Negotiation context
- It's been on market 82 days — a 6% lower offer ($160k) is reasonable based on typical stale-listing flexibility.
- 2 sale attempts; this cycle's ask is 6% above the opening price — seller raised mid-cycle; expect resistance to lowballs.
Risks & watch-outs
- Climate carrying-cost: moderate wildfire risk; extreme-heat days projected 7→20/yr by 2055 (HVAC capex compounding) — expect insurance premiums to compound above CPI over the hold.
Questions for the listing agent
- What do current leases actually rent for vs. the listed asking? Can we see a recent rent roll and the last 12 months of T-12 income?
- It's been on market 82 days. Have you received any prior offers? Is the seller open to a 20% concession, seller financing, or rate buy-down credit?
- Have any recent inspections been done? Can we get a copy of the seller's disclosures and any deferred-maintenance estimates?
- Why hasn't it sold? Are there any deal-killer items the seller is aware of (foundation, flood, title, zoning, code violations)?
- Is there a deadline driving the sale (1031 exchange, divorce, estate, relocation)? That informs how much negotiation room exists.
- Schools are D-rated, which usually means shorter tenancies and higher turnover. Who's the typical renter profile here, and what's been the actual vacancy rate?
- The area grade is low — what's the realistic commute time and amenity access for the typical tenant pool here? Any planned neighborhood developments (good or bad) we should know about?
- What's the average days-on-market for RENTAL listings here right now (not sales)? A rising rental-DOM trend means longer vacancies and softer asking-rent achievability than the comps imply.
- What's the recent tenant-quality profile in this submarket — average credit score on applications, eviction rate, late-payment / NSF rate, and stable-employment percentage? A property-management company in the area should have these aggregated.
- How much new for-sale + rental construction is in the pipeline within 1–3 miles? Heavy new supply typically softens prices + rents 12–24 months out; constrained supply supports both.
Investment metrics
- 1% rule
- 0.80% ✗
- Cap rate
- 5.61%
- Cash-on-cash
- -2.43%
- DSCR
- 0.89
- GRM
- 10.4
CMA / ARV
- ARV (on-the-fly)
- $169,400
- Comps found
- 1
Show comp detail 1 sale within ~0.75 mi
| Address | Dist | Beds/Ba | Sqft | Sold | Price | $/sf | Match |
|---|---|---|---|---|---|---|---|
| 7393 US Hwy 160 West | 0.00mi | 5/2.0 | 2,200 (0%) | 1mo | $169,900 | $77 | 99 |
Match score weights: distance 35% · size 25% · config 20% · recency 20%. Top-matched comps best support the ARV.
Projected returns pro-forma
5.14% appreciation · 3.0% rent growth · sell at horizon
- IRR
- 11.2%
- Equity multiple
- 1.72×
- Total profit
- $34,410
- Equity at exit
- $97,724
- IRR
- 12.4%
- Equity multiple
- 3.29×
- Total profit
- $108,766
- Equity at exit
- $169,866
Cash invested: $47,572 (down + closing). Projections, not guarantees.
Landlord ↔ Tenant lean methodology
- Overall (STATE)
- 81 Strongly Landlord-Friendly
- State Missouri
- 81 Strongly Landlord-Friendly · R+10
- County
- — inherits STATE
- City
- — inherits STATE
ZIP-level market 63935
- Home prices YoY
- 4.4%
- Active inventory
- 128
- Price-to-rent
- 10.4×
Monthly cashflow live
- Estimated rent
- $1,364 medium interval (Pro) →
- Mortgage (P&I)
- −$891
- Tax est. 1.5%
- −$212 /mo · $2,548/yr
- Insurance
- −$71
- HOA
- −$0
- Vacancy / Maint / Mgmt
- −$287
- Net cashflow
- $-96
Break-even live
Sensitivity live
| Price | -10% $21 | -5% $-38 | +0% $-96 | +5% $-155 | +10% $-214 |
|---|---|---|---|---|---|
| Rent | -10% $-204 | -5% $-150 | +0% $-96 | +5% $-42 | +10% $12 |
| Rate | -1.0pp $-11 | -0.5pp $-53 | base $-96 | +0.5pp $-140 | +1.0pp $-185 |
UW: 25.0% down · 7.5% · 30yr · 1.5% tax · 5.0% vac · 8.0% maint · 8.0% mgmt
Financing live
Cash to close
- Down payment
- $42,475
- Closing costs
- $5,097
- Reserves months
- —
- Total cash needed
- —
Loan-product check · same deal, 3 products live
Conventional
25% down · 7.5% · 30yr
- Down + closing
- —
- Monthly P&I
- —
- Monthly cashflow
- —
- DSCR
- —
- Eligible?
- —
Personal DTI + credit; lowest rate.
DSCR
20% down · 8.5% · 30yr
- Down + closing
- —
- Monthly P&I
- —
- Monthly cashflow
- —
- DSCR
- —
- Eligible?
- —
No personal income docs; deal must DSCR.
Hard money
10% down · 12.0% · 12mo
- Down + closing
- —
- Monthly P&I
- —
- Monthly cashflow
- —
- DSCR
- —
- Eligible?
- —
Short-term bridge; refi at stabilization.
Listing history 5 events
-
2026-05-08status Pending
-
2026-03-18price $169,900
-
2026-03-18status Active
-
2026-03-11status Pending
-
2026-02-08$159,900 Active
ⓘ Source: listings_history table (triggers on properties + properties_extension) + one-shot
backfill from property_details.listing_events for pre-trigger history.
Climate risk First Street
- Flood 1/10 Low FEMA zone X (unshaded) · 0% chance over 30 yrs
- Wildfire 5/10 Major
- Heat 5/10 Major 7 d/yr ≥108°F today · 20 d/yr by 30 yrs out
- Wind 2/10 Low 3% chance of damaging wind over 30 yrs
- Air quality 1/10 Low 0 unhealthy d/yr today · 0 by 30 yrs out
Nearby sold comps map
Loading sold comps map…
Walkable amenities ~0.75 mi
Loading nearby amenities…
Taxation est. · year 1
- Rental income
- $16,374
- − Mortgage interest
- −$9,517
- − Property taxes
- −$2,548
- − Insurance
- −$850
- − Repairs & maintenance
- −$1,310
- − Management
- −$1,310
- − Depreciation
- −$4,943
- Taxable loss
- −$4,104
- Est. tax savings @ 24.0%
- +$985
- After-tax cash flow
- $-170/yr
For passive investors: Depreciation is non-cash, so a rental often shows a tax loss while cash-flowing — sheltering income. Rental losses are passive: they offset passive income freely, and up to $25,000/yr can offset ordinary (W-2) income if you actively participate and your MAGI is under $100k (phasing out to $0 by $150k); unused losses carry forward. On sale, claimed depreciation is recaptured at up to 25%, and gains may owe capital-gains tax (a 1031 exchange can defer both). Figures are a year-1 estimate at your 24.0% rate — not tax advice; consult a CPA.
Condition & rehab AI · 13 photos
This log cabin home, while in fair condition, requires moderate repairs and maintenance to improve its appearance and value. Key updates include painting, replacing worn flooring, and landscaping.
Repairs flagged
- Moderate Exterior siding — Weathered and shows signs of wear.
- Minor Kitchen cabinets — Dated but still functional.
- Minor Bathroom fixtures — Dated but still functional.
Value-add opportunities
- Resale Paint interior walls — Fresh paint can significantly improve the home's curb appeal and value.
- Resale Replace worn flooring — New flooring can enhance the home's appearance and increase its value.
- Both Landscaping and yard maintenance — A well-maintained yard can improve both resale and rental value.
Renovation cost estimate screening
| Repair item | Severity | Est. cost |
|---|---|---|
| Exterior siding · Weathered and shows signs of wear. | Moderate | $3,000–15,000 |
| Kitchen cabinets · Dated but still functional. | Minor | $500–3,000 |
| Bathroom fixtures · Dated but still functional. | Minor | $500–3,000 |
| Total estimated repair cost · 3 items | $4,000–21,000 |
Value-add ROI direction
- Resale Paint interior walls — Fresh paint can significantly improve the home's curb appeal and value. ↑
- Resale Replace worn flooring — New flooring can enhance the home's appearance and increase its value. ↑
- Both Landscaping and yard maintenance — A well-maintained yard can improve both resale and rental value. ↑
ⓘ Cost ranges are severity-bucket heuristics (US national rule-of-thumb). Get contractor quotes + a written scope before underwriting a rehab budget.
Schools (NCES district)
- District
- Ripley County R-IV
- NCES district ID
- 2926580
- Math proficiency
- 25% ▲ 5.00%
- Reading proficiency
- 35% ▲ 5.00%
- Median HH income
- $32,017
- Composite
- 27.3/100
- National rank
- #12424
- State rank
- #470 of 535 in MO
Livability — Doniphan
- Score
- 59/100
- State rank
- #568
- US rank
- #20561
Category grades
Schools grade is shown separately in the Schools card above.
Census & demographics
- Population (ZIP)
- 8,017
Population outlook (Ripley County) Hauer SSP2
- Today (2025)
- 13,011 people
- By 2030
- 12,515 · -3.8%
- By 2040
- 11,512 · -11.5%
- By 2050
- 10,427 · -19.9%
- By 2075
- 7,833 · -39.8%
- By 2100
- 5,692 · -56.3%
Race, ethnicity, and origin ACS 2023
- Neighborhood character
- Predominantly White (93%)
- Race & ethnicity
- White 93% Two or more races 5% Hispanic / Latino 1%
- Common ancestry
- Romanian 3% Slovak 3% Serbian 2%
- Foreign-born
- 1% · Canada
Political lean MEDSL · Ripley
- 2024 margin
- Solid R (+73.0) · D 13.2% · R 86.2%
- 2008→2024 swing
- -43.0pp toward R · 2008: -30.1pp · 2024: -73.0pp
- All cycles
- 2024: R+73.0 2020: R+70.1 2016: R+66.9 2012: R+44.6 2008: R+30.1
Not yet ingested
- Civics
- —
Market trends
- HPI YoY
- ▲ 5.14%
- Current HPI
- 122.3339
- Rent YoY
- —
- Metro
- —
- State GDP YoY
- ▲ 1.84%
- F500 in state
- 20
Industry mix (Fortune 500 HQ in MO)
| Industry | F500 HQs | Revenue |
|---|---|---|
| Healthcare | 1 | $163B |
|
||
| Insurance | 1 | $21B |
|
||
| Industrial Technology | 1 | $17B |
|
||
| Retail | 1 | $16B |
|
||
| Industrial Distribution | 1 | $10B |
|
||
| Utilities | 1 | $9B |
|
||
Price history
+6.3% since first listed5 events — show timeline
- 2026-05-08 Pending — MARIS as Distributed by MLS Grid
- 2026-03-18 Price Changed $169,900 MARIS as Distributed by MLS Grid
- 2026-03-18 Relisted — MARIS as Distributed by MLS Grid
- 2026-03-11 Pending — MARIS as Distributed by MLS Grid
- 2026-02-08 Listed $159,900 MARIS as Distributed by MLS Grid
Cash-flow waterfall
monthlySold comps — $/sqft
last 12 mo · ≤1 miLoading sold comps…